📊 View Form Answers as Charts
Explore survey and feedback answers, compare groups and export the results.
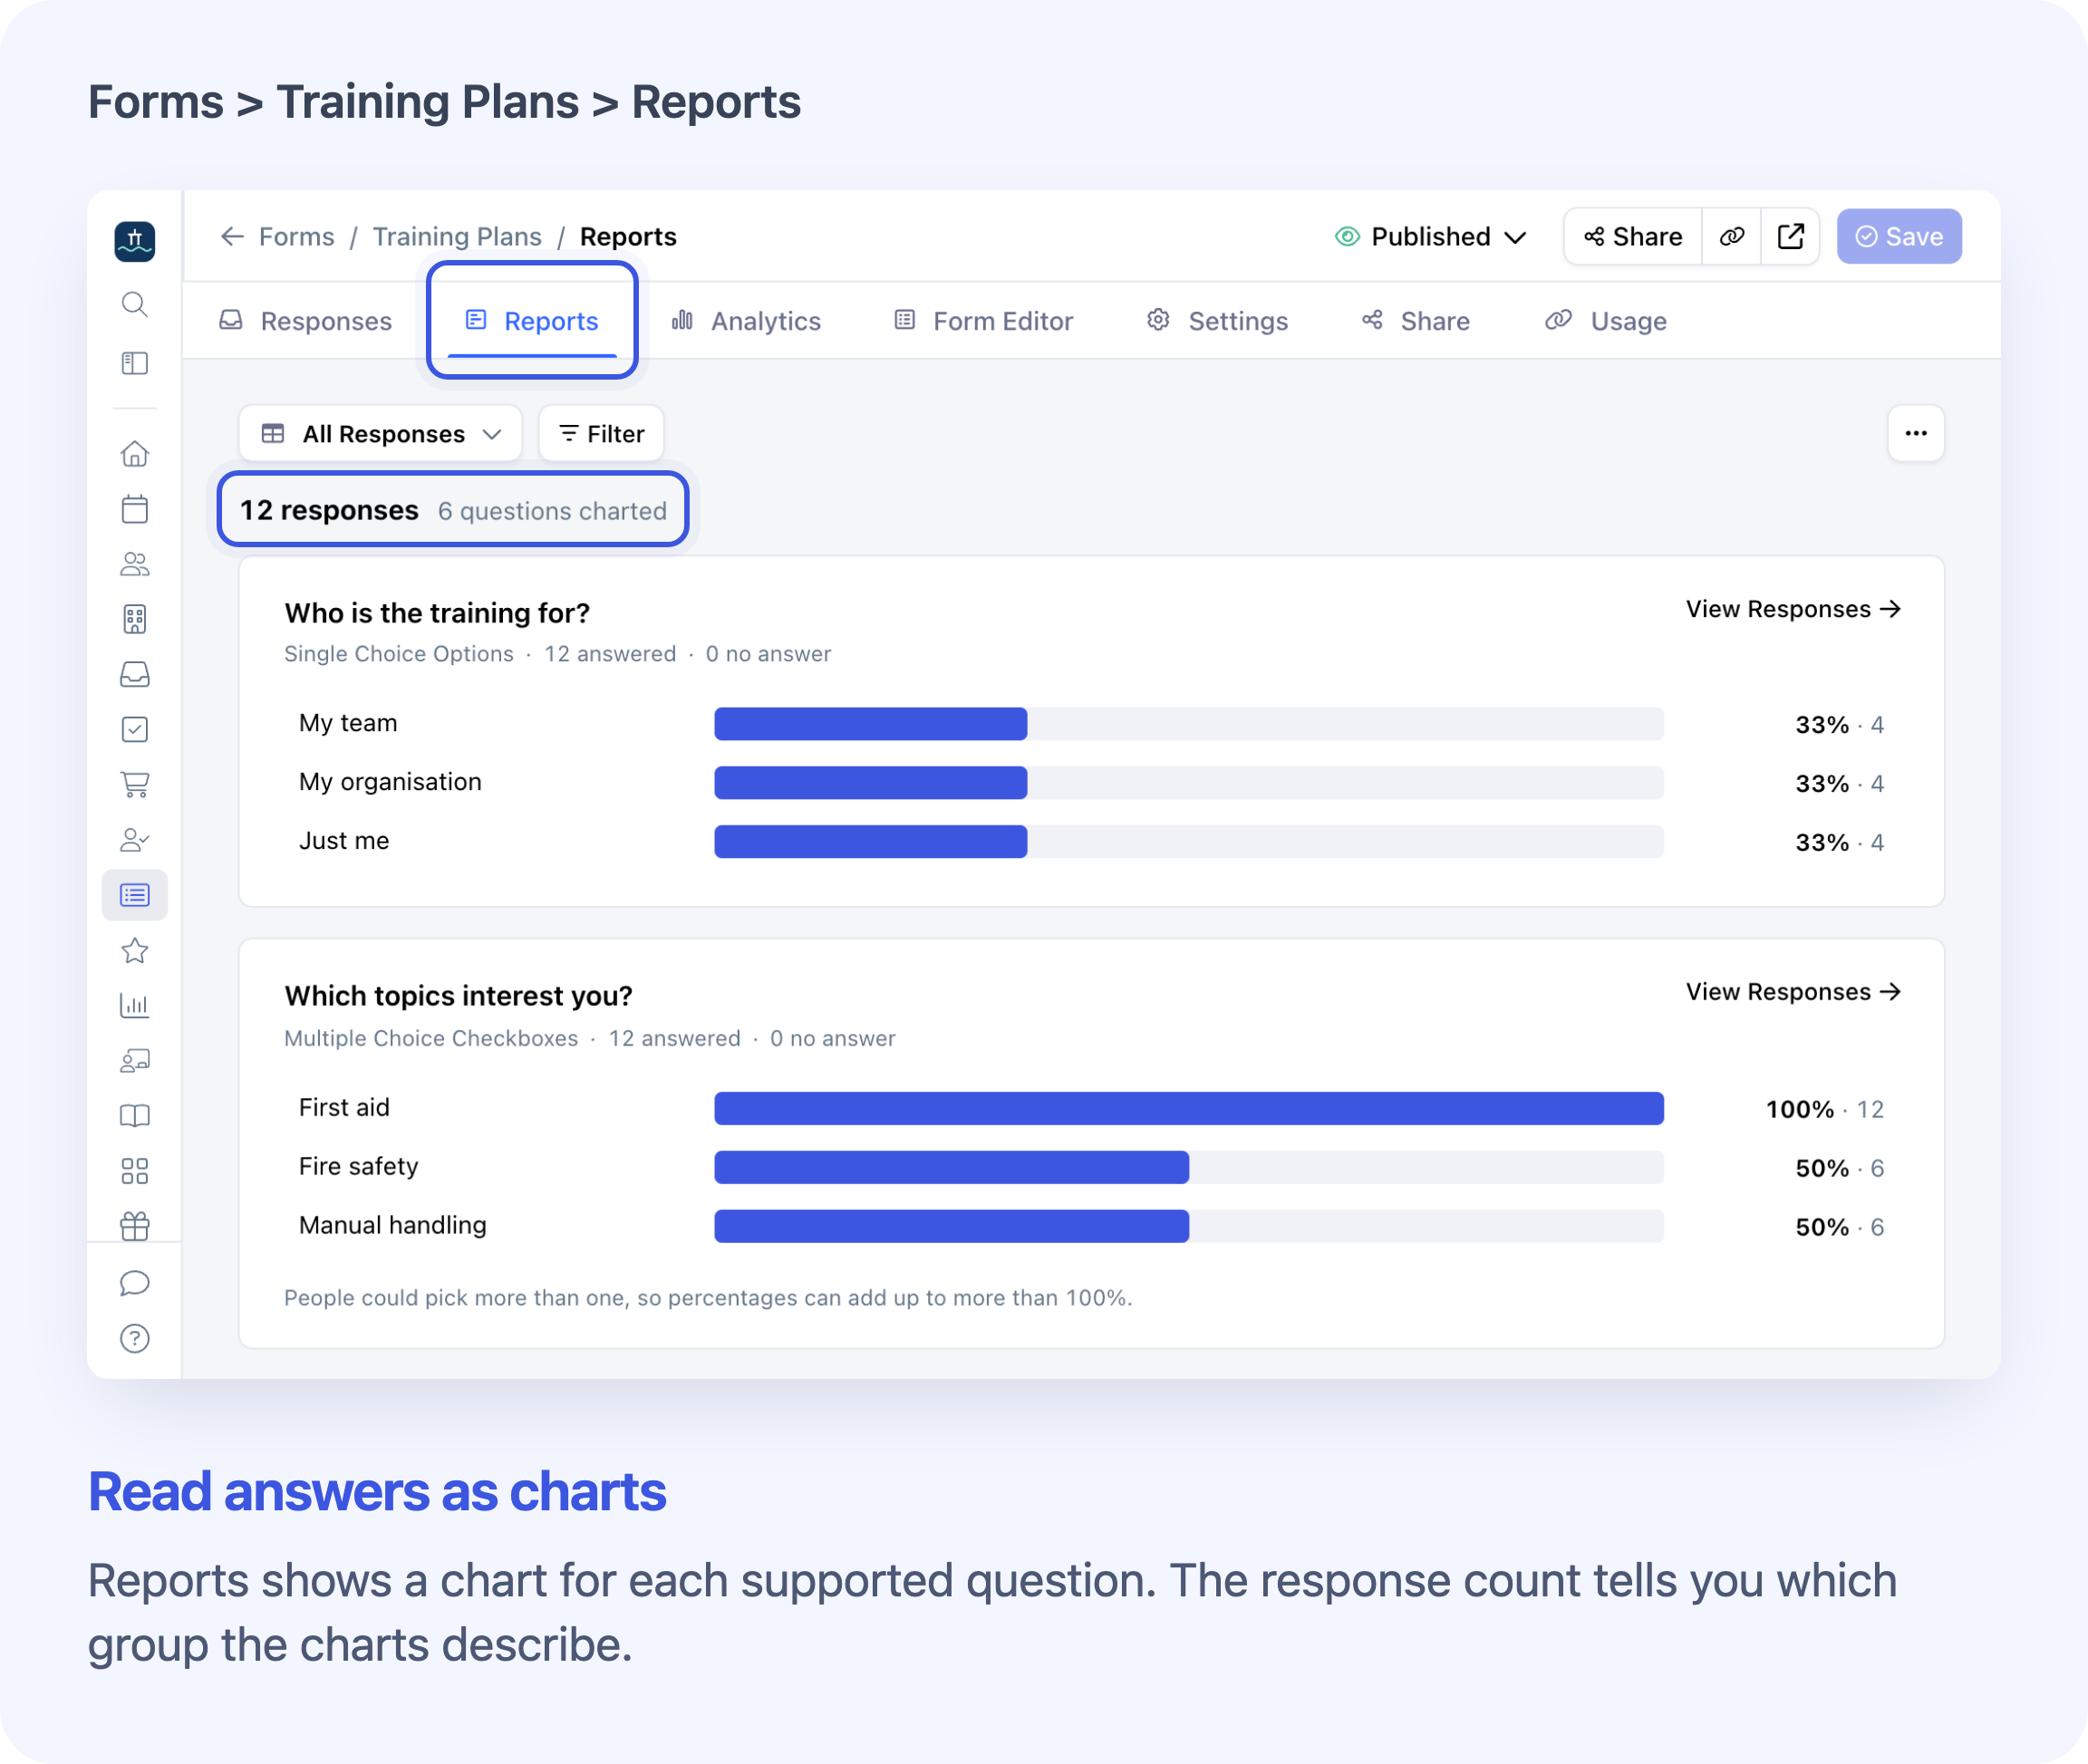
Form Reports turns answers from your forms into charts, averages and readable summaries. It works with General forms, such as enquiries and surveys, and Feedback forms used for course feedback. See which training topics people want, review ratings or explore answers from a particular group without building a spreadsheet first.
Open Forms → your form → Reports in the Admin Dashboard. One response is one submitted set of answers. Each supported question gets a summary, using responses you have already collected. Responses holds individual submissions; Analytics shows form views, submission totals and conversion over time.
Reports and question-answer filters are included on every Cademy plan. You need Course Owner or System Admin access. Each report covers one General or Feedback form; checkout forms are excluded.
View Question Charts, Averages and Answer Counts
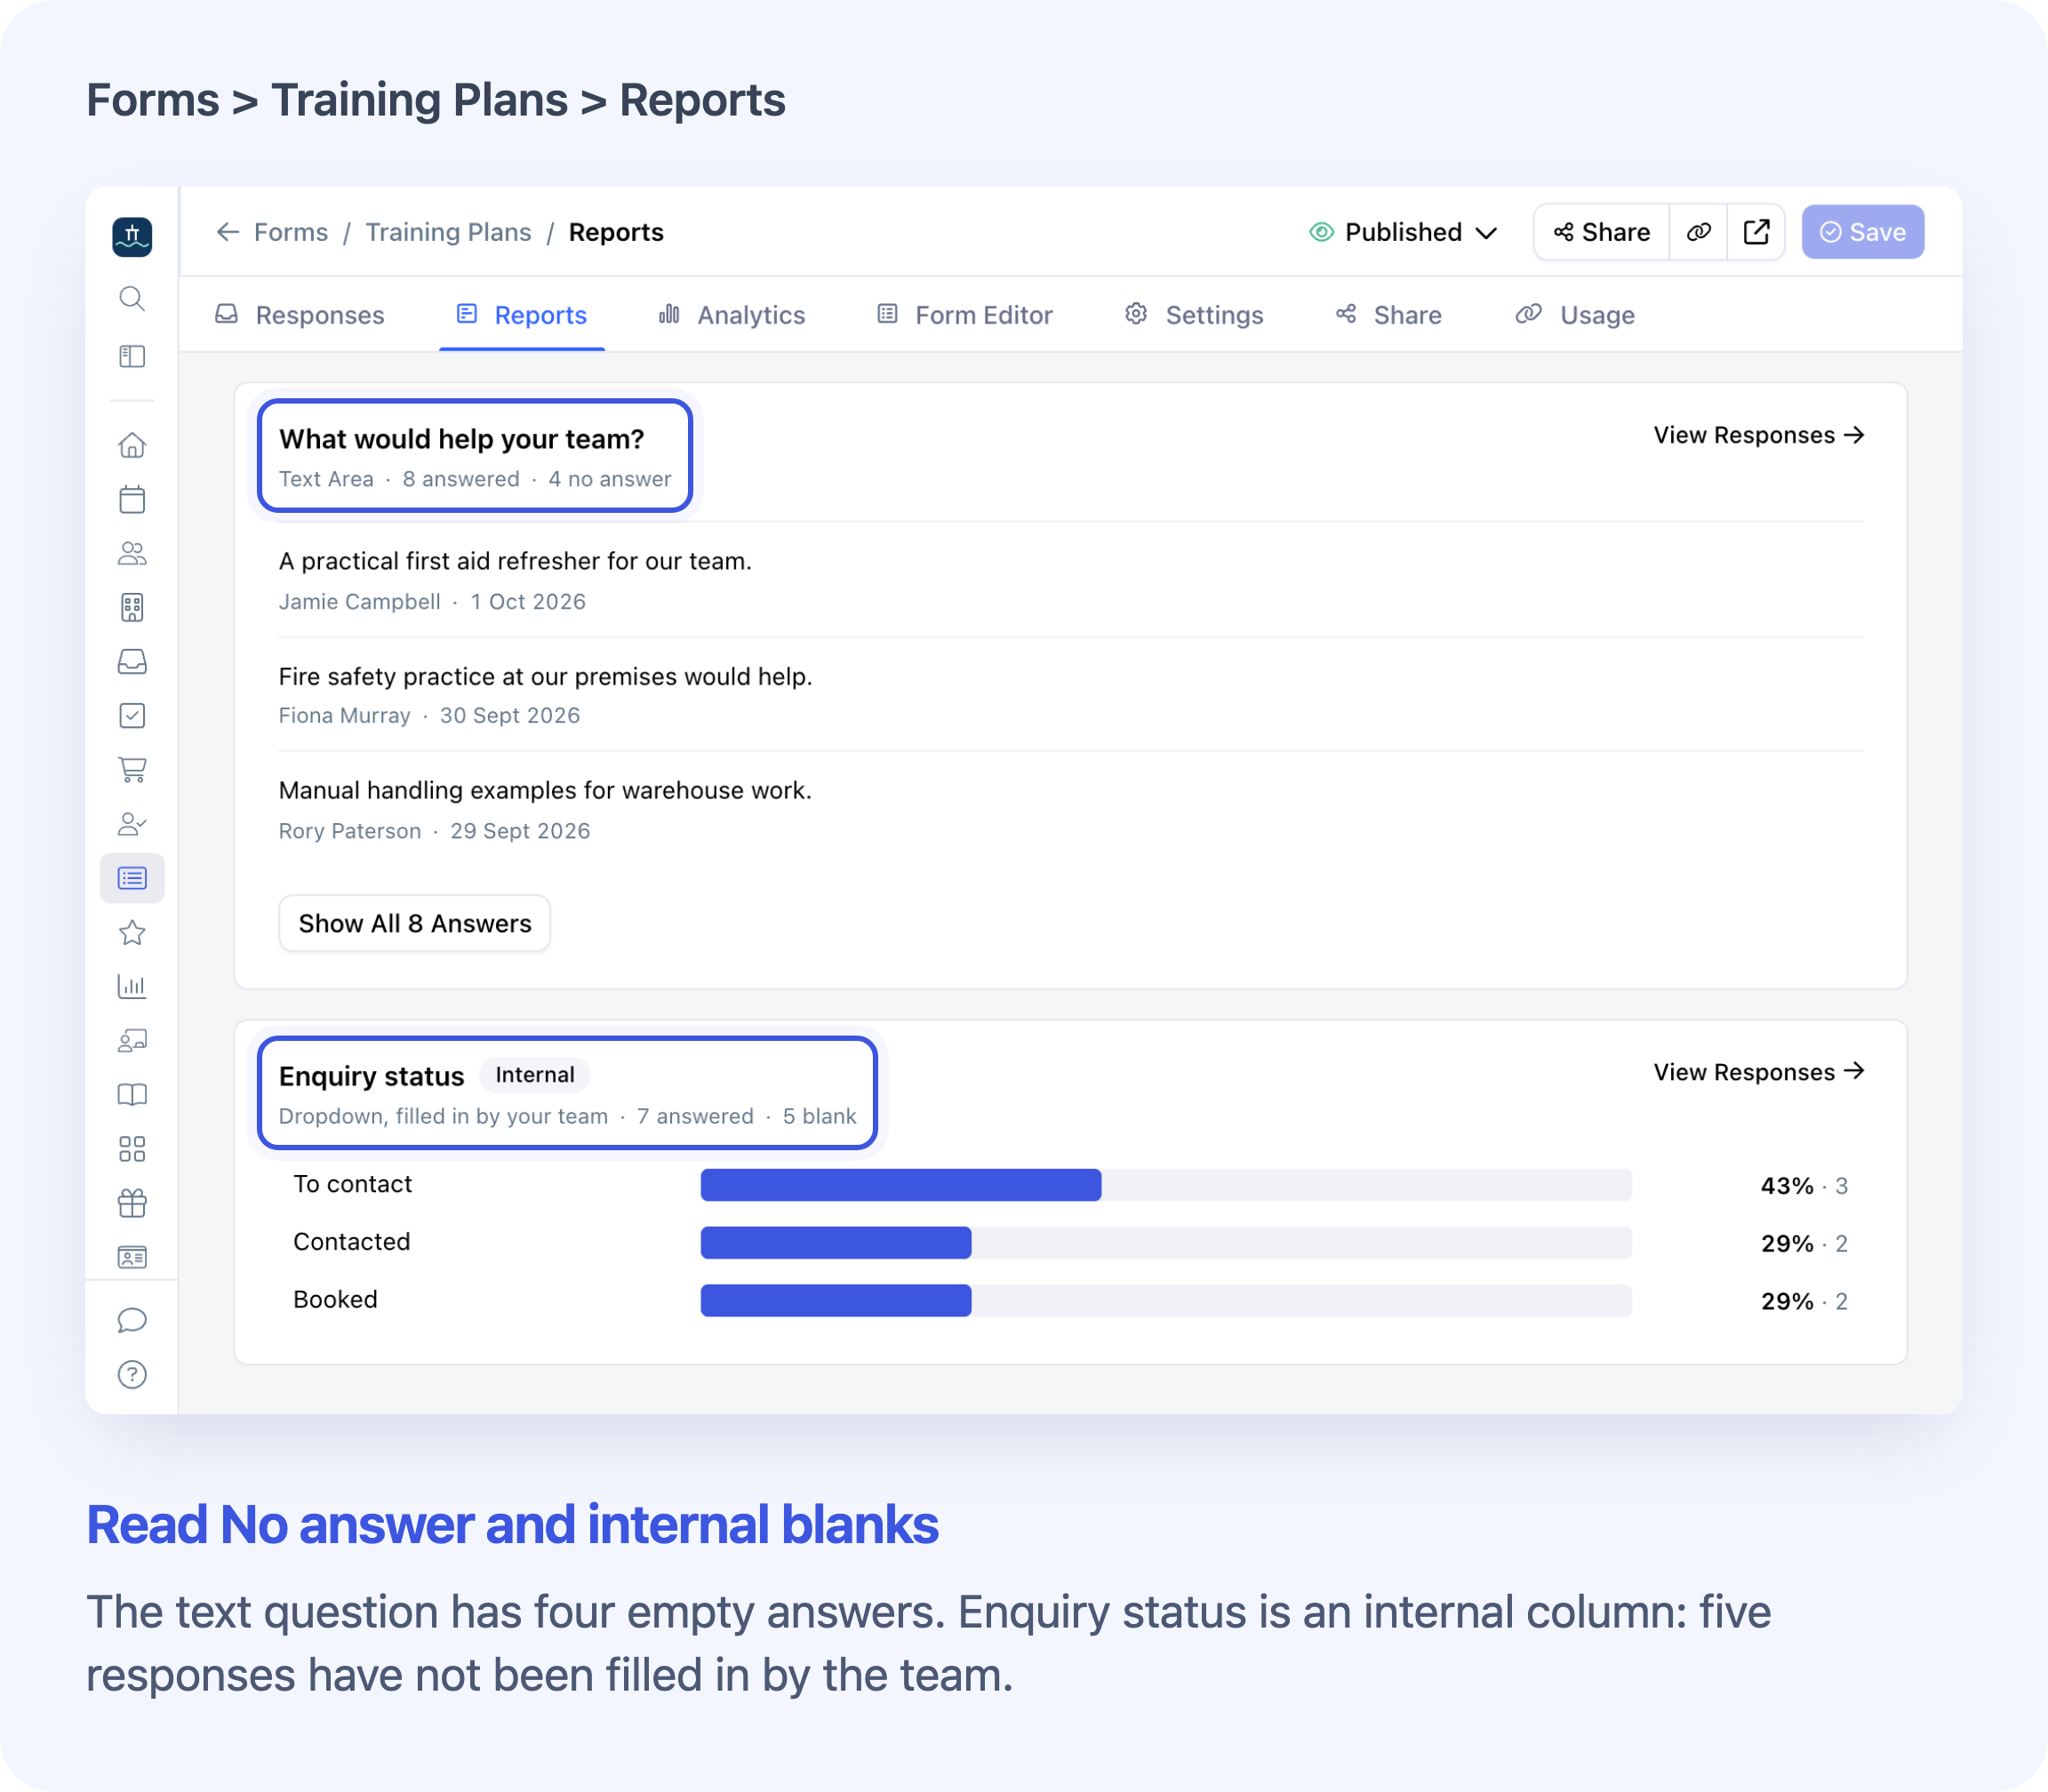
The summary fits the question:
- Choices and dropdowns: counts and percentages for each option, including current options with no answers. Checkbox questions show each selection, and True/False questions show the Yes/No split.
- Star ratings and scales: an average and the distribution of answers.
- Numbers: average, median (the middle value), lowest and highest values, plus columns grouping answers into number ranges.
- Internal questions: supported columns filled in by your team have summaries marked Internal. These columns are not shown on the public form, but their summaries and answers can appear in PDF and CSV exports.
Each question has its own answered count. Percentages use the responses that answered that question, rather than the form’s total submissions. For example, 6 selections out of 10 answers gives 60%, even if the form has 12 submissions. Percentages are rounded, so they may not add up to exactly 100%.
View Recommendation Scores for 0–10 Scale Questions
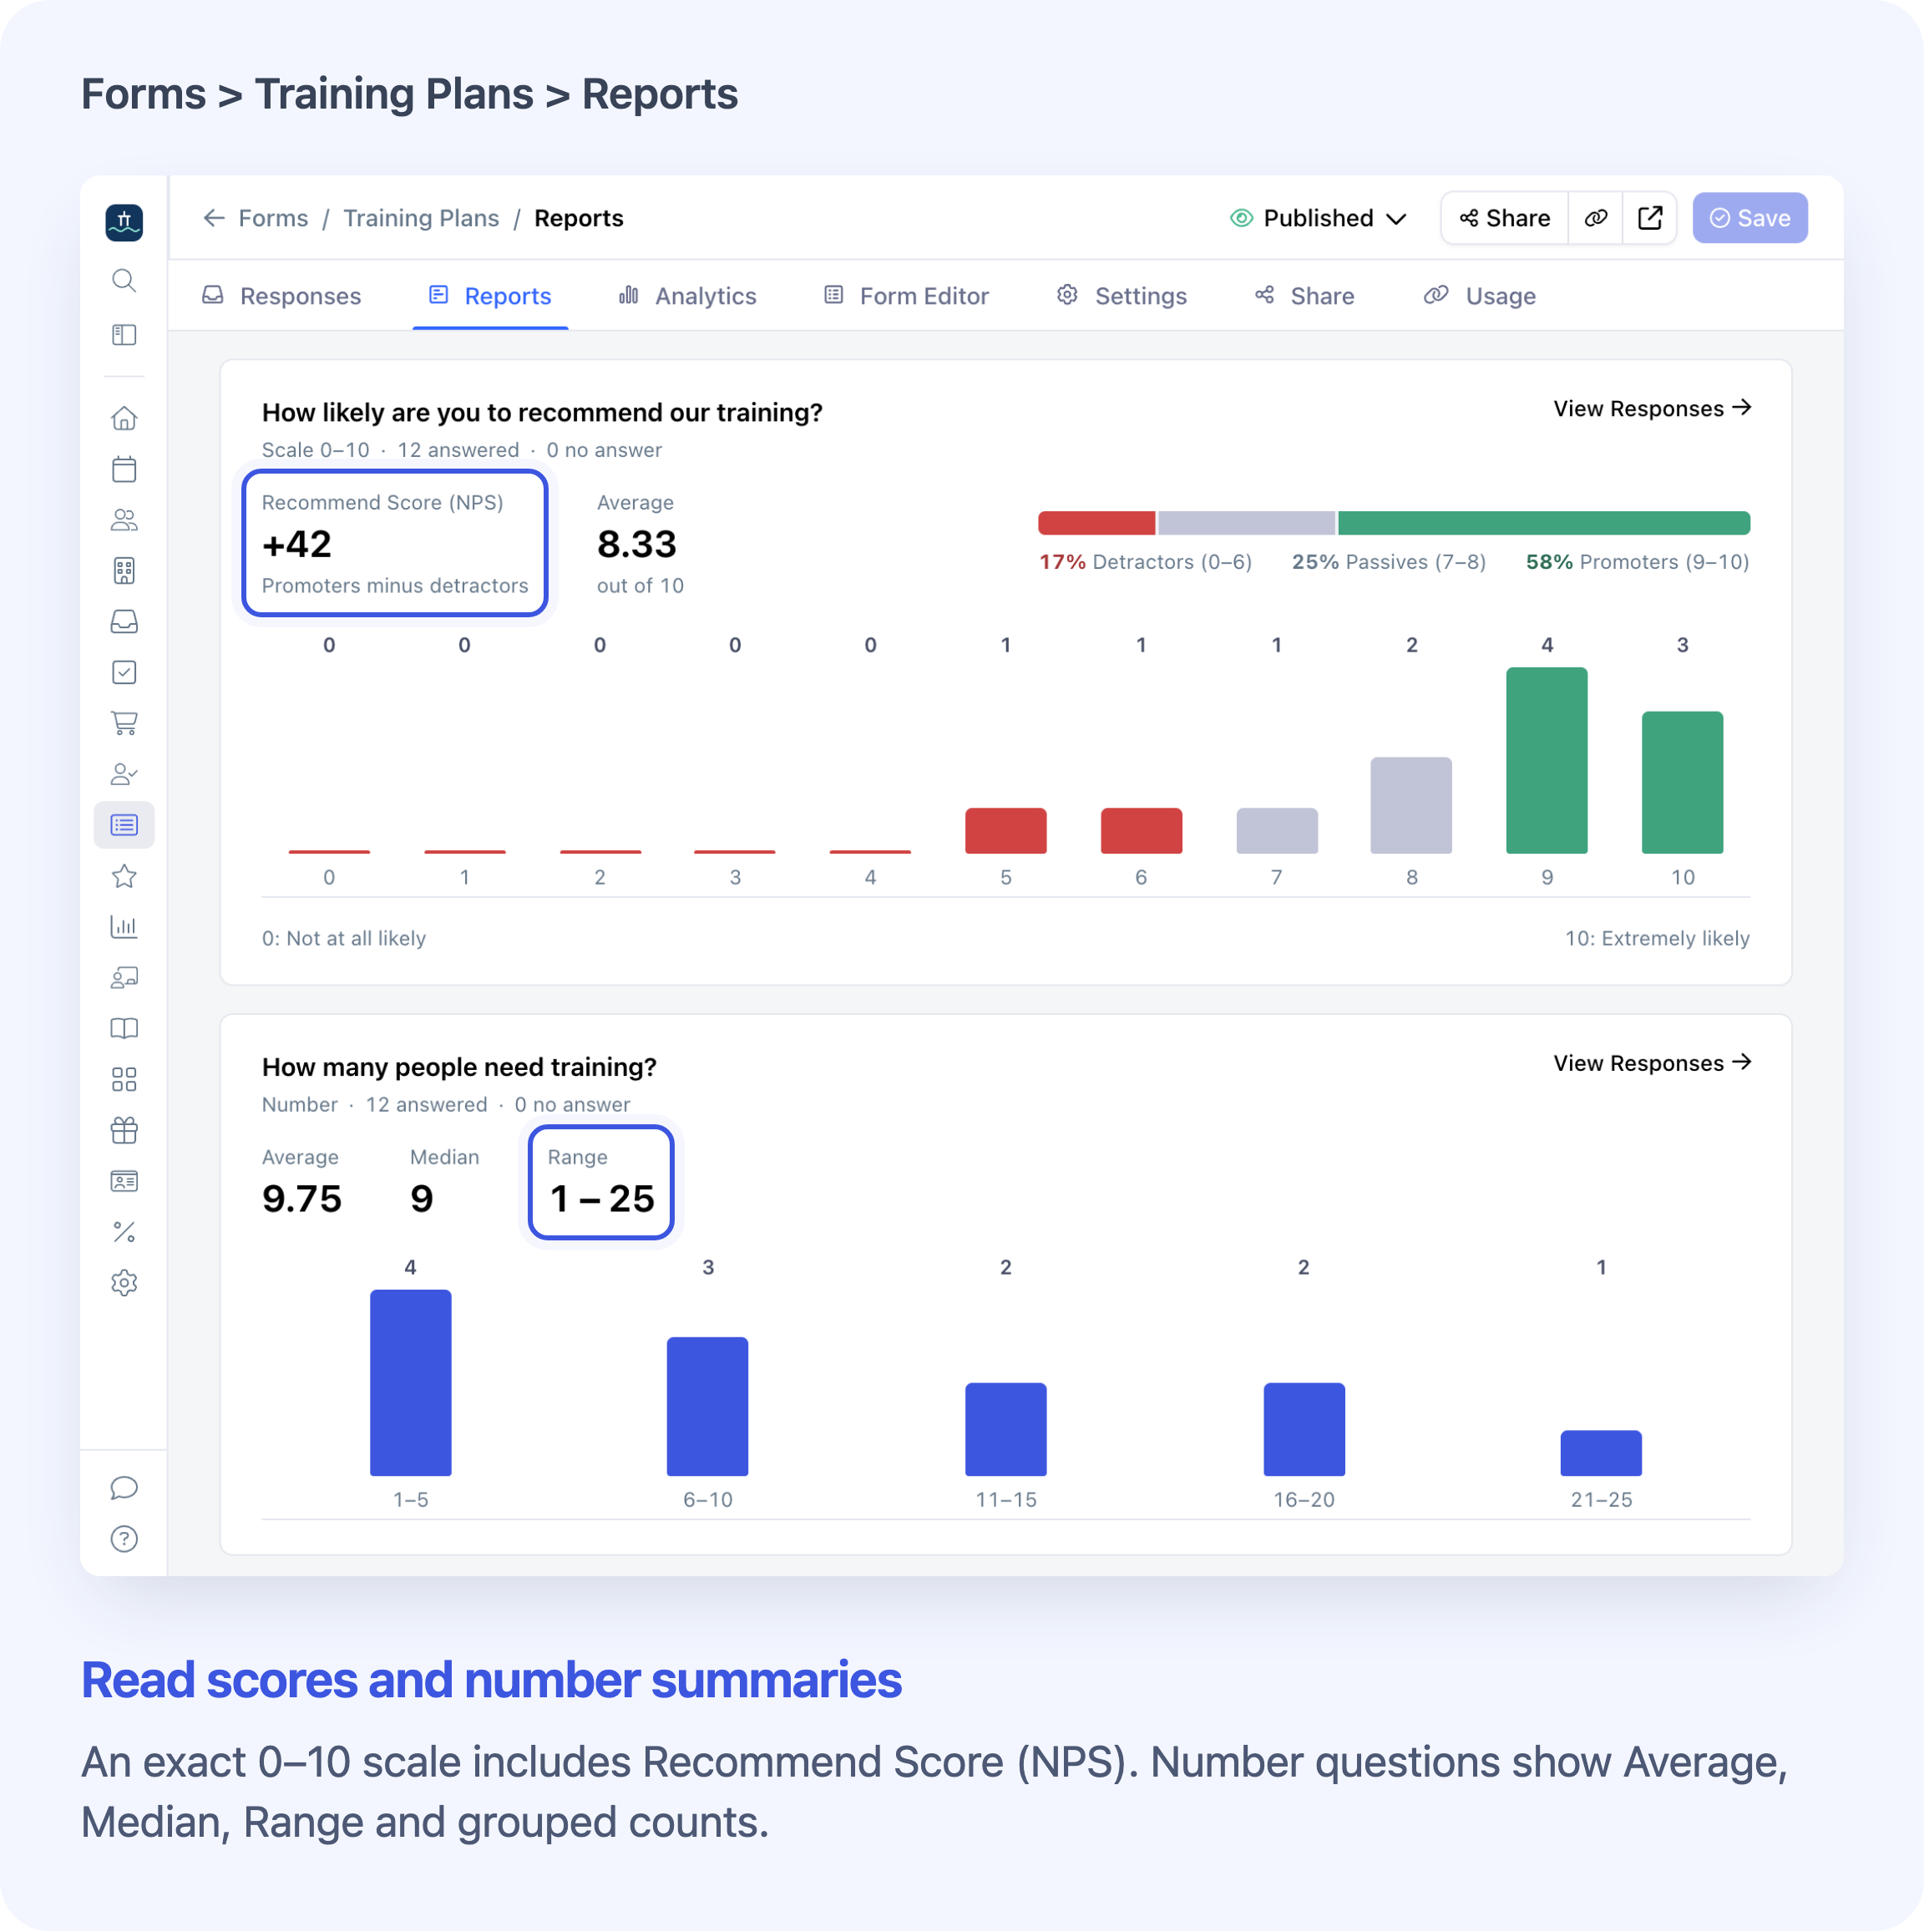
An exact 0–10 scale with valid answers automatically shows Recommend Score (NPS). The score is the percentage of promoters (9–10) minus detractors (0–6), ranging from -100 to +100. Answers of 7–8 are passives: they count towards the total but are neither added nor subtracted.
Cademy calculates this for every 0–10 scale with valid answers, so interpret it as a recommendation score only when the question actually asks about recommending something. Other scale ranges show their average and distribution without NPS.
Filter Charts by Answer and Compare Response Groups
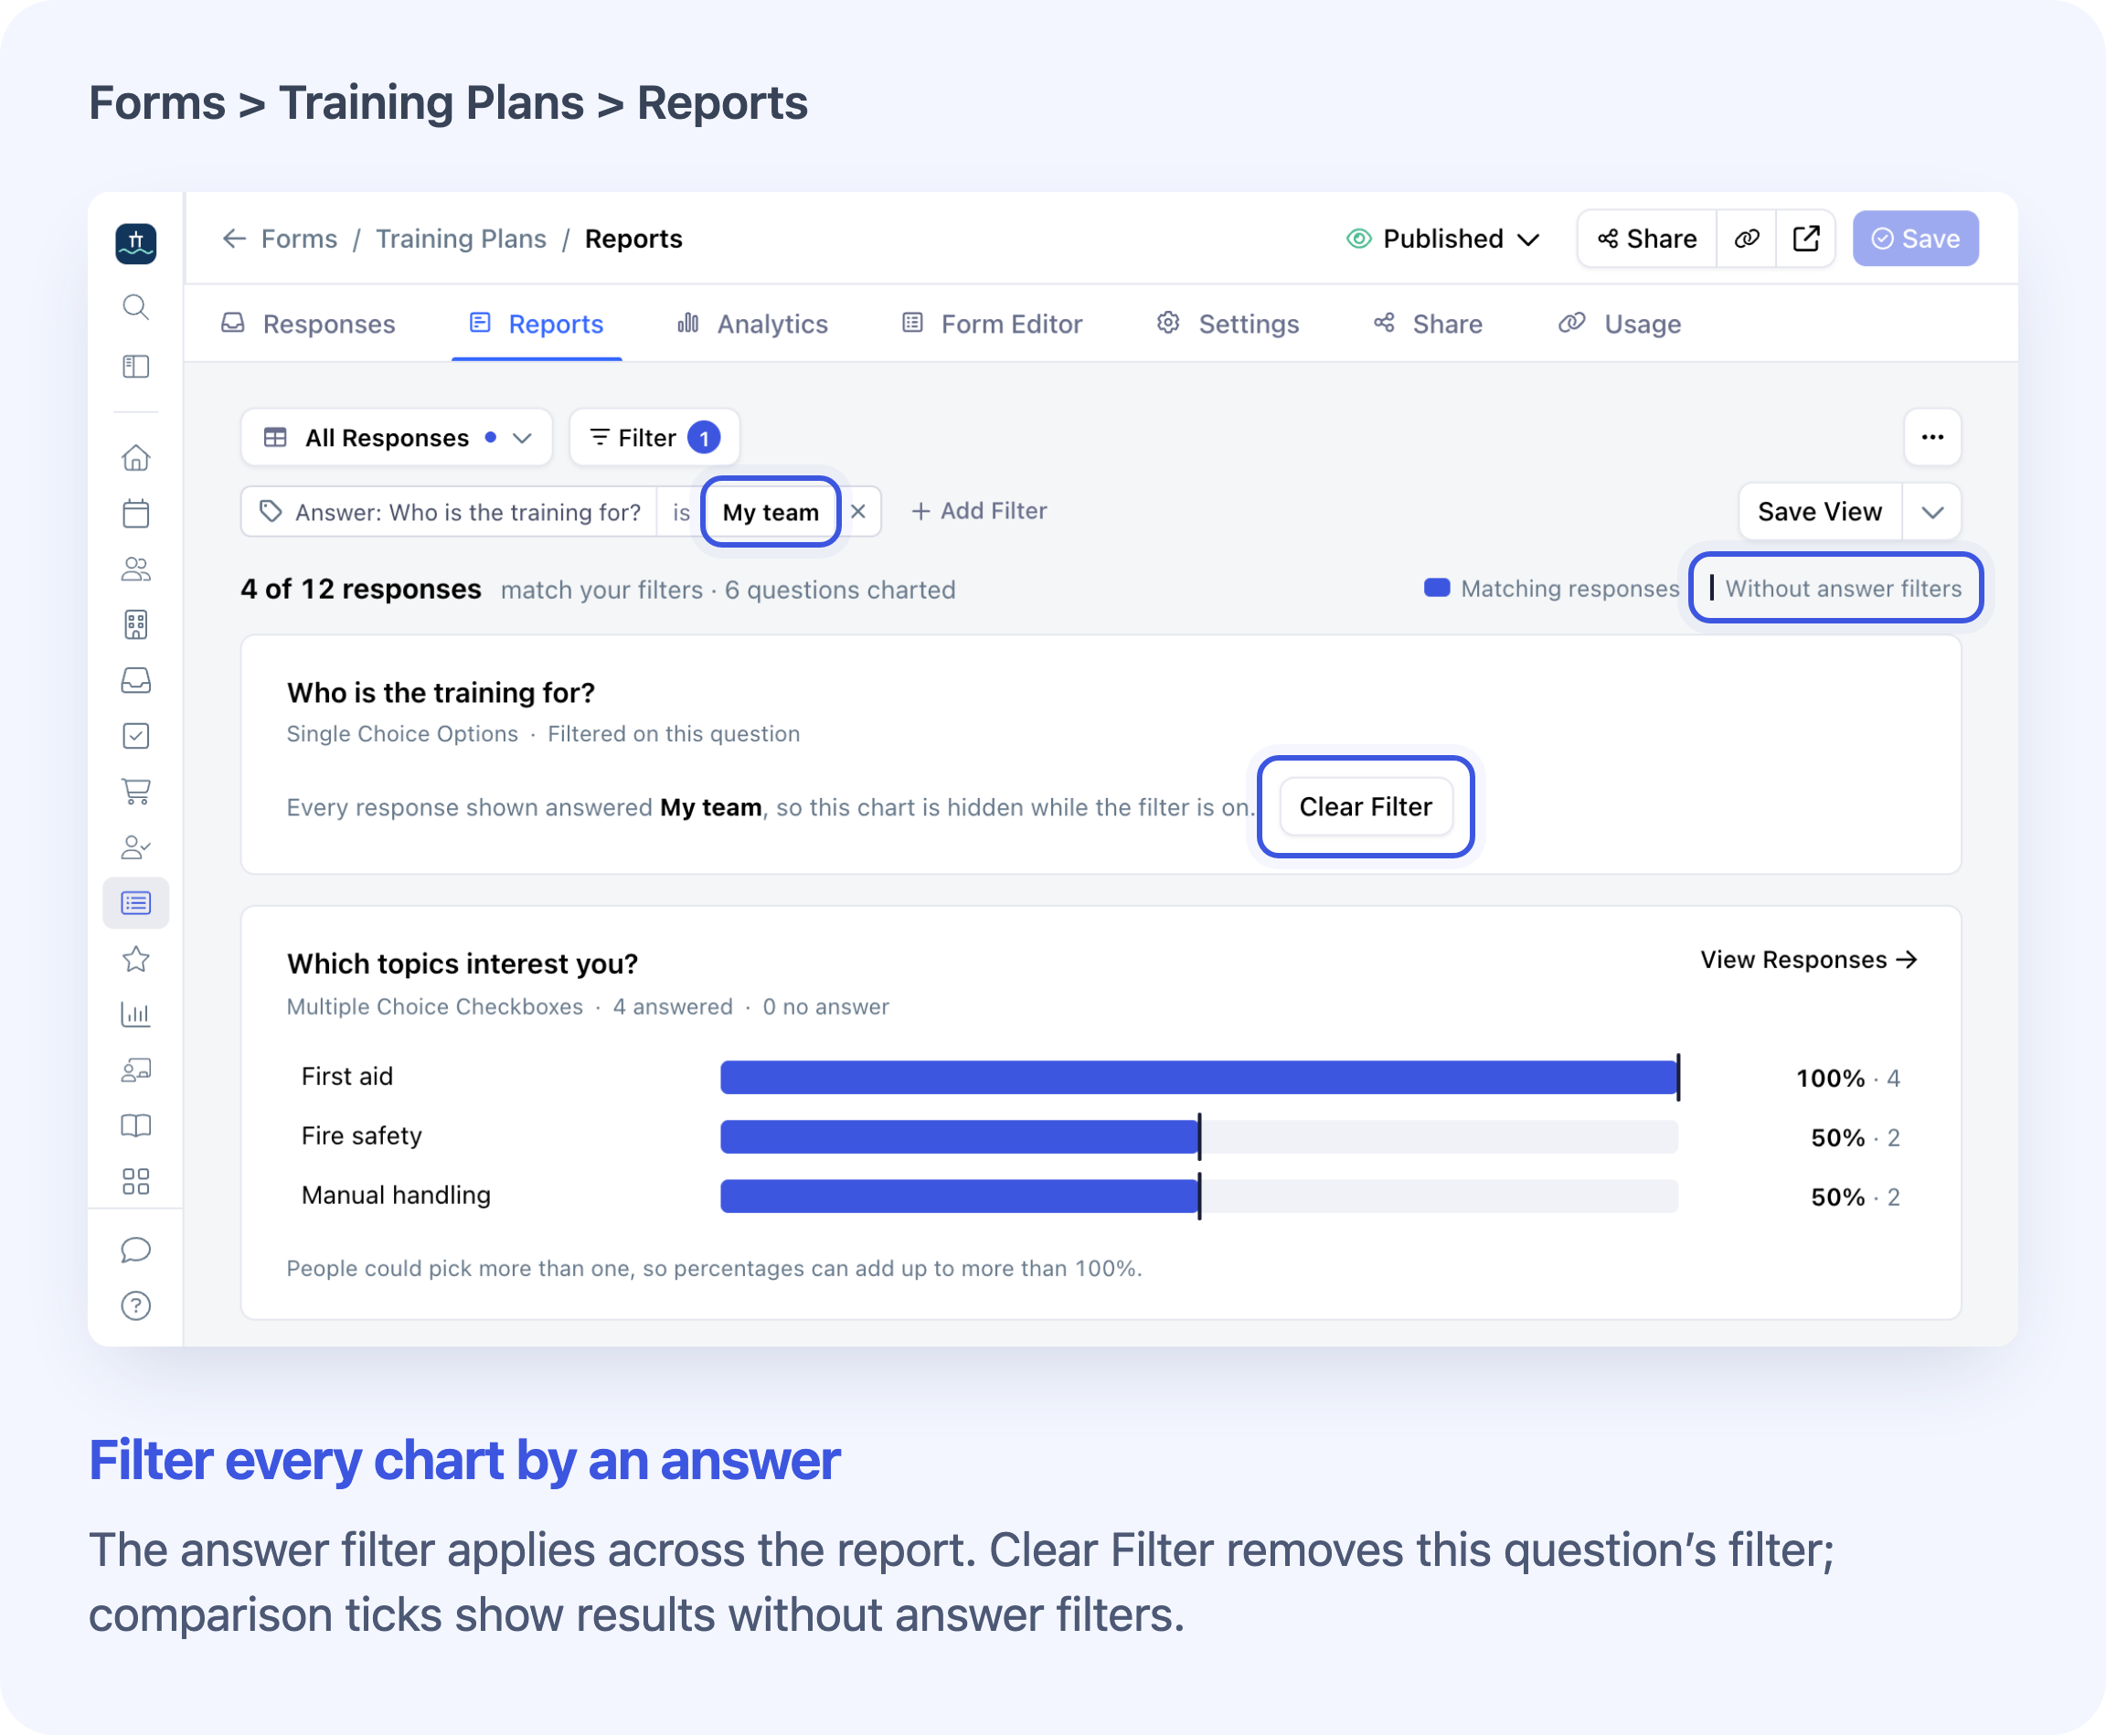
Select a choice bar, a rating or scale column, or a Yes/No answer to filter the report. For example, select My team on “Who is the training for?” to see which training topics that group chose. The response total and other question summaries update together. Filters change which responses you see, not the saved answers.
Use Filter to choose a submission date, source or supported question answer. You can include several answers with is any of, exclude answers, or find responses with or without an answer. Text, number, website and date answers do not offer these answer filters.
Selecting answers on different questions combines them with AND: a response must match both. A single selected answer can hide that question’s chart and show Filtered on this question. Use Clear Filter to restore it, or edit the filter chip to change or add answers.
With answer rules combined using AND, comparison marks show the results Without answer filters. Other conditions, such as the submission date or course, remain in place. This lets you compare your selected group with the wider group you chose. Comparisons are not shown when an answer rule is inside an OR group, where a response can match either condition.
Save Form Filters and Open Matching Responses
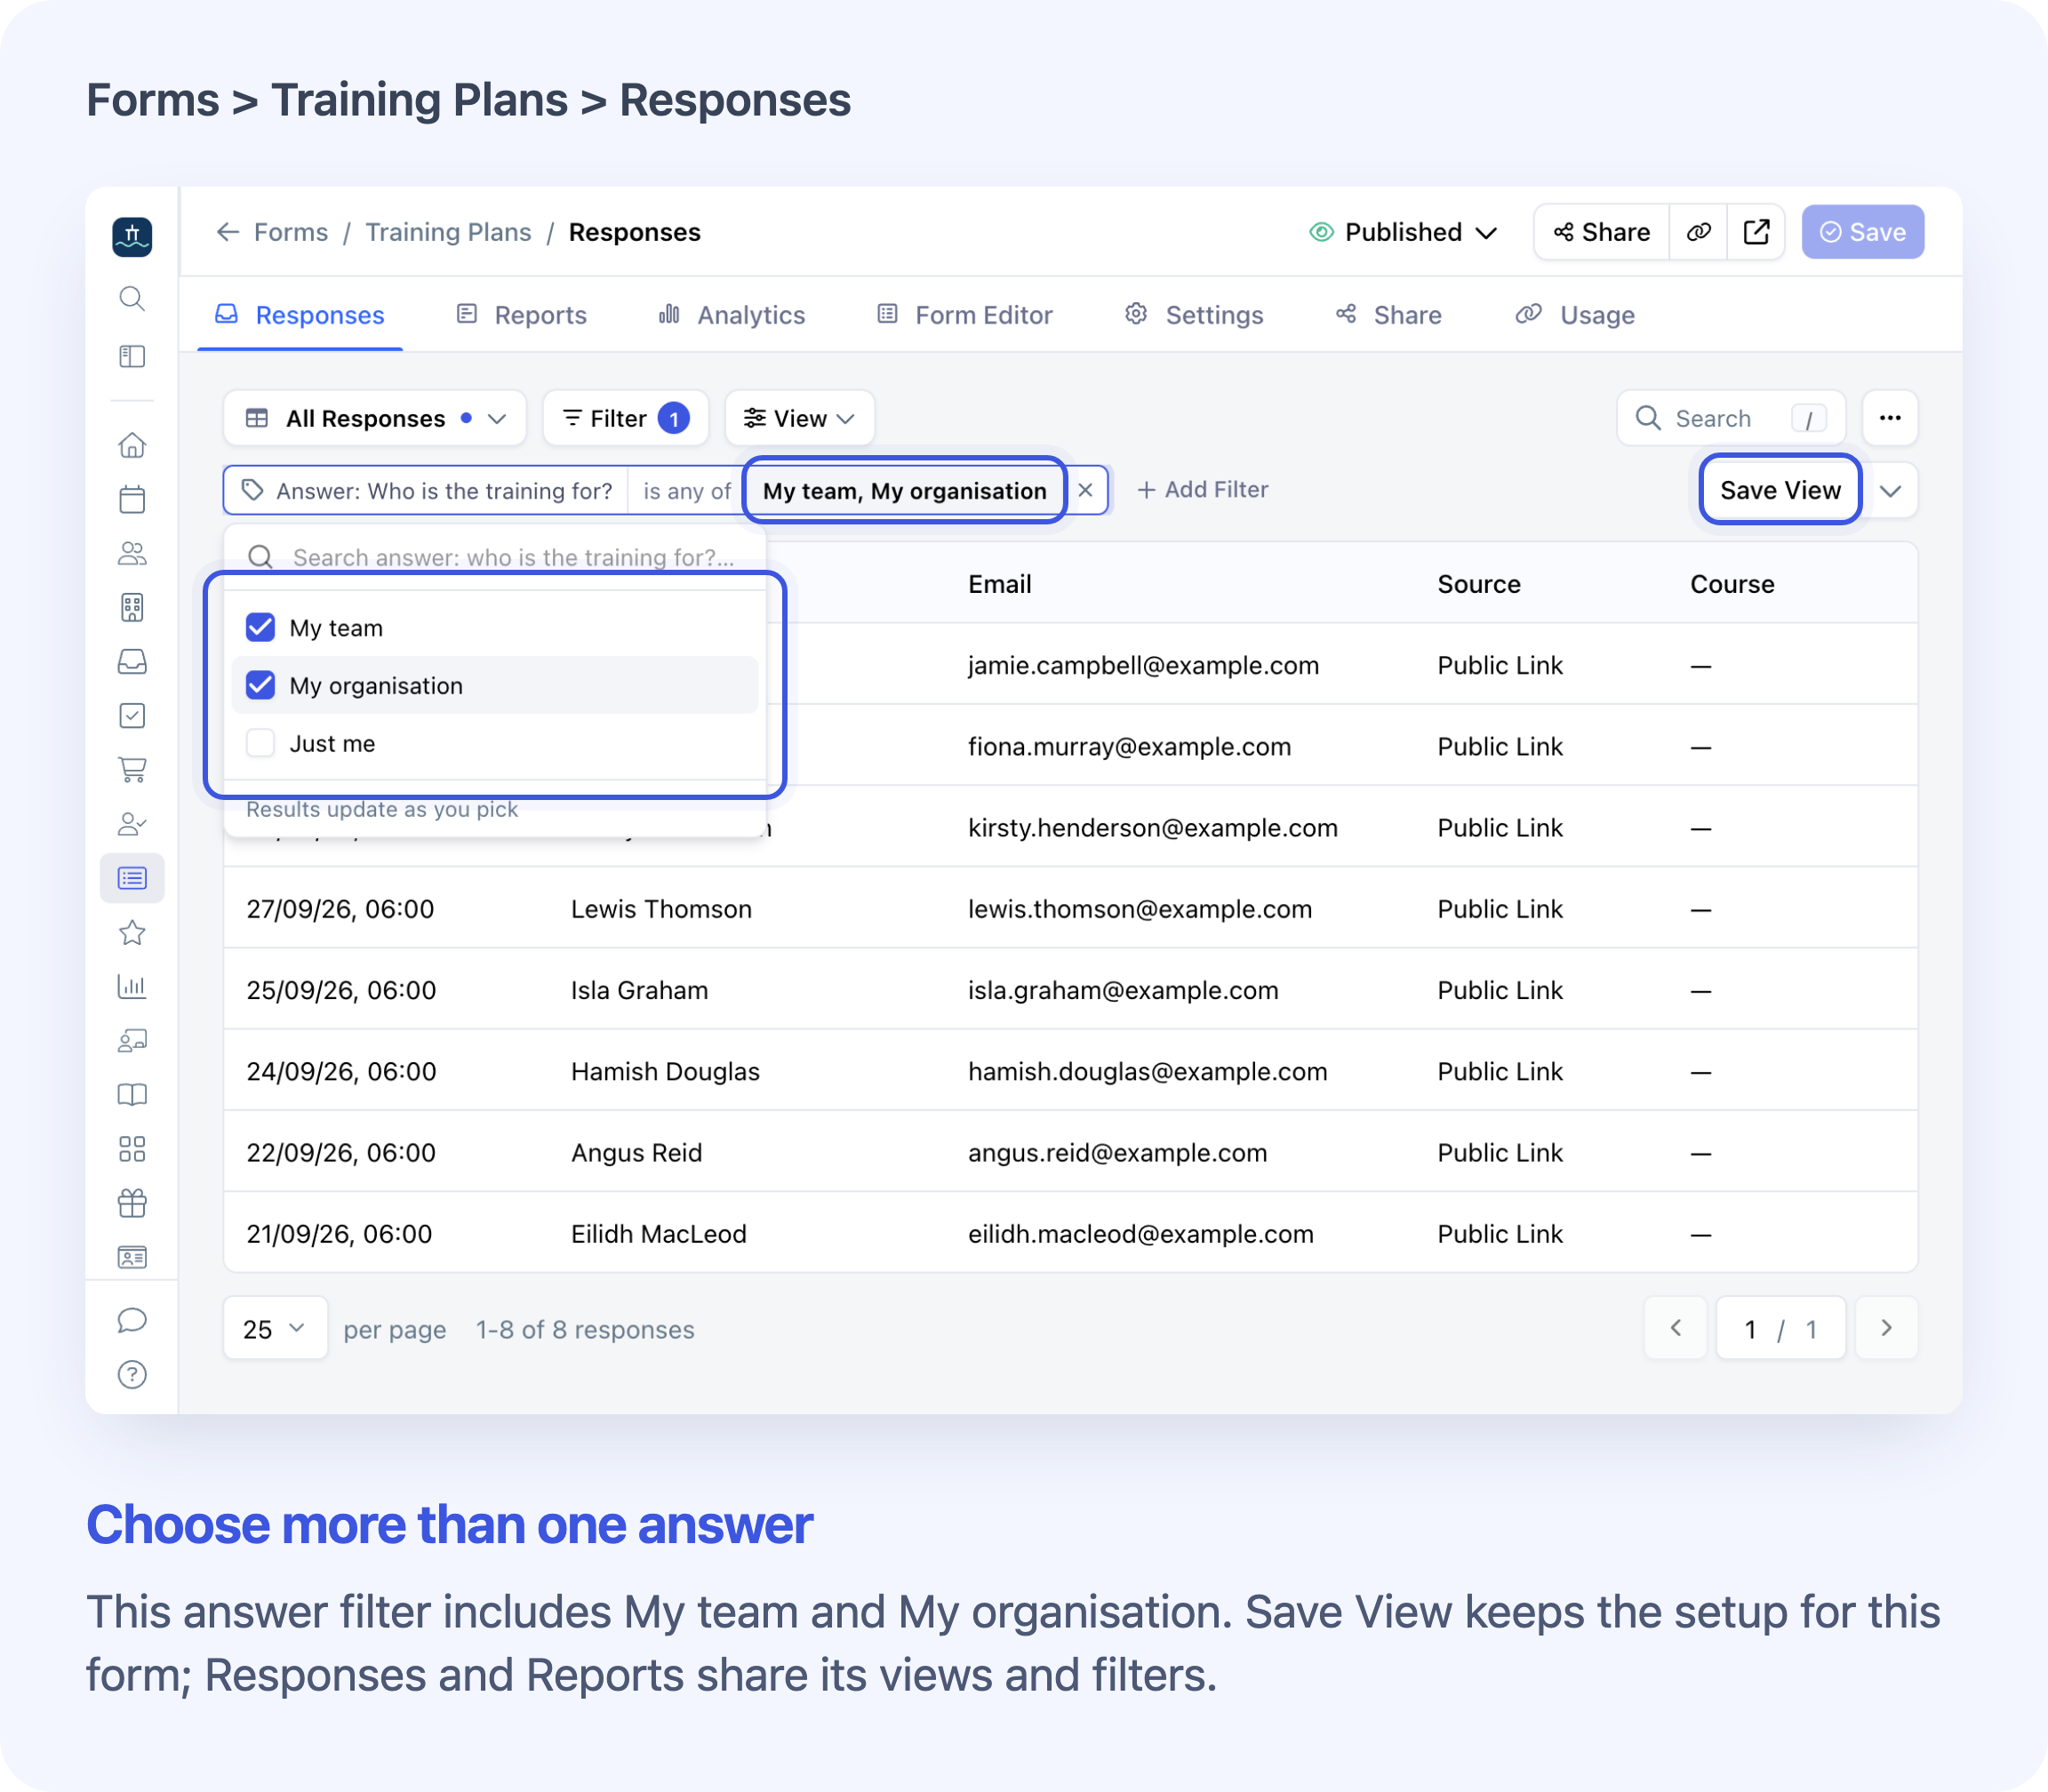
Responses and Reports share filters and saved views for the same form. Save your chosen filters as a view you can select again, so you can return to a group without rebuilding the conditions. The view also works on the other tab of this form.
Use View Responses on a visible question card to open the matching individual submissions with your applied filters. It does not add a filter for that card. Use Responses to arrange table columns and sorting. See Filter, Sort and Save Views.
Filter Course Feedback and Imported Reviews
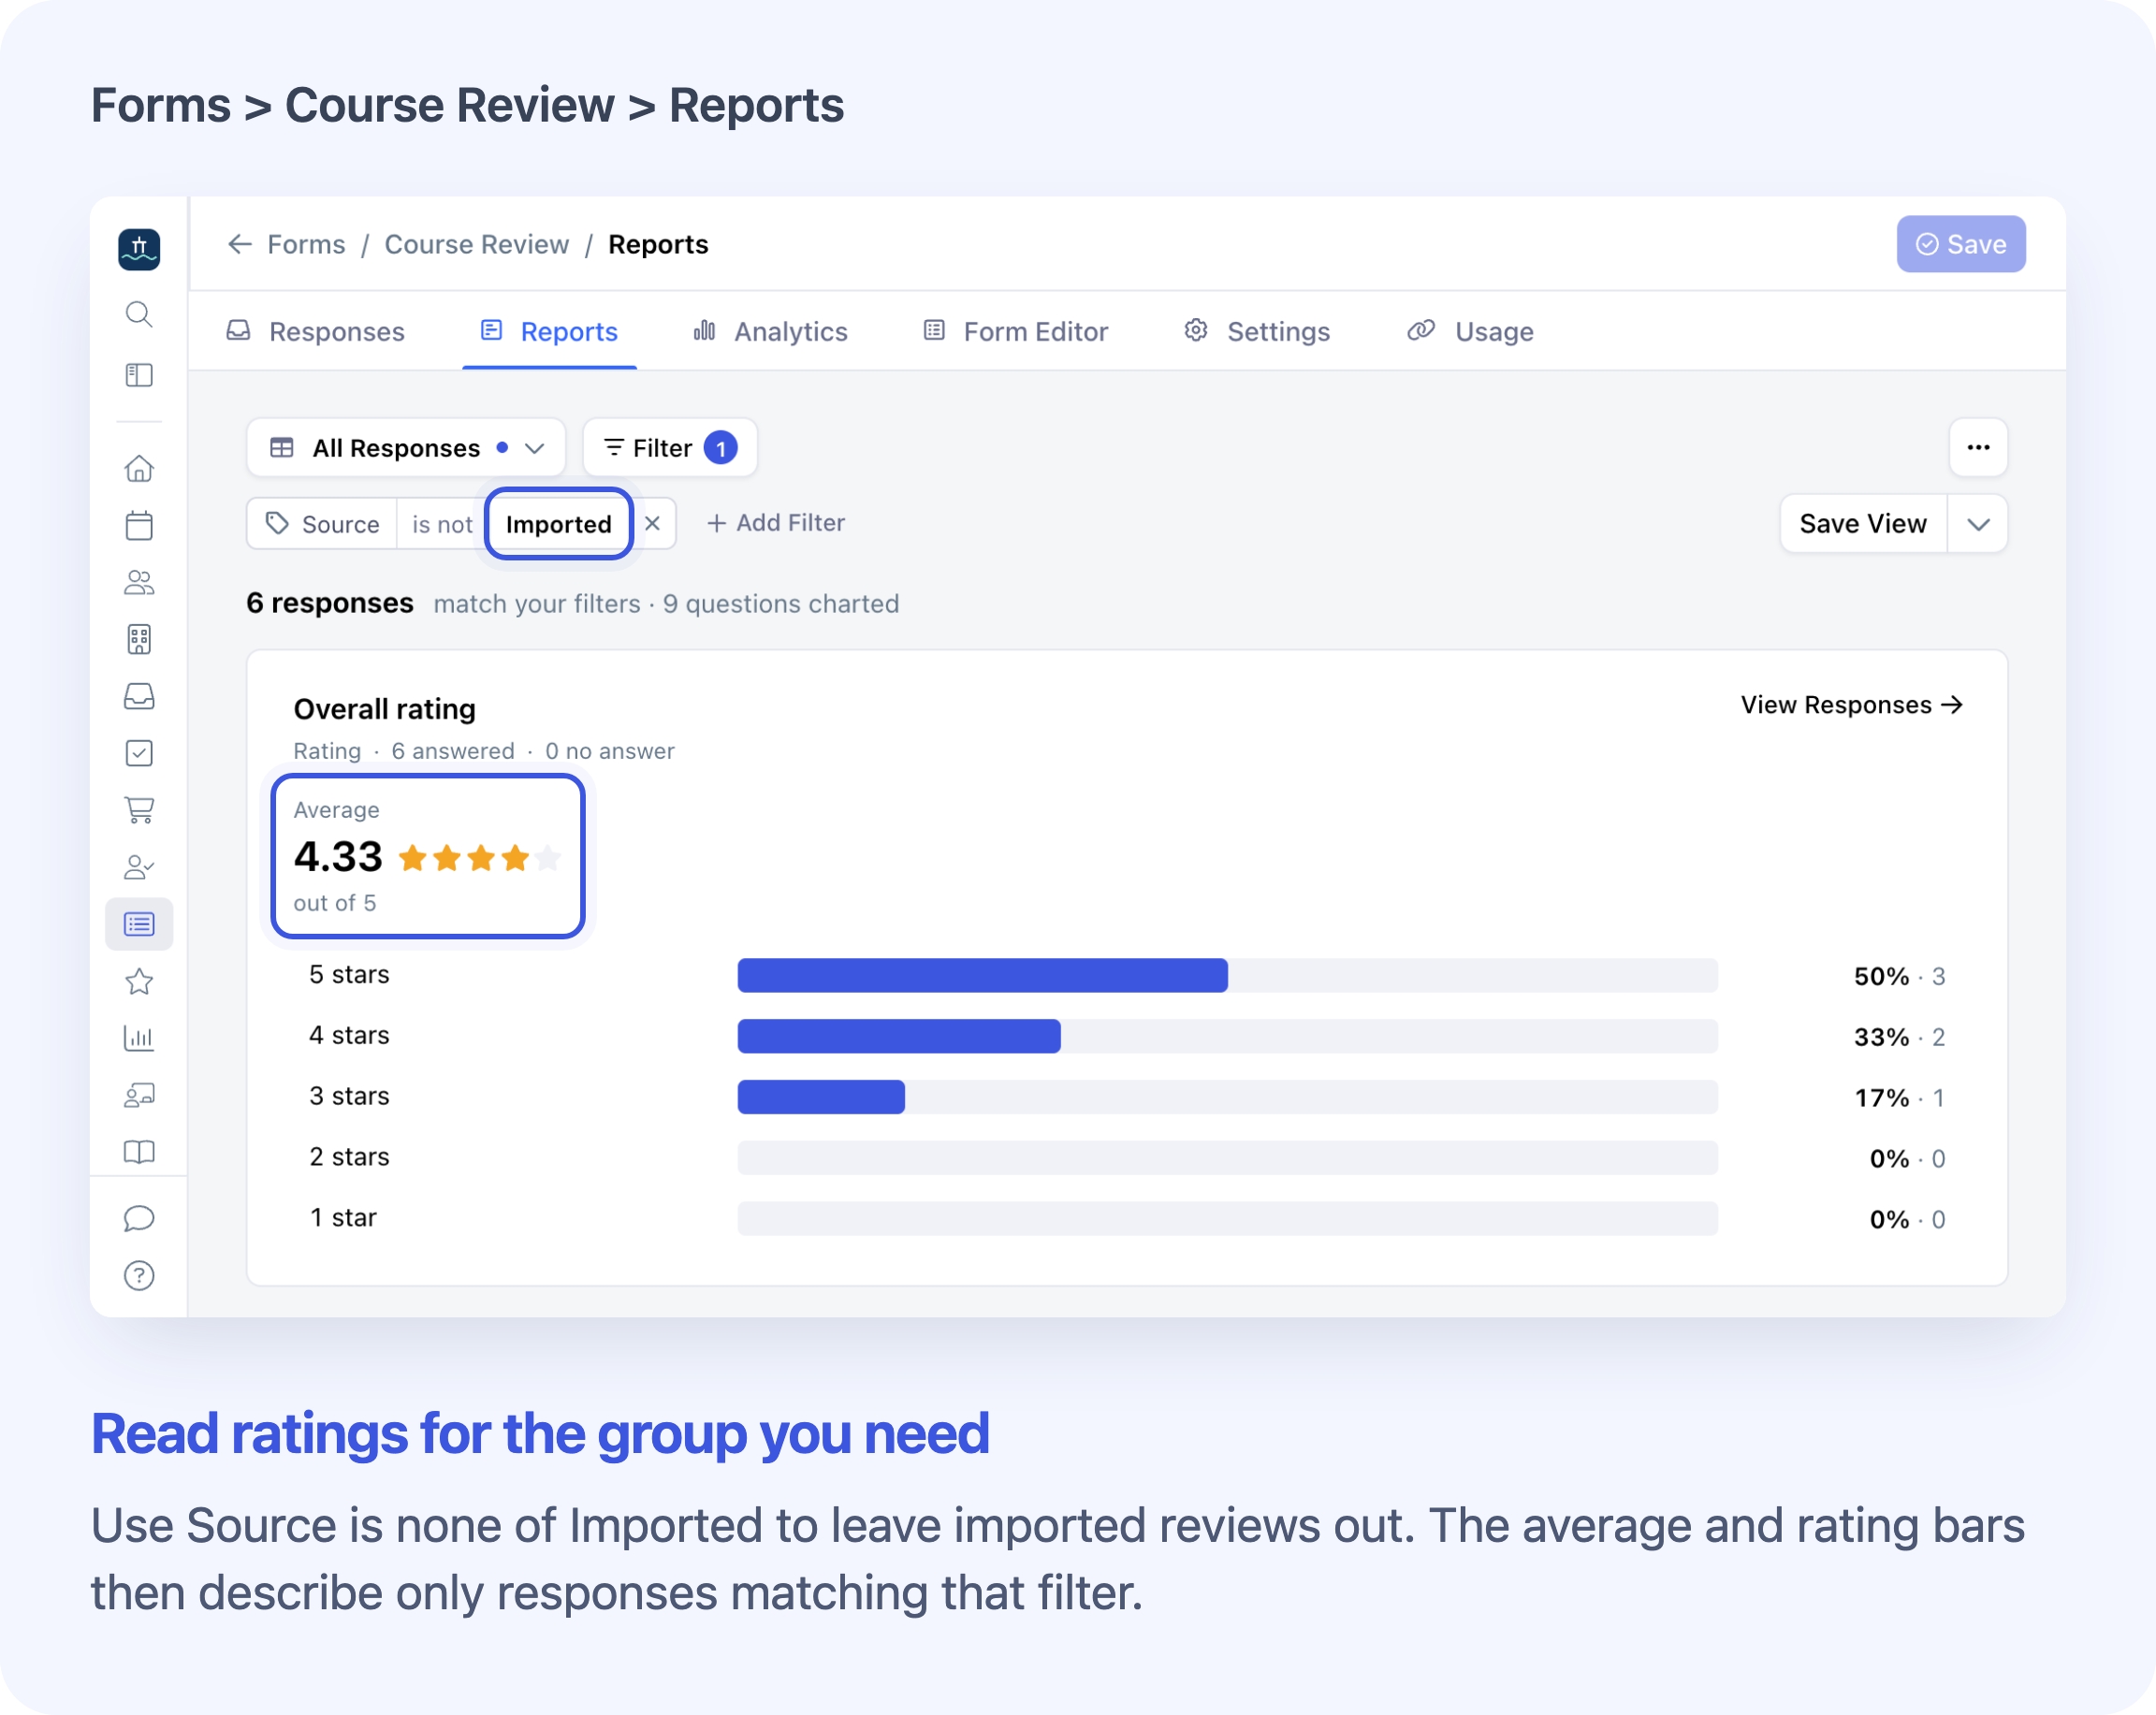
Feedback reports can be filtered by Course, Course Date, Facilitator, Rating, Review Status and Has Review. Use these to review one course or delivery group within the selected form. Course Date refers to when the course starts; Submitted refers to when the response arrived.
Responses imported from reviews are included by default, and the report identifies their count. Use Source is none of Imported to leave them out. Imported reviews can contain a rating or review text without answers to the form’s other questions.
Read and Search Written Answers
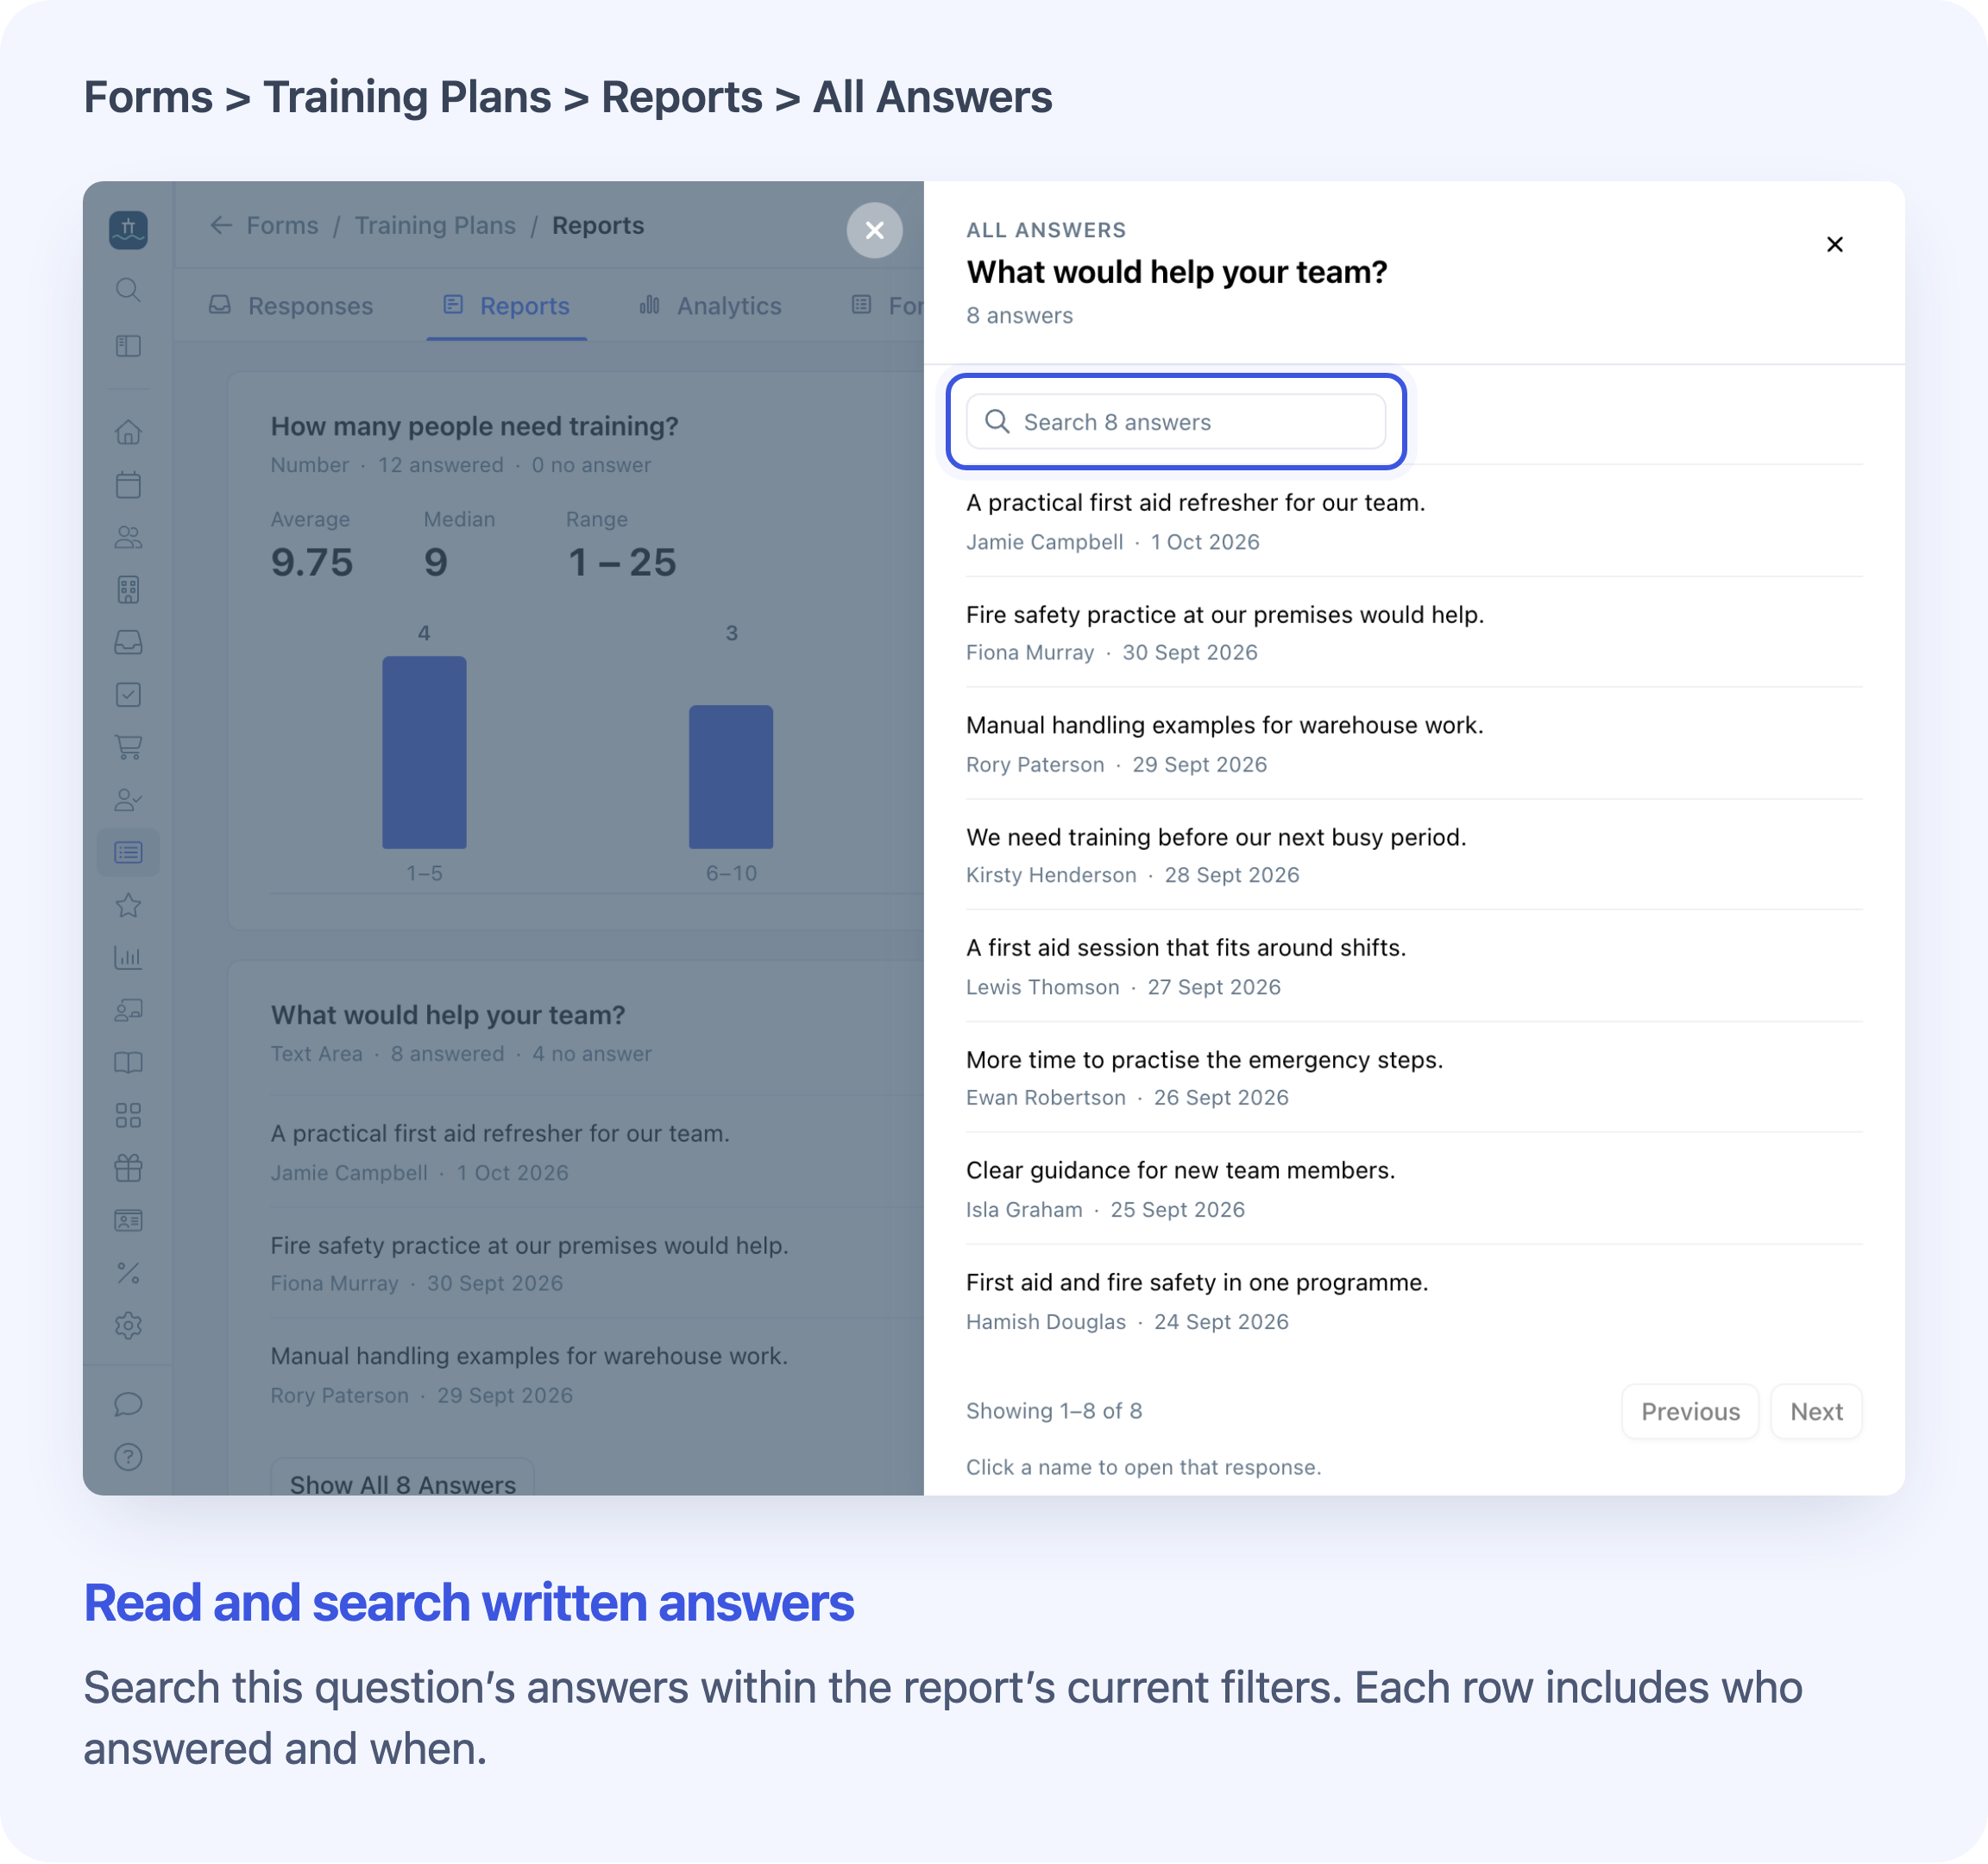
Text, long-text, website, date and date-and-time questions preview their three newest answers. When answers are available, select Show All [number] Answers to open the full list for that question, newest first, with search and pagination. Select a respondent’s name to open their full response.
The list respects your report filters. Searching inside this panel narrows its answer list only; it does not change the charts or CSV export. The name/email Search on Responses is also separate and does not narrow Reports.
Save Report Charts as PDF or Export Responses as CSV
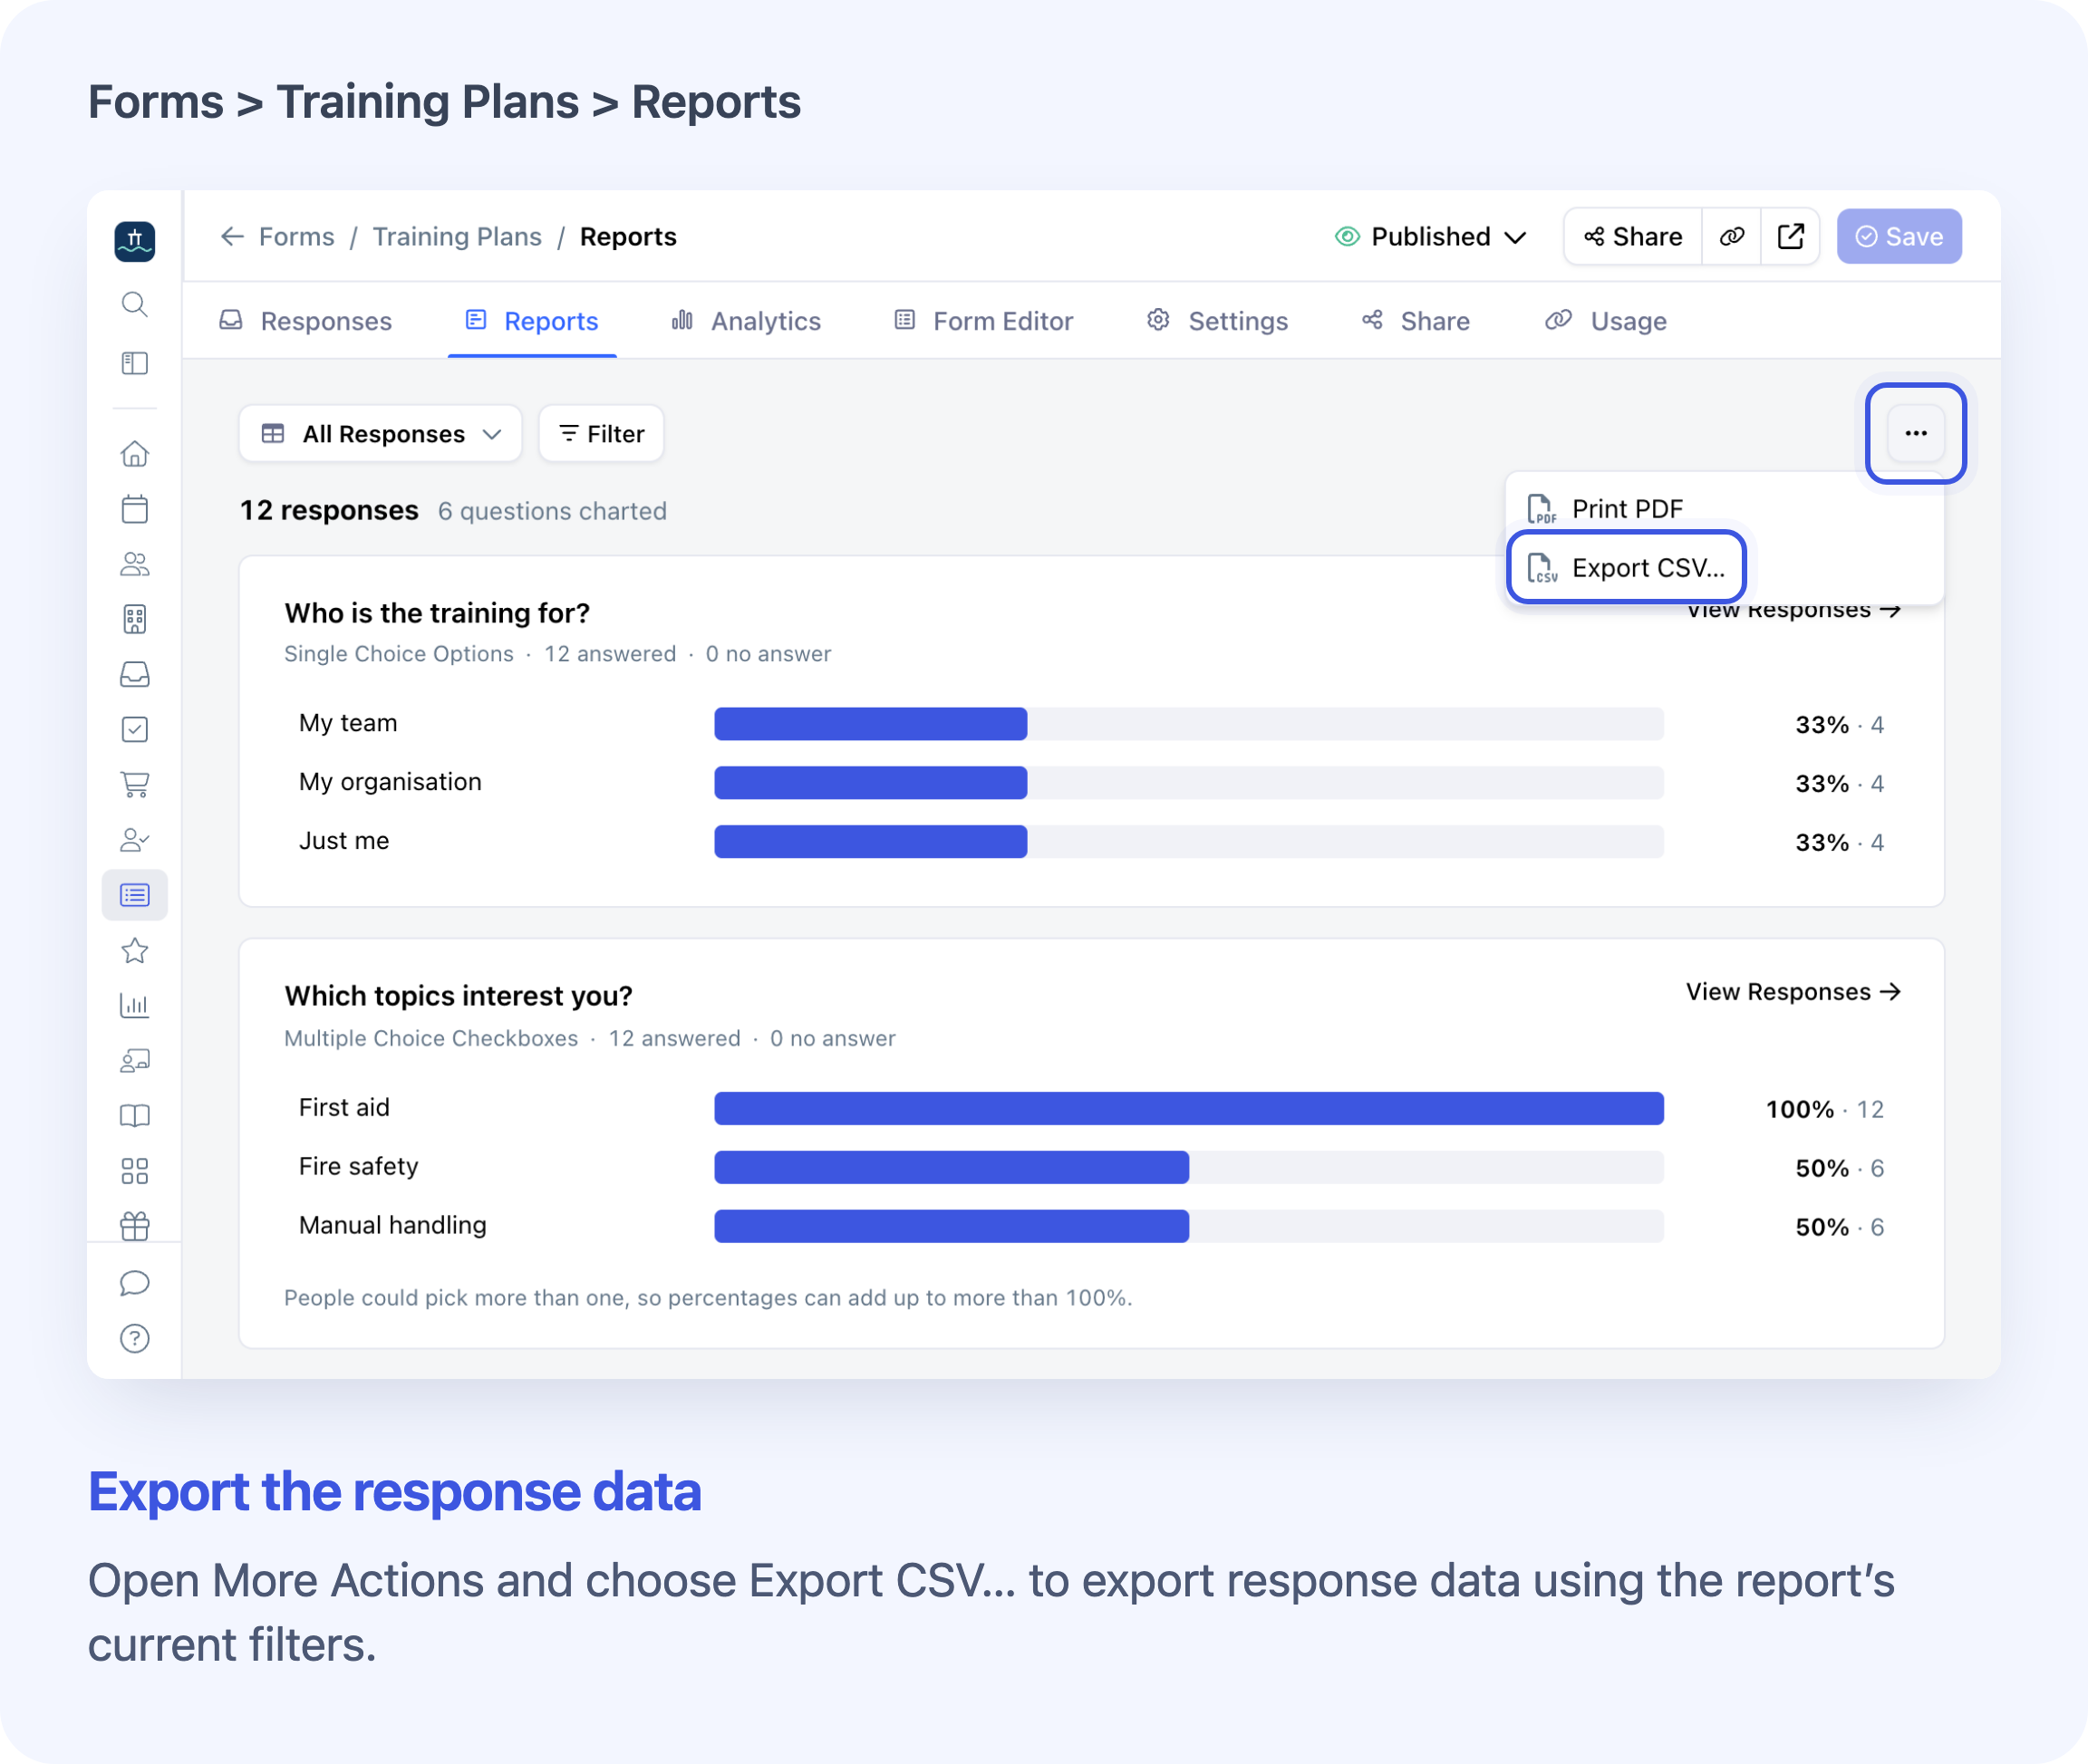
The report’s three-dot menu gives you two different outputs:
- Print PDF opens your browser’s print dialog. Choose a PDF destination to save the charts with the form name and applied filters. Text cards include their short preview, rather than every written answer.
- Export CSV… exports the responses matching your report filters, across all matching records. It contains answer data, not chart pictures or percentages. When it is ready, choose Download CSV.
A Reports CSV includes all available supported export columns, including internal fields and supported historical answers to removed public questions. File uploads and Statement fields are excluded; addresses are split into separate columns. To export selected columns, use Responses → View → Columns and export from Responses instead. Neither export uses name/email Search or stops at the current table page, and form exports cannot be scheduled to repeat. Check the file’s contents before sharing it.
For the full procedures and examples, see View and Export Form Reports.
Frequently Asked Questions
Why Can’t I See Reports?
Your team role must be Course Owner or System Admin. Reports appears on General and Feedback forms, after Responses. Reports and question-answer filters are included on every Cademy plan. Existing Responses and Analytics remain available.
Do I Need to Collect New Responses?
No. Reports uses stored answers, including submissions from forms used in online lessons. It does not add questions, change the public form or send messages. One response means one submission, so the total is not necessarily a count of unique people.
Why Don’t My Question Counts Add Up to the Response Total?
A public question counts saved answers and saved blanks. A blank can include a question hidden by a condition. Older submissions and imported reviews may have no entry for that question, so they appear in neither count. Internal blanks include every matching response without an internal value.
Why Do Checkbox Percentages Add Up to More Than 100%?
One response can select several options. Each percentage uses the number of responses that answered the question, so the same response can contribute to several bars.
Does “has no answer” Find Only People Who Skipped a Question?
No. It also finds responses with no saved entry for the question. Conditionally hidden questions can also be blank. Its matching total can therefore be larger than the public question card’s no-answer count.
Why Does “is none of” Include Responses With No Answer?
A blank response has not selected the excluded value, so it can match this filter. Add has an answer with AND if you want to exclude blanks as well.
Why Did My Chart Disappear After I Selected an Answer?
With AND answer filters, a single selected answer can replace that question’s chart with Filtered on this question. Select Clear Filter to restore it, or edit the filter chip to change or add values. Checkbox charts remain visible.
What Happens If I Rename or Remove a Choice Option?
Earlier answers stay under their old wording, marked No longer an option. They are not combined with a replacement option. Current options with no answers remain at zero.
Can I Reuse an Existing Question for a Different Topic?
Reports uses the question’s current label for its stored answers. Add a new question if its meaning changes, so earlier answers are not presented as answers to a different question.
What Happens If I Remove a Public Question?
Its card disappears from Reports, but saved answers remain in individual responses and supported Reports CSV columns. The Responses column picker does not offer the removed question, so its usual visible-column export leaves it out.
Does Deleting an Internal Column Keep Its Answers?
No. Delete Column… permanently removes that internal column’s saved values. A CSV cannot recover them afterwards. Hiding a column from the table is different: it does not delete its answers.
Why Does a Saved View Show More Responses After I Change the Form?
An answer rule is ignored if its question is removed, its linked field is deleted or its type no longer supports filtering. Other rules remain. Check the resulting records and update the saved view with valid current filters before relying on its totals.
Why Are Some Fields Missing From Reports?
Names, email addresses, telephone numbers, addresses, files, statements and fields linking to a person, organisation or tag do not have report cards. Questions removed from the current form also have no card. Open View and Manage Form Responses to read stored submissions.
Can I Combine Different Forms Into One Report?
No. Reports covers one General or Feedback form at a time. It is also separate from the sales Reports in the main menu.
Can Learners or Customers Open These Reports?
Reports is a team area, with no public report link. You can share a saved PDF or CSV yourself, but check it first: PDF can contain internal question summaries, and CSV can contain contact details and internal answers.
Why Don’t Feedback Report Totals Match My Published Reviews?
A feedback response can exist without a published review. Reports counts matching responses to this form, including imported reviews where present. Use Review Status or Has Review to narrow the group. Viewing or filtering Reports does not publish or hide reviews.
Why Does Reports Say “No answers to chart yet”?
The form has no responses. For a General form, follow Create and Share a General Form. For a Feedback form, check Set Up Course Feedback Forms and Reviews.
Why Do My Filters Match No Responses?
The selected view or filter conditions do not match any submissions. Review the conditions or select Clear Filters to remove them and return to the form’s responses.
Why Does My Form Have Responses but No Questions to Chart?
The current form has no supported report questions. It may contain only excluded fields, or its supported questions may have been removed. Open Responses to read the stored submissions.
What Should I Do If the Charts Fail to Load?
Select Try Again. If the error continues, contact Cademy Support with the form name and error shown. The Form Reports guide has the full troubleshooting details.