C1.4 Dashboards and StoriesDelivered Online & In-PersonOnline & In-Person training sessionFlexible Dates£400
C1.3 Choosing Appropriate VisualisationsDelivered Online & In-PersonOnline & In-Person training sessionFlexible Dates£400
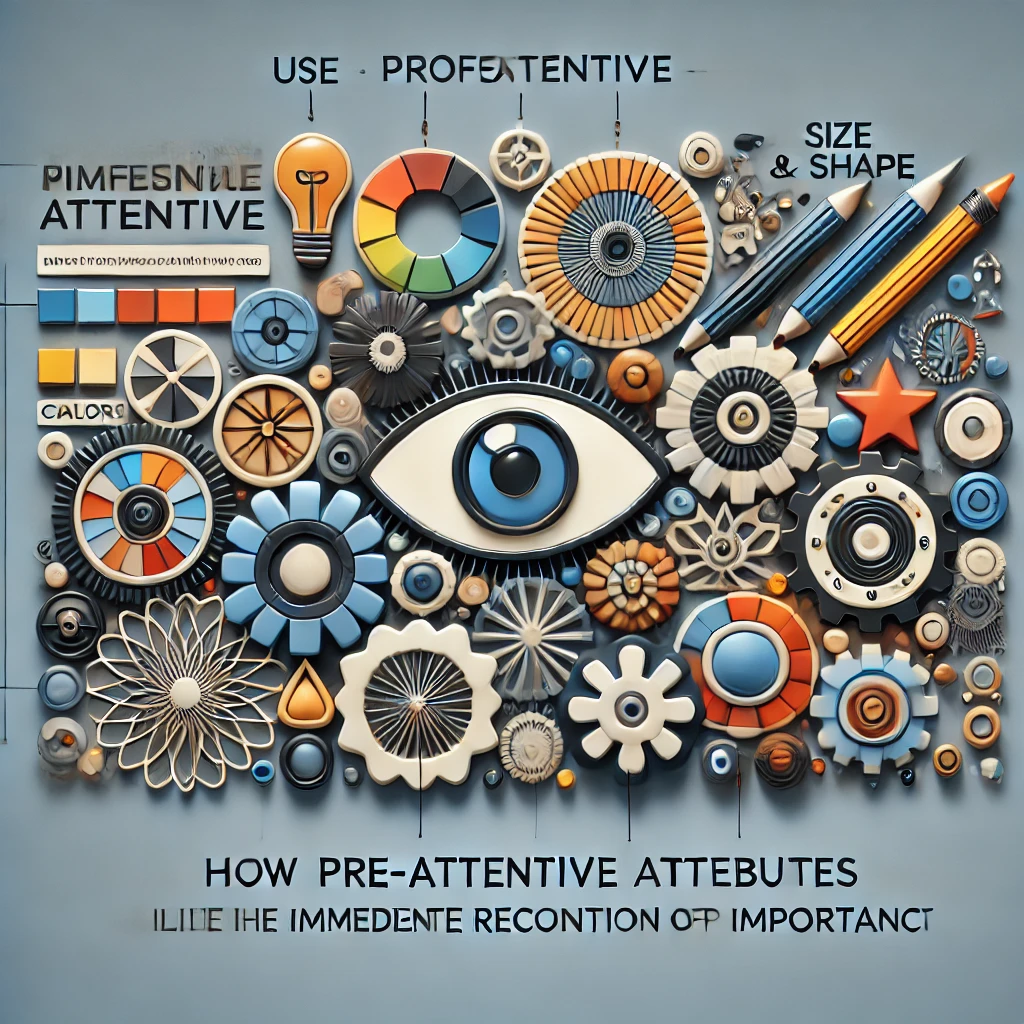
C1.2 Pre-Attentive Attributes & Visual IntegrityDelivered Online & In-PersonOnline & In-Person training sessionFlexible Dates£400
C1.1 Visual Analysis and Our MemoryDelivered Online & In-PersonOnline & In-Person training sessionFlexible Dates£400
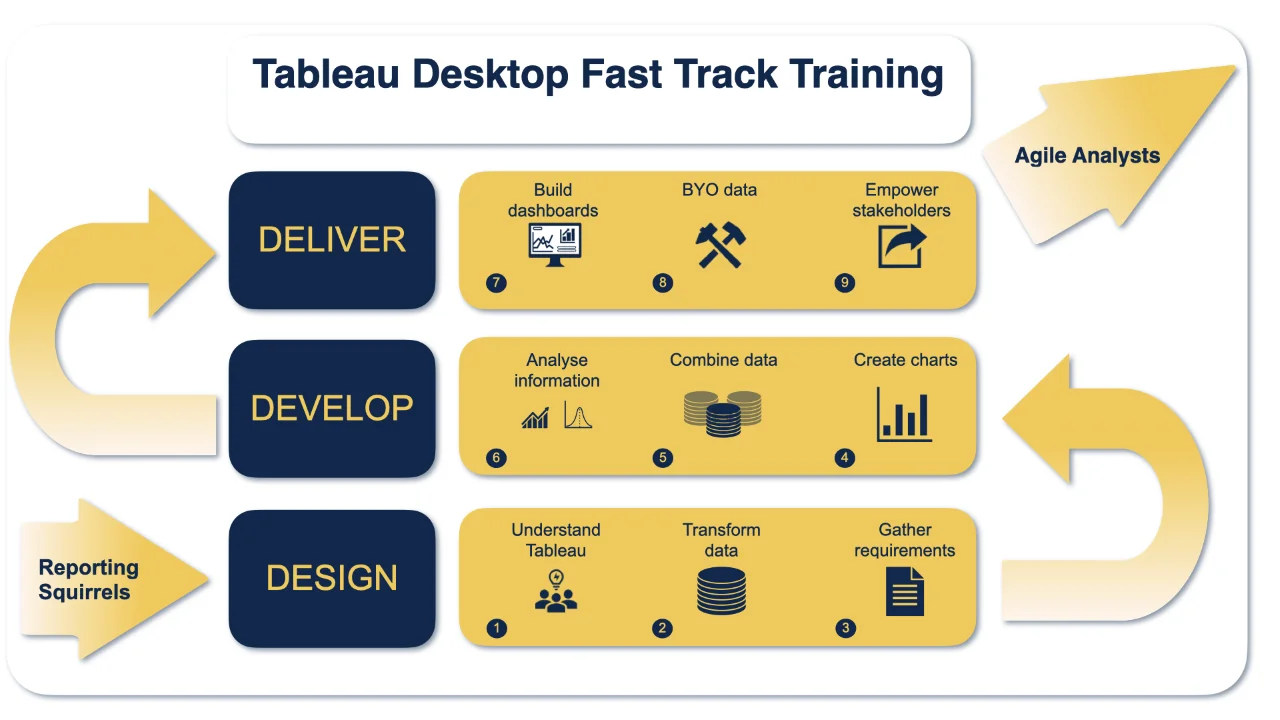
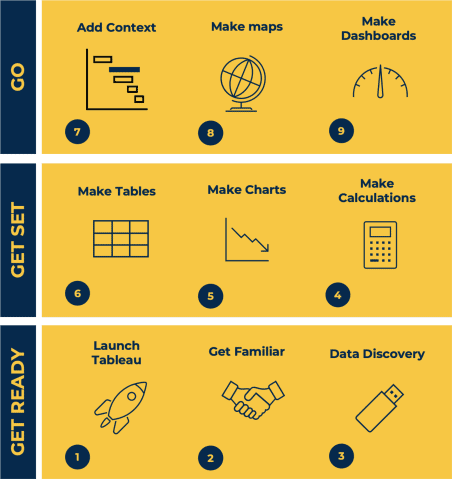
Tableau Desktop Training - FoundationDelivered in Birmingham + 2 more or UK Wide or OnlineBirmingham + 2 more or UK WideorOnlineFlexible DatesPrice on Enquiry
Visual Analytics Best PracticeDelivered in Birmingham + 2 more or UK Wide or OnlineBirmingham + 2 more or UK WideorOnlineFlexible DatesPrice on Enquiry