You can now access a brand new Reports area in your Admin dashboard at:
https://admin.cademy.io/reports
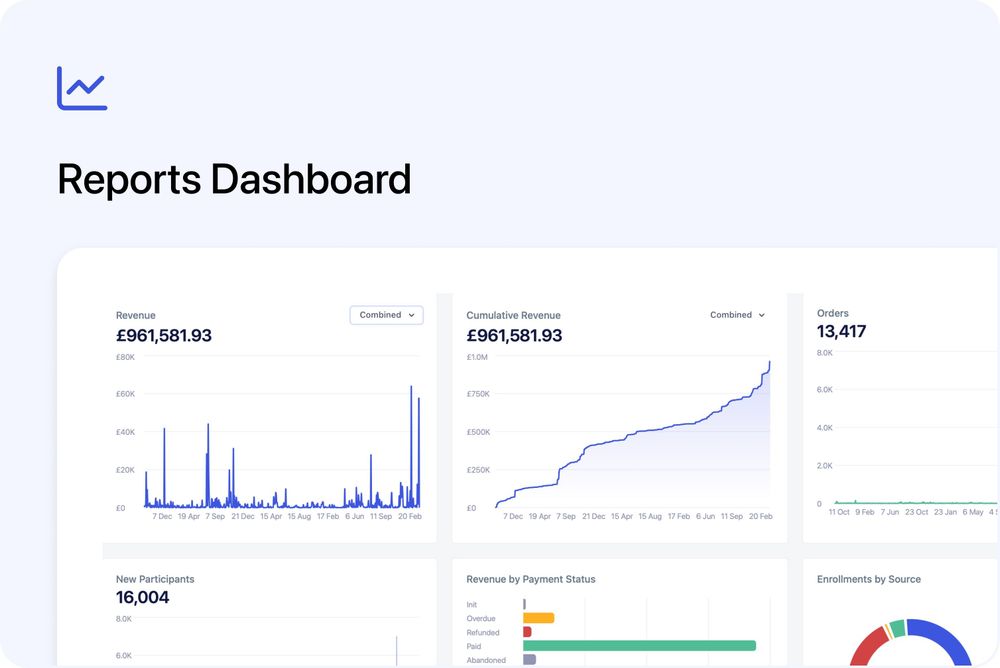
This gives you a clear, visual overview of how your courses are performing - without needing to export spreadsheets or manually combine data.
See your key metrics at a glance
The Reports dashboard includes interactive charts for:
- Revenue
- Cumulative Revenue
- Enrollments
- New Participants
- Revenue by Payment Status
- Enrollments by Source
- Revenue by Currency
- Top Courses
- Active Students
Each chart includes helpful tooltips so you can quickly understand what’s being measured.
Adjust date ranges instantly
You can quickly change the time period and see your charts update in real time.
Switch between daily, weekly, or monthly views to better understand trends and spikes.
Filter and save custom views
Reports support the same powerful filtering system used across the Admin dashboard.
Filter by specific courses, payment statuses, organisations, tags, and more - then save your view to return to it anytime.
Working with multiple currencies?
If you sell in more than one currency, headline totals are displayed in your default account currency for a high-level overview.
For exact figures, review the breakdown in the Revenue by Currency chart.
This is the first version of Reports, and we plan to expand it with additional charts and insights. If there’s something specific you’d like to see next, we’d love your feedback.