- Professional Development
- Medicine & Nursing
- Arts & Crafts
- Health & Wellbeing
- Personal Development
915 GRE courses delivered Live Online
Existential Dialogue 2025: "Hysteria" with Bárbara Godoy
By Therapy Harley Street
Hysteria’s history, rooted in Greek myth, evolved into a Victorian belief of a “wandering uterus” leading to disturbing medical practices. We aim to explore the lived experiences on irregular perceptions of reality with an open mind. Each Saturday includes: a live dialogue between Prof. Ernesto Spinelli and an International Existential Therapist; a moment to share your thoughts and feelings with the teachers; and a final integration facilitated by Bárbara Godoy. This series of ten dialogues set out to explore the multifaceted dimentions and complexities associated with Existential Therapies. It attempts to engage with various interpretations of insanity through the lens of patients often painful, confounding, and deeply unsettling life experiences. Hysteria- between Prof. Ernesto Spinelli and Bárbara Godoy “In this talk, I will compare the Histerical patient to the ancient Greek myth of Persephone, the goddess who traversed the boundaries between the world of the living and the underworld. Just as Persephone’s cyclical descent and return mirrored the changing seasons, hysteria was seen as a condition where emotions and experiences defied easy classification. This notion of transgressing boundaries became a cornerstone of early psychoanalysis. In Victorian times, hysteria took a decidedly bizarre turn. Here, the culprit was believed to be a mobile womb, an organ capable of throwing into disorder and confusion. This “wandering womb” was blamed for a variety of ailments and behaviours, particularly any expression of female desire out-of-wedlock. In a truly disturbing reflection of these beliefs, legal rulings based on this theory emerged. In some cases, women diagnosed with hysteria could be forced to undergo a hysterectomy.” Bárbara Godoy. Bárbara Godoy M.A., Adv. Dip. Exi. Psy, UKCP accredited Psychotherapist and Supervisor, MBACP and SEA – Director of Therapy Harley Street. Bárbara’s academic experience in London since 2008 includes lecturing and researching on the theory and practice of Phenomenological Existential Therapy on Doctorate, MA and professional courses at the School of Psychotherapy and Counselling Psychology, Regent’s University and the New School of Psychotherapy and Counselling directed by Emmy van Deurzen. Bárbara has facilitated therapeutic Group Work internationally since 1997. The question about the meaning of Being-Woman was the topic of her thesis completed in 2005 and evolved into two main Women’s Groups: “Nine muses” and “Four Seasons” which she leads in addition to her individual private practice. Currently, as the clinical director of THS, Bárbara leads a team of over 20 professional practitioners in the area of Psychological services and Wellbeing consultancy. Bárbara is also the founder-director of THS’s Personal Development and CPD Programmes. Prof. Ernesto Spinelli was Chair of the Society for Existential Analysis between 1993 and 1999 and is a Life Member of the Society. His writings, lectures and seminars focus on the application of existential phenomenology to the arenas of therapy, supervision, psychology, and executive coaching. He is a Fellow of the British Psychological Society (BPS) as well as an APECS accredited executive coach and coaching supervisor. In 2000, he was the Recipient of BPS Division of Counselling Psychology Award for Outstanding Contribution to the Profession. And in 2019, Ernesto received the BPS Award for Distinguished Contribution to Practice. His most recent book, Practising Existential Therapy: The Relational World 2nd edition (Sage, 2015) has been widely praised as a major contribution to the advancement of existential theory and practice. Living up to the existential dictum that life is absurd, Ernesto is also the author of an on-going series of Private Eye novels. Date and Time: Saturday 13 December from 2 pm to 3 pm – (UK time) Individual Dialogue Fee: £70 Venue: Online Zoom FULL PROGRAMME 2025: 25 January “Knots” with Prof. Ernesto Spinelli and Bárbara Godoy 22 February “Healing” with Dr. Michael Guy Thompson and Prof. Ernesto Spinelli 22 March “Difference” with Prof. Tod DuBose and Prof. Ernesto Spinelli 12 April “Polarisation” with Prof. Kirk Schneider and Prof. Ernesto Spinelli 3 May “Character” with Prof. Robert Romanyshyn and Prof. Ernesto Spinelli 21 June “Opening” with Dr. Yaqui Martinez and Prof. Ernesto Spinelli 19 July “Meaning” with Dr. Jan Resnick and Prof. Ernesto Spinelli 25 October “Invention” with Dr. Betty Cannon and Prof. Ernesto Spinelli 15 November “Hallucination” with Prof. Simon du Plock and Prof. Ernesto Spinelli 13 December “Hysteria” with Bárbara Godoy and Prof. Ernesto Spinelli Read the full programme here > Course Organised by:

Customer Service
By Mpi Learning - Professional Learning And Development Provider
Ensuring that you provide the level of service that your customers want to be delivered through your people. This programme develops the skills and behaviours that enhance the experience that your customers receive.

Email Etiquette
By Nexus Human
This course is intended for Beginner-Moderate exposure is recommended for this course. The topics covered are cumulative in nature, and they require minimal understanding of email applications and composition. Overview The objective of the course is to give students the information needed to create emails that are written in a succinct, effective, and user-friendly manner. Students will learn how to set up an email subject, salutation, and will then work on how to write a credible email. In this course, students will learn about e-mail policies and learn how to write professional e-mail memos that convey appropriate messages. 1 - E-mail basics E-mail characteristics Writing online versus on paper Understanding the advantages and disadvantages of e-mail Understanding the cultural significance of e-mail E-mail programs Using an e-mail program to send e-mail When to use e-mail Communicating by e-mail Understanding when to avoid using e-mail Writing an e-mail message Using the MAIL acronym 2 - E-mail policies Company policies Avoiding improper e-mail messages Ensuring employee compliance to e-mail policies Copyright laws, viruses, and liability Avoiding copyright infringement Avoiding viruses Identifying e-mail liability 3 - E-mail features and security Features of an e-mail program Using attachments Using priority labels and signature files Features of an e-mail program Using attachments Using priority labels and signature files Discussing e-mail program options Securing e-mail Using encryption and digital signatures Using passwords 4 - E-mail messages Message headers Using headers E-mail message body Including proper greeting Structuring an e-mail message Closing an e-mail message 5 - E-mail effectiveness E-mail recipients Considering the factors that determine e-mail writing Anticipating recipient reaction Message management Managing your e-mail effectively 6 - Netiquette guidelines Netiquette style Using proper tone Following formatting guidelines Emoticons and abbreviations Using emoticons and electronic abbreviations 7 - Composing online correspondence Online communication Achieving the objective of the message Language and punctuation Improving online writing style Using punctuation correctly Efficient writing habits Constructing sentences Constructing paragraphs Editing e-mail messages


Iridology Diploma
By Plaskett International
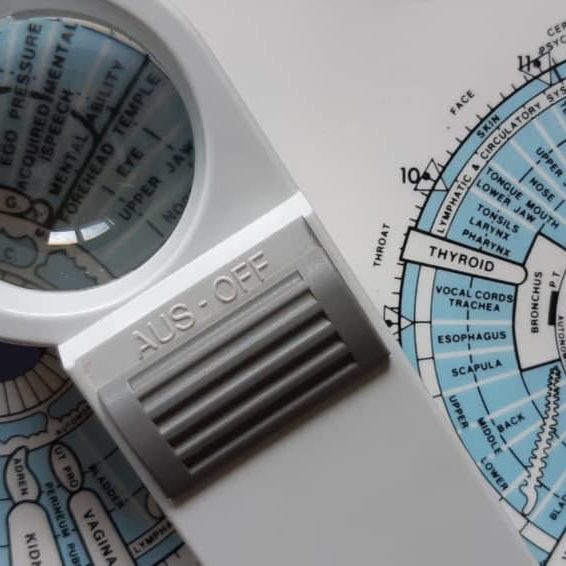
LEARN HOW IRIDOLOGY CAN MAKE A HUGE CONTRIBUTION TO ANY COMPLEMENTARY PRACTICE A MESSAGE FROM THE AUTHOR I want to welcome you most warmly to the study of Iridology. Students of our course have taken their knowledge out into the world of practice and they have been able to see more penetratingly into the health of their patients. They have seen many truths about causes and effects in health and disease - that is what allows you to understand those extra things that make you into an even better healer. I think you are going to find this the most intriguing and absorbing study and, certainly, that is my sincere hope. As you precede, much of what you learn will amaze you and inspire wonder at the ways of the human body and mind. As you tread this very special road, I pass on to you the words that Bernard Jensen gave me years ago when I was his student, inscribed upon the inside cover of his book: “Seek the Higher Values in Life”. DR. LAWRENCE PLASKETT WHAT IS IRIDOLOGY? Iridology is the art of iris analysis. The iris is connected to the brain via the hypothalamus and can give naturopathic read outs on tissue conditions in various parts of the body. With training and practice it is possible to read signs indicative of biochemical, emotional and environmental influences that are hard to determine by other means. We can thus interpret health (and even aspects of personality) by close examination of the eyes, using suitable illumination and a magnifying glass. The close relationship between naturopathic iridology as an assessment tool and nutritional therapy and other naturopathic disciplines continues and grows closer. Now Iridology can make a huge contribution to complementary therapeutic practice and enhanced by our wonderful digital collection of eye photographs, the learning process with the Plaskett International College is a profound and exciting one. We teach Iridology quite separately from other topics and anyone who possesses, or expects to possess, a practitioner's qualification in any therapeutic discipline, may join the course. Course Duration 12 months Study Hours 200 hours Course Content 9 sections Course Fee £495 How Can Iridology Help Practitioners? Examples of how iridology can help practitioners Did you know that some iris features are so very plain that you can see them with the naked eye in ordinary social contact? You can see from two or three feet away in many cases that the person has a toxic digestive system (a strong wide dark ring around the pupil margin). You can often tell that the person has an overactive stomach (a narrow bright white ring very close to the pupil). You can tell when the skin is overlaid with toxins so that the skin's function in excreting toxins from the body is jeopardised (very narrow dark ring around the iris margin). You can tell in some people (rather advanced cases) that they suffer badly from sodium and potassium imbalance and have placed themselves at potential risk from cholesterol accumulation (the so-called corneal arcus, a white or off-white cloudy deposit, usually fairly thick, around the iris margin). Another example is the ring of spots or 'tophi' represented by the lymphatic rosary. Its mere presence tells one that there is sluggishness in the lymphatic system. When these tophi are darkly pigmented, the situation gives rise to concern for the possible generation of lymphatic illness. Using the precise positioning of iris reflex areas contained on the iris chart, one may distinguish many key points of analysis. Areas of stress and tension can be pinpointed by identifying 'contraction furrows’. Past injuries and adhesions show themselves as contortions of the normally regular and even iris fibres. You can answer questions like:- Is it the pancreas or the liver that is responsible for the trouble? Is the patient's hypertension caused by a defect of or toxic deposits in the particular brain area that is geared to control blood pressure? One of Jensen's rather dramatic illustrations is of the iris of a man who has just been shot. It shows the precise areas of tissue damage within the body and the response is very fast. The number of potential examples is almost without limit. The above may suffice to show the types of things that iridology can do for practitioners. We hope it will help you decide to study Iridology with the Plaskett International College. Course Overview The course covers the nature of iris observation, the nutritive zone, the iris chart, the chronic and acute, the intestinal and stomach zones and nerve collarette, the constitution type, respiratory system, lacunae, open lacuna, inherent weaknesses, the organs of elimination, other organs, special signs, complete diagnosis of a subject. The treatment of the topic follows the principles of Bernard Jensen in the USA. Once the basics have been learnt, the course teachings then extend considerably by bringing in the work of Dorothy Hall and of Dr Josef Deck, both of which are the subject of a special presentation during the course. The published insights of Farida Sharan and Harri Wolf, while not separately presented, also influence the presentation of the course material. Both the Australian School, (Dorothy Hall) and the German School, (Dr Deck/Harri Wolf), offer an added dimension to the study and interpretation of the constitution. PERSONALITY ASPECTS & CONSTITUTIONAL TYPES The study focuses upon the different personality aspects, which show up in different constitutional types. Dorothy Hall gives insights into what contributes to various different types of personality and their emotional and mental responses and their pre-dispositions to health or disease. Different sorts of people can have different priorities, preferences and imperatives built into their very nature from or before birth, sometimes determining the course of their entire lives and their attitudes to the world and to other people. AN EMPATHY BETWEEN PATIENT & PRACTITIONER The course teaches an understanding of these types and facilitates an empathy between patient and practitioner. It shows how people of the differing constitutional types are likely to go out of balance either mentally or emotionally and how their vulnerability to various physical ailments varies. The German School offers a very exciting and precise approach to the constitutional types, which is really quite different, but no less helpful. It highlights variations in the susceptibility to diseases of different organs and systems. THE 3 SCHOOLS OF THOUGHT It is a prime purpose of this course, not only to teach these differing positions, but also to demonstrate how it is that all three of these major schools of Iridology embody different aspects of the truth, how each is individually valuable and how a full and deep understanding of the meaning of 'constitution' can be gained through a sympathetic synthesis of the contributions from all three of these schools. BREAKDOWN OF THE COURSE SECTIONS In total there are 9 sections comprising of text, videos and iris images to study: SECTION 1 GENERAL PRACTICE AND AN ACCOUNT OF THE NUTRITIVE ZONE Areas Covered Iris colour Information that iridology can give us The structure of the eye and the iris Using the iris as an assessment tool The principle of reflex areas The Nutritive Zone Abnormality in the colon The Collarette (autonomic nerve wreath or anw) Diagnosis of the constitution based upon fibre structure Studies on images of real eyes SECTION 2 FEATURES OF THE FIBRES OUTSIDE THE COLLARETTE Areas Covered The general layout of fibres outside the collarette Inherent weaknesses First stage in further deterioration of an inherent weakness The meaning of darkness in the iris The development of discrete – open lacunae Lacunae Further notes about lightness and darkness amongst the fibres Healing lines Crypts Round the iris chart – the left iris Round the iris chart – the right iris Checking which structures and inside and which outside the collarette The organ systems The neural arc reflex SECTION 3 SPECIAL SIGNS Areas covered The corneal arcus (sodium ring, cholesterol ring, lipemic ring) The tophi (also lymphatic tophi or lymphatic rosary) Corneal Arcus The anaemia sign The catarrhal sign Acidity Grey background Scurf rim Circulatory ring Sphincter muscle (also called pupillary sphincter) Pigments (topastible or topolabile) Psoric spots Contrcation furrows Radial furrows SECTION 4 THE CONSTITUTIONS IN RELATION TO PERSONALITY TYPE AND DISEASE DISPOSITION Areas covered Very resilient Resilient average Moderately resilient Mildly resilient SECTION 5 MORE ABOUT WHITE SIGNS Areas covered Revision of distinctions between the different white signs Pictures of irises with white signs, with commentaries Further interpretation of the corneal arcus Further interpretation of the lytophi More general interpretation of the colour white SECTION 6 COLOURS IN THE IRIS AND OTHER SPECIAL SIGNS Areas Covered Yellow pigment in the iris Orange pigment Brown pigment Contraction furrows Radial furrows Psoric spots Pupillary border The “friendly fibrils” sign Summary of remedies SECTION 7 THE CONSTITUTION AND SIGNS ACCORDING TO THE GERMAN SCHOOL Areas Covered The German school of iridology Our approach to teaching the German school Introduction to the German constitutional types The lymphatic constitutions Mixed biliary constitution or biliary constitution Haematogenic (or haematogenous) constitution The way to use information on the German constitutions New signs that are specific to the German school Treatment recommendations for constitutional types SECTION 8 ADVANCED STUDIES OF THE IRIS Areas Covered Further details of the iris chart – its layout and its implications Neural arc reflex Deformation of pupil shape and position Advanced study of fibre separations, sinuosity, injuries & adhesions Lacunae of different shape and appearance The b3 bulge and the pterygium Working with genetically brown eyes SECTION 9 THE CONSULTATION & THE PRACTICALITIES Areas Covered Diagnosing pathology of individual critical organs Personality interpretations based upon the German school Conducting an iridology consultation Practical aspects of iris examination Making drawings of the iris and recording the data The uses, advantages and limitations of iris photography and its place in iridology practice Equipments and techniques of iris photography Using the computer to store and process digital images The interaction of signs Interpreting the whole iris in conjunction with the case study Pointers to treatment Carrying out case histories TESTIMONIALS Here's what students have to say about the course Emma Rubio, Health Coach Spain "As a Health Coach I decided to pursue my studies with the Plaskett College to become a Nutritional Therapist. For that, I am also studying Iridology. I am happy to have a tutor to answer my doubts and I like the flexibility that the College offers me. I love the subject of Iridology and the way it is explained, I also like having some videos of Dr Plaskett teaching Iridology as I admire him." Dr Ezequiel Lafontaine, Iridologist Puerto Rico "I LOVE IRIDOLOGY. I have over 30 iridology books, Italian, French, German, Spanish and English, plus over 4,000 photos from my own practice. I took this course for a refresher course and found the material was second to none." Mrs D. Moothy, Nutritional Therapist Mauritius “The distance learning courses have given me the opportunity to pursue my dreams through a program that was not only flexible and convenient for my schedule, but was also challenging and rewarding. I thoroughly enjoyed the readings and the assignments but most importantly, I enjoyed being able to do things at my pace. I must say that the most exciting and challenging course was the Iridology Diploma, and I am happy that I was able to do well in all the courses."
M.D.D PSYCHOTHERAPY LONDON PACKAGE (SELF IMPROVEMENT)
(27)By Miss Date Doctor Dating Coach London, Couples Therapy
Introducing the Psychotherapy London Package: Expert Guidance for Personal Growth and Emotional Well-being Are you searching for professional psychotherapy services in London to support your personal growth and emotional well-being? Miss Date Doctor’s Psychotherapy London Package offers you access to highly trained therapists who are dedicated to helping you navigate life’s challenges and achieve greater self-awareness and fulfillment. Psychotherapy is a collaborative and evidence-based therapeutic approach that addresses various mental health concerns, relationship issues, and emotional difficulties. Our experienced therapists in London provide a safe and confidential space for you to explore your thoughts, emotions, and experiences, facilitating positive change and growth. Here’s how the Psychotherapy London Package can support you: Comprehensive Assessment: Our therapists will conduct a thorough assessment to understand your unique needs, challenges, and goals. This assessment will serve as the foundation for designing a tailored treatment plan that suits your specific requirements. Evidence-Based Techniques: The Psychotherapy London Package draws from a range of evidence-based techniques and modalities, ensuring that you receive the most effective and appropriate therapeutic interventions. Individualized Approach: Your therapy sessions will be personalized to address your specific concerns and aspirations. Our therapists recognize that each individual’s journey is unique, and they will tailor the treatment to support your personal growth. Emotional Support: Our therapists provide a supportive and empathetic environment where you can freely express your thoughts and feelings. This emotional support is crucial for fostering a strong therapeutic alliance and promoting healing. Stress Reduction: Psychotherapy can be an effective tool for managing stress and anxiety. Through guided discussions and coping strategies, you’ll develop skills to navigate life’s challenges with greater resilience. Relationship Enhancement: If you are seeking to improve your relationships, our therapists will provide guidance and techniques to enhance communication, foster emotional intimacy, and resolve conflicts effectively. Self-Exploration and Awareness: Psychotherapy encourages self-exploration and self-awareness. By gaining insight into your thoughts and behaviours, you’ll be empowered to make positive changes in your life. Positive Change: With the support of our skilled therapists, you’ll work towards achieving meaningful and lasting positive changes in various aspects of your life. The Psychotherapy London Package at Miss Date Doctor offers you the opportunity to embark on a transformative journey of personal growth and emotional well-being. Our therapists are committed to helping you navigate life’s challenges and empowering you to lead a more fulfilling and balanced life. Take the first step towards greater self-awareness and well-being with the Psychotherapy London Package. Invest in your mental and emotional health, and unlock your potential for positive change. Discover the benefits of psychotherapy and experience the guidance and support you deserve on your journey to a happier and healthier life. 3 x 1 hour sessions https://relationshipsmdd.com/product/psychotherapy-london-package/

Medical Terminology Training Courses - Level 3
By Mediterm Training
This course leads to the Mediterm Advanced Certificate in Medical Terminology (Level 3), the highest qualification in Medical Terminology, and can be studied flexibly over 20 weeks

Innovation Project Management: Virtual In-House Training
By IIL Europe Ltd
Innovation Project Management: Virtual In-House Training Companies need growth for survival. Companies cannot grow simply through cost reduction and reengineering efforts. This program describes the relationship that needs to be established between innovation, business strategy, and project management to turn a creative idea into a reality. We will explore the importance of identifying the components of an innovative culture, existing differences, challenges, and the new set of skills needed in innovation project management. Companies need growth for survival. Companies cannot grow simply through cost reduction and reengineering efforts. Innovation is needed and someone must manage these innovation projects. Over the past two decades, there has been a great deal of literature published on innovation and innovation management. Converting a creative idea into reality requires projects and some form of project management. Unfortunately, innovation projects, which are viewed as strategic projects, may not be able to be managed using the traditional project management philosophy we teach in our project management courses. There are different skill sets needed, different tools, and different life-cycle phases. Innovation varies from industry to industry and even companies within the same industry cannot come to an agreement on how innovation project management should work. This program describes the relationship that needs to be established between innovation, business strategy, and project management to turn a creative idea into a reality. We will explore the importance of identifying the components of an innovative culture, existing differences, challenges, and the new set of skills needed in innovation project management. What you Will Learn Explain the links needed to bridge innovation, project management, and business strategy Describe the different types of innovation and the form of project management each require Identify the differences between traditional and innovation project management, especially regarding governance, human resources management challenges, components of an innovative culture and competencies needed by innovation project managers Establish business value and the importance of new metrics for measuring and reporting business value Relate innovation to business models and the skills needed to contribute in the business model development Recognize the roadblocks affecting innovation project management and their cause to determine what actions can be taken Determine the success and failure criteria of an innovation project Foundation Concepts Understanding innovation Role of innovation in a company Differences between traditional (operational) and strategic projects Innovation management Differences between innovation and R&D Differing views of innovation Why innovation often struggles Linking Innovation Project Management to Business Strategy The business side of innovation project management The need for innovation targeting Getting close to the customers and their needs The need for line-of-sight to the strategic objectives The innovation enterprise environmental factors Tools for linking Internal Versus External (Co-creation) Innovation Open versus closed innovation Open innovation versus crowdsourcing Benefits of internal innovation Benefits of co-creation (external) innovation Selecting co-creation partners The focus of co-creation The issues with intellectual property Understanding co-creation values Understanding the importance of value-in-use Classification of Innovations and Innovation Projects Types of projects Types of innovations Competency-enhancing versus competency-destroying innovations Types of innovation novelty Public Sector of Innovation Comparing public and private sector project management Types of public service innovations Reasons for some public sector innovation failures An Introduction to Innovation Project Management Why traditional project management may not work The need for a knowledge management system Differences between traditional and innovation project management Issues with the 'one-size-fits-all' methodology Using end-to-end innovation project management Technology readiness levels (TRLs) Integrating Kanban principles into innovation project management Innovation and the Human Resources Management Challenge Obtaining resources Need for a talent pipeline Need for effective resource management practices Prioritizing resource utilization Using organizational slack Corporate Innovation Governance Types of innovation governance Business Impact Analysis (BIA) Innovation Project Portfolio Management Office (IPPMO) Using nondisclosure agreements, secrecy agreements, confidentiality agreements, and patents Adverse effects of governance decisions Innovation Cultures Characteristics of a culture for innovation Types of cultures Selecting the right people Linking innovation to rewards Impact of the organizational reward system Innovation Competencies Types of innovation leadership The need for active listening Design thinking Dealing with ambiguity, uncertainty, risks, crises, and human factors Value-Based Innovation Project Management Metrics Importance of innovation project management metrics Understanding value-driven project management Differences between benefits and value - and when to measure Traditional versus the investment life cycle Benefits harvesting Benefits and value sustainment Resistance to change Tangible and intangible innovation project management metrics Business Model Innovation Business model characteristics Impact of disruptive innovation Innovation Roadblocks Roadblocks and challenges facing project managers Ways to overcome the roadblocks Defining Innovation Success and Failure Categories for innovation success and failure Need for suitability and exit criteria Reasons for innovation project failure Predictions on the Future of Innovation Project Management The Six Pillars of changing times Some uses for the new value and benefits metrics

Advanced 3ds Max and After Effects Masterclass (Live Online)
By ATL Autocad Training London
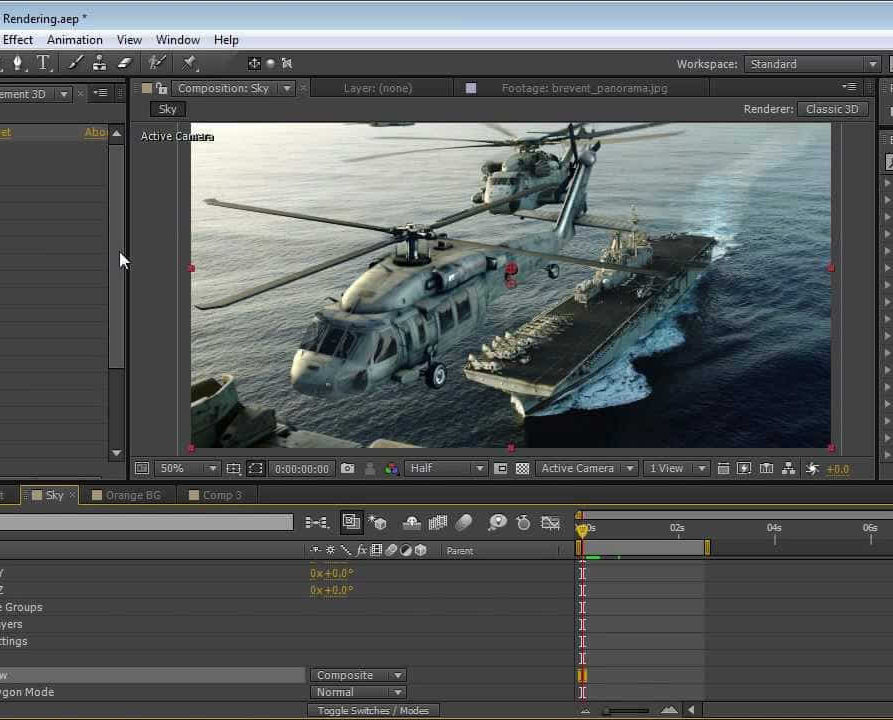
Who is this course for? Advanced 3ds Max and After Effects Masterclass. This course is designed for 3D artists, animators, and visual effects artists seeking comprehensive training in 3ds Max and After Effects. Whether you're a beginner or an intermediate learner, this course provides skills and techniques for creating stunning 3D models and captivating visual effects. Check our Website Duration: 10 hours Training Approach: 1-on-1 Sessions and Tailored Content. When: Book anyday Mon to Sat between 9 am and 7 pm. Course Title: Motion Graphics Mastery: 3ds Max and After Effects Duration: 10 hours Course Highlights: Introduction to 3ds Max: Get acquainted with the 3ds Max interface Create captivating 3D objects and scenes Explore cameras, lighting, materials, and textures Basic Animation Principles in 3ds Max: Grasp keyframes and interpolation techniques Craft seamless animation cycles for 3D objects Apply animation principles with precision using the graph editor Advanced Animation Techniques in 3ds Max: Master custom controllers and expressions for intricate animations Utilize inverse kinematics for lifelike motion Create dynamic particle systems and simulations for realistic effects Exporting 3D Scenes to After Effects: Prepare 3D scenes for seamless export Effortlessly import 3D scenes into After Effects Explore 3D layer properties for depth and realism Basic Compositing in After Effects: Navigate the After Effects interface with confidence Utilize keyframes and animation curves for smooth transitions Blend 2D and 3D elements seamlessly Apply a variety of effects and filters for added visual impact Advanced Compositing Techniques in After Effects: Employ masks and mattes for precision and creative effects Harness the power of 3D camera tracking for realistic integration Work with green screen footage for professional compositions Create breathtaking special effects that captivate the audience Integrating 3D and Live-Action Footage in After Effects: Match camera angles and movements seamlessly Incorporate 3D camera data for dynamic compositions Add shadows and reflections to enhance realism Rendering and Outputting Animations: Efficiently render 3D scenes from 3ds Max Utilize the After Effects render queue for optimized output Export animations in various formats tailored to specific needs Motion Graphics Projects: Craft a fundamental motion graphics sequence Design a captivating animated logo Create an engaging animated title sequence that captures attention Course Requirements: Computer with 3ds Max and After Effects software installed Basic understanding of computer operations Enthusiasm for exploring the world of motion graphics and animation Upon completing the Motion Graphics Mastery: 3ds Max and After Effects course, participants will: Master 3D Animation: Gain expertise in creating intricate 3D objects, scenes, and animations in 3ds Max, applying advanced animation principles and techniques. Seamless Integration: Learn to seamlessly export 3D scenes from 3ds Max to After Effects, effectively blending 2D and 3D elements for dynamic compositions. Advanced Compositing: Acquire advanced compositing skills, including the use of masks, mattes, 3D camera tracking, and green screen techniques to create professional-grade visual effects. Professional Rendering: Understand the process of rendering 3D scenes and animations, ensuring optimal quality for various output formats. Motion Graphics Projects: Develop practical motion graphics projects, including motion sequences, animated logos, and title sequences, showcasing creativity and technical proficiency. Creative Problem-Solving: Enhance problem-solving skills through hands-on projects, allowing participants to tackle real-world motion graphics challenges effectively. Industry-Standard Tools: Gain proficiency in using industry-standard software tools - 3ds Max and After Effects - essential for careers in animation, visual effects, and motion graphics. Professional Portfolio: Create a compelling portfolio of motion graphics work, showcasing diverse skills and creativity, essential for professional opportunities in the field. Effective Collaboration: Develop teamwork and communication skills by collaborating on motion graphics projects, fostering a collaborative and creative working environment. Confidence and Expertise: Build confidence in applying animation principles, compositing techniques, and visual effects skills, enabling participants to approach complex projects with confidence and creativity. Download Adobe After Effects. Download Autodesk 3ds max. Skills Acquired: Advanced 3D Modeling: Master the intricacies of 3D object creation and manipulation in 3ds Max. Visual Effects Creation: Learn the art of crafting compelling visual effects using After Effects. Texturing and Lighting: Understand texturing techniques and lighting principles for realistic 3D scenes. Animation Techniques: Develop skills in animating 3D models and adding dynamic motion to visual effects. Job Opportunities: 3D Modeler: Create detailed and realistic 3D models for various industries. Visual Effects Artist: Work in film, TV, or advertising, creating stunning visual effects sequences. Motion Graphics Designer: Design animated graphics and visual elements for videos and multimedia projects. Game Designer: Contribute to game development by creating 3D assets and visual effects. Video Editor: Enhance videos with professional visual effects and animations. Step into Personalized Learning! Why Us? Discover the Advantages: Tailored One-on-One Training: Experience individualized coaching from skilled architects and designers, either in-person at (SW96DE) or through live online sessions, available Monday to Saturday, 9 am to 7 pm. Customized Tutorials: Take home exclusive video tutorials crafted to elevate your learning experience. Comprehensive Learning Resources: Access a digital reference book for thorough revision, ensuring a deep understanding of every concept. Free Ongoing Support: Enjoy continuous post-course assistance via phone or email, ensuring your success even after class completion. Flexible Syllabus: We tailor the syllabus and projects to your specific needs, ensuring focused learning on what matters most to you. Official Certificate: Certificate upon course completion. Why Us? Individualized Learning Support: Our courses, ranging from 10 to 120 hours, offer unwavering assistance at every stage. With personalized homework assignments and free post-course support, we guide you toward mastering software with unmatched expertise. Personal Attention, No Crowded Classrooms: Bid farewell to overcrowded classrooms. Experience the intimacy of one-on-one learning, ensuring you receive the undivided attention you deserve in a confident and comfortable environment. Financial Flexibility: Embarking on your educational journey shouldn't strain your finances. We offer diverse payment plans tailored to your needs. Explore available options and begin your learning adventure today. Expert Instructors, Real-world Experience: Our instructors, chosen for their industry expertise and passion for teaching, are dedicated to imparting invaluable skills to eager learners.
Weight Management Consultancy Diploma
By Plaskett International
LEARN HOW TO BECOME A WEIGHT MANAGEMENT CONSULTANT WITH THE CLIENT'S HEALTH & WELLBEING AT THE CORE. A MESSAGE FROM THE AUTHOR As you enter into this study, I want you to be fully aware of what lies before you. If you save people from overweight, you will also increase life-expectancy and/or prevent the onset of serious debilitating diseases. There will also be those clients whose life has been long limited in a psychological sense and you will be able to help them to restore their sense of verve and vitality so they can again live life to the fullest extent. This will be done through learning special expertise both technically and in person-to-person relations. With these words of encouragement, I warmly welcome you to this course of study where the amount of potential job satisfaction is incalculable. DR. LAWRENCE PLASKETT Course Duration 12 months Study Hours 200 hours Course Content 13 sections Course Fee £475 Course Overview The Plaskett Weight Management Consultancy course will provide you with a detailed, systematic and scientifically-based training, fuller than any other we know of in the field. It will enable you to practise as a well-informed Weight Management Consultant and most importantly, you will be able to help and support individuals in their quest to lose weight whilst maintaining health and well-being. Learn the Basic Elements of Nutrition You will gain an understanding of the basic elements of nutrition with a focus on the key nutrients in order to avoid deficiencies when working with weight loss clients. Create Individualised Weight Loss Programmes You will develop the confidence to be able to make informed choices from a wide span of weight loss options and avoid the use of rigidly fixed methods, thereby delivering programmes best suited to individual needs. Become a Skilled Adviser You will learn the skills to be able to counsel on a one-to-one basis, we believe that this favours the resolution of individual circumstances and problems. You will receive the training to see your clients through every stage of the process, thereby maximising their chances of success. Expand Practice of Current Health Professionals In addition to those wanting to set up practice as a Weight Management Consultant, this course is ideally suited to current health & fitness professionals looking to enhance their practice. BREAKDOWN OF THE COURSE SECTIONS The Weight Management Consultancy Diploma includes the following 13 sections: SECTION 1 BASIC SCIENCE SUPPORT Whilst our main concern will be with weight loss, we need to understand some of the basic aspects of nutrition. These deal with the key nutrients that we have to control to reduce weight. They will also help us to understand how to lose weight without developing deficiencies. In Section 1, we begin the study of nutrients and foods by looking at the main bulk nutrients that our diets contain: protein, carbohydrate and fat. Before one can consider individual vitamins and minerals, one has to know about the nutrients that make up most of our diets, namely the bulk nutrients. These are the suppliers of food energy and ultimately help to decide an individual's size. You will need to understand these so as to manipulate them with skill. Areas Covered What are the bulk nutrients? Chemical elements contained in the bulk nutrients Proteins Carbohydrates Fibre Fats The energy reserve role of fat The lipoproteins of the blood SECTION 2 UNDERSTANDING THE FIELD & NATURE OF THE PROBLEM This section introduces the basic ideas of the training. The purpose of this course of training is to enable the student to help others who are overweight or obese to lose weight, and to do so in a professional manner. At the same time, it aims to motivate you and empower you to set up a practice as a ‘Weight Management Consultant’ that will lead to your gaining a good reputation in this field, developing a panel of satisfied clients and bringing you both status and income. Since losing weight is not easy, one has to be aware of all the different methods and ramifications that are a part of this intriguing subject. The professionalism comes from knowing a number of different “ways in” to help the clients and also from being able to develop awareness of the individuality of each client. This will put you in a position to find the best and most successful route to weight loss for each person who consults you. This will mean giving individual advice, not just the same advice to everyone. By recognising individuality we earn the client’s trust and appreciation and we also increase the chances of achieving the fullest possible success by being in a position to find individual solutions to each client’s problem. Areas Covered The aims of the work The clients’ motives The clients themselves The clients’ knowledge of nutrition The place of psychology The arithmetical equation of body weight Ways of working Getting fat is all too easy – we review how it happens Definition and classification: criteria for weight normality SECTION 3 THE THEORY OF THE CAUSES OF OVERWEIGHT & OBESITY In this section we explore 'The Theory of what Causes Overweight and Obesity'. We look at the underlying reasons for this current epidemic scale of the problem in developed societies throughout the world. Understanding this will give you an insight into what needs to be done. The Weight Management Consultant clearly needs to understand as fully as possible the causes of obesity in order to be able to formulate good advice. It is necessary to understand that, although the ultimate cause is always eating more than the body requires, that factor is modified by many subsidiary factors. One, that always interests clients, is whether or not one may be predisposed by one’s inheritance to put on and retain weight, so we deal with this question. Areas covered Relative effect of genetics and environment Hormonal disturbance in obesity Slower than normal rates of energy expenditure The role of fat cells Role of the enzyme lipoprotein lipase SECTION 4 THE HEALTH CONSEQUENCES OF EXCESS WEIGHT It is well known that being overweight or obese increases the chances of contracting chronic illnesses. This section examines the types of illnesses involved and the way that their incidence is affected by body weight. From the standpoint of a Weight Management Consultant, the use of this information is to present clearly the vital benefits that your work can bring to your clients in terms of freedom from illness. This knowledge can augment your job satisfaction, especially when you can see the client’s health condition improving as weight comes down. That can be expected to happen sometimes, but of course not always. So, potentially this information can serve to inform your clients about the degree to which slimming down from an overweight or obese condition can help them to avoid very negative health consequences. By passing on parts of this data to some carefully selected clients, you may perhaps either improve their flagging motivation, or increase their satisfaction level with their early results or with the efforts they are making. Areas covered The connection between overweight and ill health The risk of early death Illness and death from cardiovascular disease Illness and death from diabetes mellitus Illness and death from hypertension Illness and death from respiratory problems Illness and death from gallbladder disease Illness and immobility from arthritis Illness from gout Illness and death from cancer SECTION 5 FIRST PRINCIPLES OF CORRECTING EXCESS WEIGHT In this section we approach the practical side of the Weight Management Consultant’s job. The greatest skill required of the Consultant is that of formulating the advice in a way that combines efficacy with client acceptability. The mistake most often made in the approach to weight reduction is to employ only one method yet in pursuing reduction in a person’s weight, it is best to come at the problem from multiple angles simultaneously. The person’s diet may well have to be the first and foremost approach however, the main alternative approaches involve several different ways of preventing excess food materials from being stored, leading to overweight. If control of the diet is the only method one employs, then so much depends upon strict dietary control that the will and the motivation of the client may be too severely tested. However, an approach in which dietary control takes pride of place, but is supported by a number of other approaches, is more likely to find client acceptability and is therefore more likely, ultimately, to be successful. In this section we list these “prevention of storage” approaches before dealing more fully with the diet. Areas covered Strategy of weight control Reduction of food intake The use of balanced hypocaloric diets Strategies for reducing food intake in practice Using foods intended to increase metabolic rate Mixtures of the various strategies SECTION 6 REDUCING WEIGHT THROUGH DIET & DIETARY COMPOSITION The principal purpose of this section is to understand the scope that we have to reduce food calories in the diet without necessarily reducing the total weight of food consumed. It looks closely at understanding and measuring food energy. Working in this way with diet is kindest to the clients and makes fewer demands upon their efforts and their will to succeed. Areas covered Understanding food energy The make-up of daily diets What does the body have to do with tis energy? Water content of foods The differing energy contents of food dry matter Substituting low-calorie for high-calorie foods The first stage of calorie reduction Combining diet with exercise A further stage of calorie reduction SECTION 7 SELECTING INDIVIDUAL FOODS The previous section talks mainly about the first principles of reducing calorie intake while keeping the weight of daily food dry matter level. This is done mainly by varying the extent to which each food class contributes to the overall diet; we simply reduce the proportions of those food classes with the higher calorie content. This section now looks within food classes to pick out those foods that, individually, have lower calorie content than the average for foods within the class concerned and make the best contribution to an individual client’s diet. This is a further step to calorie reduction without loss of food bulk. Areas covered Different foods within any given class have different calorific values Choosing foods within food classes for calorie reduction Specific recommendations for individual foods within each class Care needed in using the information Calorie contents of the “more suitable foods” Dietary results from substituting individual foods The necessary provision of dietary fat The quality of dietary protein The quantity of dietary protein Choosing foods for overall dietary suitability SECTION 8 BUILDING YOUR KNOWLEDGE OF FOODS INTO DIETS In the Sections that have gone before, we have noted several key strategies aimed at reducing the client’s intake of calories. This section gets down to the key job of building and structuring a diet to help each particular client - the aim now is to address the actual prescribing of diets to enable you to build upon the principles already learned and to give the client a workable diet that can achieve his or her aims. Areas Covered The adjusting and re-balancing of the food classes Calculating the food replacements Targeting individual foods SECTION 9 FIRST LOOK AT CONDUCTING CONSULTATIONS This section takes you through managing the consultation, helping you to structure the activity to provide a satisfactory experience for your clients. This is the basis for a good approach to weight reduction. The section culminates in the provision of example diet sheets with guidelines according to food classes and guidelines according to mealtimes and considers the benefits of both. Areas Covered The consultant’s surroundings and manner Direction of the early conversation Collection of the dietary data Weight-loss ideas come to you during the data collection Identifying the largest food contributions to overweight Balancing the food classes Writing down the guidelines Substitution of individual foods Reduction in the food bulk eaten Integrating the entire diet Example diet sheets SECTION 10 COUNTING CALORIES. BENEFITS OF EXERCISE. THE KETO DIET. In section 10 we cover the method of calculating the calories in everyday life. We look at the benefits of exercise for suitable clients and discuss more specific diets such as the ketogenic diet. Areas Covered Calculating the calories The benefits of exercise The ketogenic diet SECTION 11 PROMOTING GOOD HEALTH. UNDERSTANDING DRUG TREATMENTS. FOLLOW-UP GUIDELINES. Brings us to the section where we set about designing slimming programmes that are not only effective at weight loss, but also promote good health. To give you an insight into the potential problems, we also look at the drug treatments given for overweight by doctors. We also take you through the guidelines for follow-ups after the first consultation. Areas Covered Slimming programmes to promote good health Understanding drug treatments for overweight Follow-up guidelines SECTION 12 USE OF SUPPLEMENTS TO PROMOTE LOSS OF WEIGHT This section deals with non-food substances, or supplements that with help with weight loss. It looks at how they actually achieve this and discuss their effectiveness and safety implications for the individual. These include some micronutrients, herbs, enzyme inhibitors and sequestering agents. Areas Covered Inhibition of fat absorption Changing body composition Substances encouraging increased thermogenesis Appetite suppressants Enzyme inhibition Prevention of fat synthesis Nutrients that may accelerate metabolism Appendix 1 – some abstracts of key articles Appendix 2 – summary of modes of action SECTION 13 MANAGING This rather substantial last section deals with a fuller and final part on “Managing the Consultations”. This further develops your consultation skills and objective setting in weight management practice. It also addresses the tricky question of compliance and weight regain and how to avoid it. Finally, it looks at “Running your Practice as a Business” to ensure that you have a grasp of the business principles that you will need. Areas Covered Managing the consultations – basic methodology Note on progressive reduction in energy needs Construction of the overall prescription – different components Running your practice as a business Appendix (more about why the slimming process slows down) TESTIMONIALS Here's what students have to say about the course Mrs E. Marriott UK “The Plaskett course in Weight Management Consultancy has been a really good introduction into the importance of nutrition and balancing food groups to make up a healthy diet plan for those who are obese and wishing to lose weight. It would be good if you want to do it for your own understanding or if you are looking for a step into a professional qualification or practicing yourself. The tutors communicate with you and give you detailed feedback on assignments and the work is achievable within a year, quicker if your apply yourself. There is a lot of information in the course surrounding basic nutrients, composition of foods and on how to set up and run your own practice”.