- Professional Development
- Medicine & Nursing
- Arts & Crafts
- Health & Wellbeing
- Personal Development
4 Data Modeling courses in Bradford
Business Process Modeling: In-House Training
By IIL Europe Ltd
Business Process Modeling: In-House Training This course is part of IIL's Business Analysis Certificate Program (BACP), a program designed to help prepare individuals pass the IIBA® Certification exam to become a Certified Business Analysis Professional (CBAP®). Learn more at www.iil.com/bacp A process model is a description of a process in terms of its steps or actions, the data flowing between them and participants in the process, machines, systems, and organizations involved. Modeling is a critical business analysis skill. It applies graphical and text communication techniques to describe the actions, objects, and relationships acted upon in the process and the steps that act upon them. This course teaches the technique of process modeling and ties together the core methods of process, behavior, and data modeling to enable business analysts to fully describe business processes in levels of detail from multiple perspectives. What you will Learn Upon completion, participants will be able to: Identify business processes and their components Work with UML diagrams Use process modeling in business diagramming Diagram and model business processes Foundation Concepts The role of the business analyst The IIBA® BABOK® Knowledge Areas Business Process Modeling (BPM) and the business analyst A practical approach to business process modeling The Context for Modeling Business Processes Overview of context for business process modeling Analyzing stakeholder information Modeling best practices Critical inputs for BPM: Business Rules Critical inputs for BPM: Context Diagrams Data Models Overview of data modeling Entity relationship diagrams Object-oriented approach Class diagrams Other data models Process Models - Part I (Non-UML) Overview of process modeling Data flow diagrams Workflow diagrams Flowcharts Process Models - Part II (UML) Overview of UML Process Models UML Activity Diagrams UML Sequence Diagrams Usage Models - Part I (Non-UML) Overview of usage modeling Prototyping options Static prototyping and storyboards Dynamic prototyping User Interface Design and user stories Usage Models - Part II (UML Use Cases) Overview of Use Cases Use Case diagrams Use Case descriptions Use Cases and the product life cycle Integrating the Models Overview of integrating the models General analysis best practices Specific analysis techniques summary Best practices for transition to design Summary and Next Steps What did we learn and how can we implement this in our work environments?

Data Science for Business Professionals
By Mpi Learning - Professional Learning And Development Provider
The ability to identify and respond to changing trends is a hallmark of a successful business. Whether those trends are related to customers and sales, or to regulatory and industry standards, businesses are wise to keep track of the variables that can affect the bottom line. In today's business landscape, data comes from numerous sources and in diverse forms.

Power BI Training
By FourSquare Innovations Ltd
FourSquare Training specialise in private, corporate Power BI courses delivered at your premises and tailored to your needs.
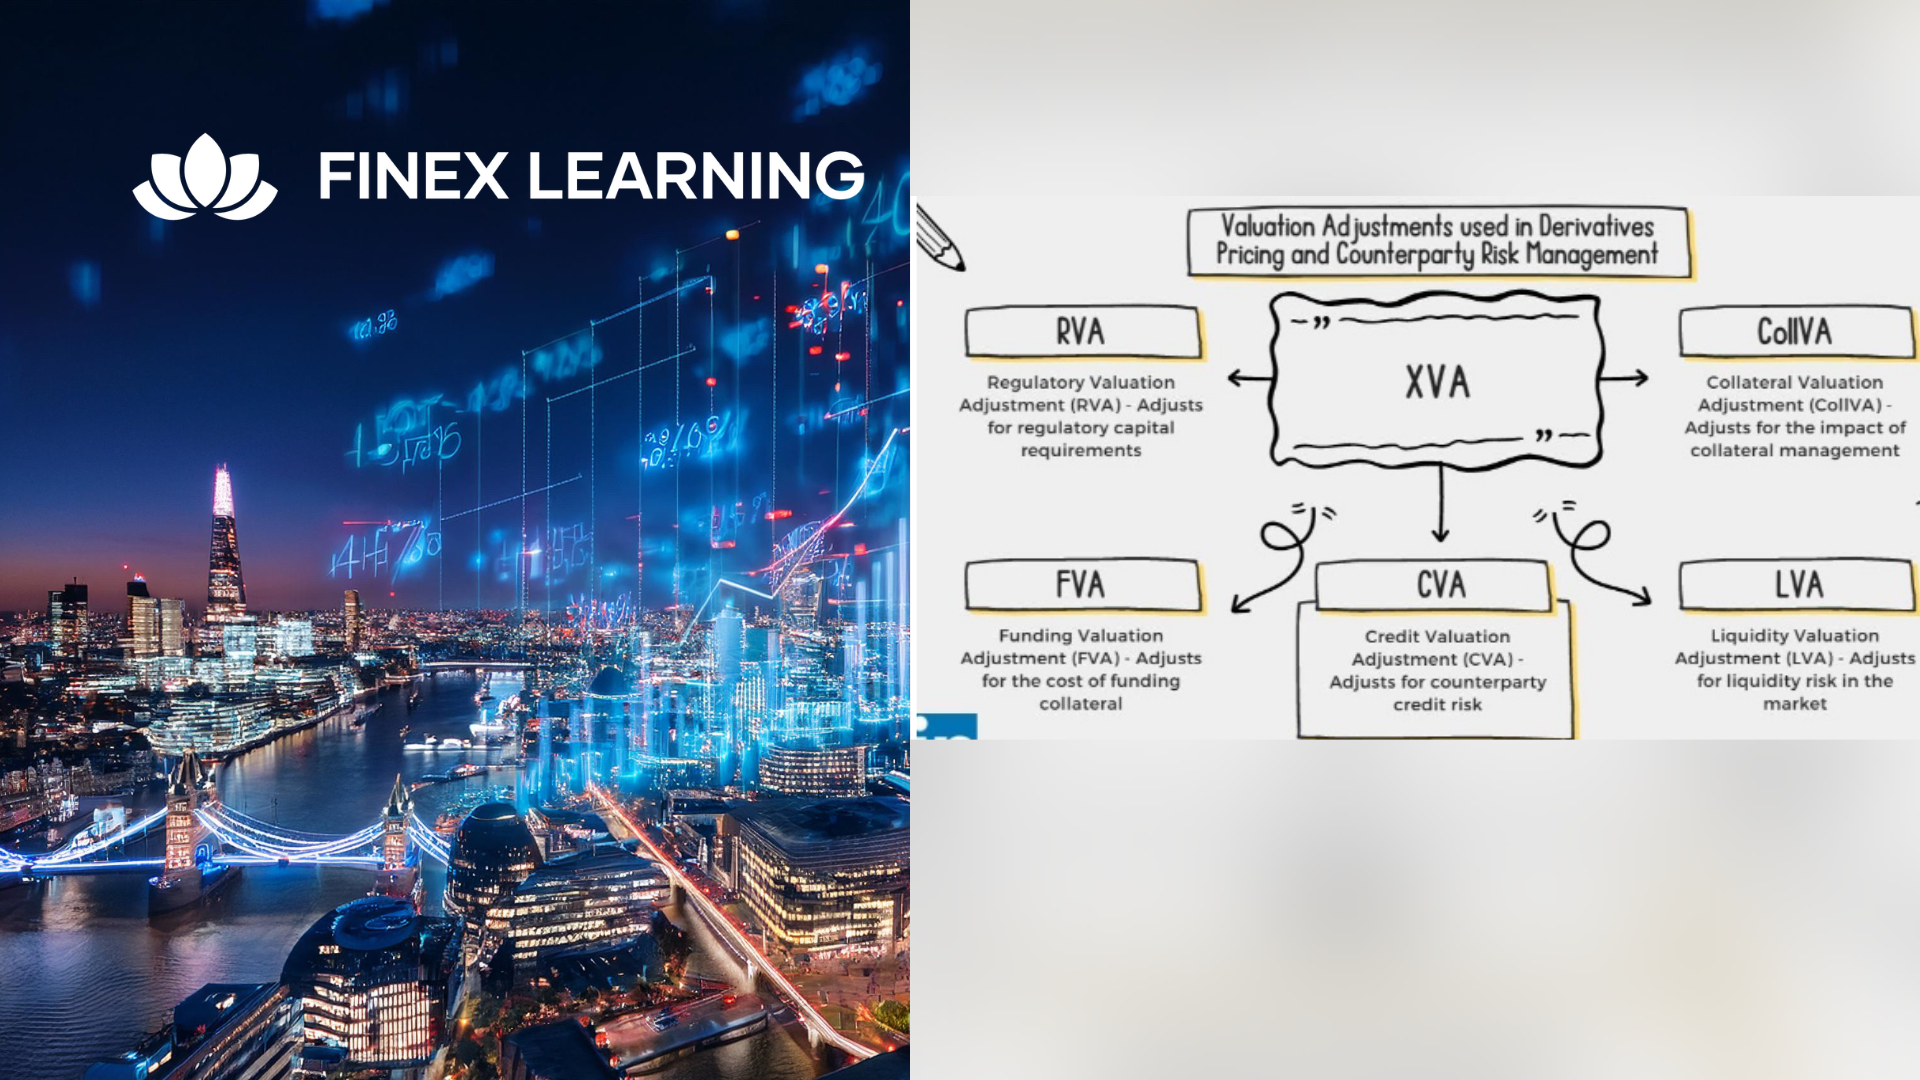
Overview This is a 2 day applied course on XVA for anyone interested in going beyond merely a conceptual understanding of XVA and wants practical examples of Monte Carlo simulation of market risk factors to create exposure distributions and profiles for derivatives used for XVA pricing Learn how to do Monte Carlo simulation of key market risk factors across major asset classes to create exposure distributions and profiles (with and without collateral) for derivatives used for XVA pricing. Learn how to calculate each XVA. Learn sensitivities of each XVA and how XVA desks manage these. Learn regulatory capital treatment of counterparty credit risk (both for CCR and CVA volatility) and how to stress test this within ICAAP or system-wide external, supervisor-led capital stress test. Who the course is for Anyone involved in OTC derivatives XVA traders XVA quants Derivatives traders and salespeople Risk management Treasury staff Internal audit and finance Course Content To learn more about the day by day course content please click here To learn more about schedule, pricing & delivery options, book a meeting with a course specialist now
Online Options
Show all 70
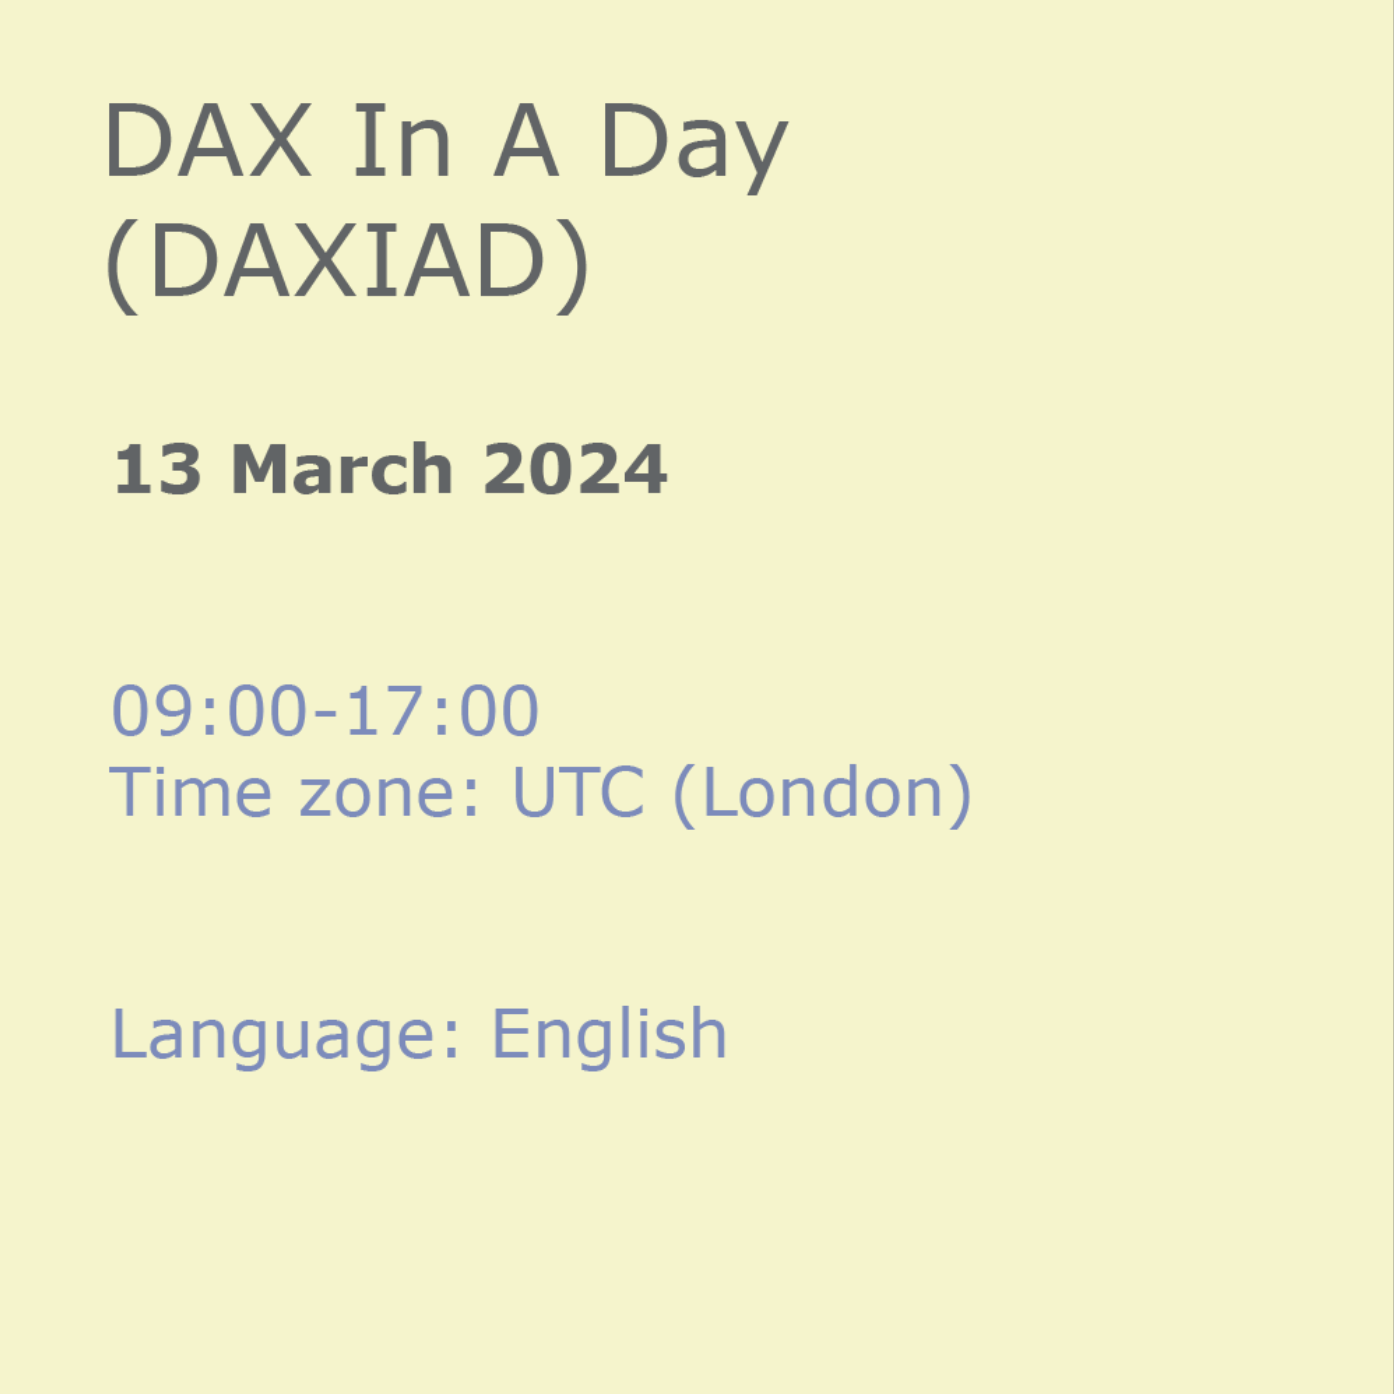
DAX In A Day (DAXIAD)
By Online Productivity Training
OVERVIEW Prerequisites—DIAD training and Advanced Data Modeling and Shaping training or equivalent working experience This course has been designed specifically for experienced model developers and gives a more advanced treatment of DAX formulas than either DIAD or the PL-300 course. We recommend that attendees have prior experience working with Power BI Desktop to create data models. During this course you will review: Writing DAX formulas. Defining calculated tables and columns. Defining measures. Using DAX iterator functions. Modifying filter context. Using DAX time intelligence functions. After completing this training, the attendees should be able to work with Data Analysis Expressions (DAX), perform calculations and define common business calculations for use in reports, address performance and functionality concerns. COURSE BENEFITS: Understand Analytic queries in Power BI Create calculated tables, calculated columns and measures Use DAX functions and operators to build DAX formulas Use DAX iterator functions Create formulas that manipulate the filter context Use DAX time intelligence functions WHO IS THE COURSE FOR? Analysts with experience of Power BI wishing to develop more advanced formulas in DAX Power BI developers who wish to deepen their understanding of the process of calculating formulas so as to make development faster and more reliable LAB OUTLINE Lab 1 Setup Connect to data and understand the objectives of the future labs Lab 2 Write DAX Formulas For Power BI Create a measure Use variables in the measure definition Lab 3 Add Calculated Table And Columns Duplicate a table Create a hierarchy Create a date table Add calculated columns Lab 4 Add Measures To Power BI Desktop Models Add an implicit measure to a report Add an explicit measure Add a compound measure Add a quick measure Lab 5 Use DAX Iterator Functions In A Power BI Desktop Model Complex summarization Higher grain summarization Create ranking measure Lab 6 Modify DAX Filter Context In Power BI Desktop Models Apply Boolean expression filter Remove filters: use ALL Remove filters: use AllSelected Preserve filters: use KeepFilters HASONEVALUE ISINSCOPE Context transition Lab 7 Use DAX Time Intelligence Functions In Power BI Desktop Models TOTALYTD SAMEPERIODLASTYEAR Calculate new occurrences Snapshot calculations
Business Process Modeling: Virtual In-House Training
By IIL Europe Ltd
Business Process Modeling: Virtual In-House Training This course is part of IIL's Business Analysis Certificate Program (BACP), a program designed to help prepare individuals pass the IIBA® Certification exam to become a Certified Business Analysis Professional (CBAP®). Learn more at www.iil.com/bacp A process model is a description of a process in terms of its steps or actions, the data flowing between them and participants in the process, machines, systems, and organizations involved. Modeling is a critical business analysis skill. It applies graphical and text communication techniques to describe the actions, objects, and relationships acted upon in the process and the steps that act upon them. This course teaches the technique of process modeling and ties together the core methods of process, behavior, and data modeling to enable business analysts to fully describe business processes in levels of detail from multiple perspectives. What you will Learn Upon completion, participants will be able to: Identify business processes and their components Work with UML diagrams Use process modeling in business diagramming Diagram and model business processes Foundation Concepts The role of the business analyst The IIBA® BABOK® Knowledge Areas Business Process Modeling (BPM) and the business analyst A practical approach to business process modeling The Context for Modeling Business Processes Overview of context for business process modeling Analyzing stakeholder information Modeling best practices Critical inputs for BPM: Business Rules Critical inputs for BPM: Context Diagrams Data Models Overview of data modeling Entity relationship diagrams Object-oriented approach Class diagrams Other data models Process Models - Part I (Non-UML) Overview of process modeling Data flow diagrams Workflow diagrams Flowcharts Process Models - Part II (UML) Overview of UML Process Models UML Activity Diagrams UML Sequence Diagrams Usage Models - Part I (Non-UML) Overview of usage modeling Prototyping options Static prototyping and storyboards Dynamic prototyping User Interface Design and user stories Usage Models - Part II (UML Use Cases) Overview of Use Cases Use Case diagrams Use Case descriptions Use Cases and the product life cycle Integrating the Models Overview of integrating the models General analysis best practices Specific analysis techniques summary Best practices for transition to design Summary and Next Steps What did we learn and how can we implement this in our work environments?
Business Process Modeling - Diagramming the Business Problem and Solution: On-Demand
By IIL Europe Ltd
Business Process Modeling - Diagramming the Business Problem and Solution This course teaches the technique of process modeling and ties together the core methods of process, behavior, and data modeling to enable business analysts to fully describe business processes in levels of detail from multiple perspectives.
Power BI: Dashboard in a Day
By Nexus Human
Duration 1 Days 6 CPD hours This course is intended for The Power BI in a Day course is designed for beginners and intermediate users of Power BI. Overview #NAME? Students will discover the full capabilities of Power BI in a one-day, hands-on workshop. Please Note: This workshop is primarily self-directed and students will work at their own pace while having access to an instructor for questions. 1 - Accessing & Preparing data Data Set Power BI Desktop Power BI Desktop ? Accessing Data Power BI Desktop ? Data Preparation 2 - Data Modeling and Exploration Power BI Desktop ? Data Modeling and Exploration Power BI Desktop ? Data Exploration Continued References 3 - Data Visualization Power BI Desktop Power BI Desktop ? Data Visualization References 4 - Publishing & Accessing Reports Power BI Desktop ? Creating Mobile View Power BI Service Power BI Service ? Publishing Report Power BI Mobile ? Accessing Report on Mobile Device Power BI Service ? Collaboration and Distribution References 5 - Dashboard and Collaboration Power BI Service Building Dashboard References Additional course details: Nexus Humans Power BI: Dashboard in a Day training program is a workshop that presents an invigorating mix of sessions, lessons, and masterclasses meticulously crafted to propel your learning expedition forward. This immersive bootcamp-style experience boasts interactive lectures, hands-on labs, and collaborative hackathons, all strategically designed to fortify fundamental concepts. Guided by seasoned coaches, each session offers priceless insights and practical skills crucial for honing your expertise. Whether you're stepping into the realm of professional skills or a seasoned professional, this comprehensive course ensures you're equipped with the knowledge and prowess necessary for success. While we feel this is the best course for the Power BI: Dashboard in a Day course and one of our Top 10 we encourage you to read the course outline to make sure it is the right content for you. Additionally, private sessions, closed classes or dedicated events are available both live online and at our training centres in Dublin and London, as well as at your offices anywhere in the UK, Ireland or across EMEA.

PL-600T00 Power Platform Solution Architect
By Nexus Human
Duration 3 Days 18 CPD hours This course is intended for Senior Consultants (both functional and technical) that aspire to be Solution Architects, or current Solution Architects that are new to the role. The Solution Architect is responsible for the successful design, implementation, deployment and adoption of an overall solution. The Solution Architect ensures that the solution meets the customer?s needs now and in the future. In this course, students will learn about decisions a Solution Architect makes during an implementation, covering security, integrations, Power Apps architecture, Power Automate architecture, and more. This course is designed to give you an introduction to the Solution Architect role. Becoming a Solution Architect/Getting to know your customer Define a Solution Architect Role of a Solution Architect on projects Project Methodology Getting to know your customer Group exercise - Getting to know your customer Conceptualizing the design from requirements How to lead the requirement collection effort Using fit gap analysis Pillars of good architecture Blueprinting the solution architecture Group exercise - Design from requirements Project governance and working as a team Solution Architect's role in project governance Techniques for keeping a project on track Scenarios that could cause a project to fail Group exercise - Project governance and working as a team Power Platform Architecture Key Power Platform architecture components Understand how platform design and limits influence solution architectures Updates and feature releases Understand how to communicate how the platform meets customer needs Data Modeling Data model influences Data model strategy Data types Data relationships Group exercise - Data modeling Analytics and artificial intelligence Planning and evaluating requirements Operational reporting Power BI Enterprise BI Pre-built insights and custom AI Power Apps Architecture Discuss options for apps and how to choose where to start Discuss app composition options Using components as part of your app architecture Considerations for including Portals as an app in your architecture Group exercise - Power Apps Architecture topics Application Lifecycle Management (ALM) Microsoft vision and Solution Architect's role in ALM Environment strategies Defning a solution structure for your deliverable Power Automate Architecture Discuss options for automation and custom logic Review considerations for using triggers and common actions Explore using Business Process Flows (BPF) to guide users through business processes Group Exercise - Evaluate scenarios for Power Automate usage Security Modeling Solution Architect's role in security modeling Discovery and learning your client's environment Controlling access to environments and resources Controlling access to CDS Data Group Exercise - Security Modeling Integration Solution Architects role in Integrations What is an integration and why do we need it Platform features that enable integration CDS Event Publishing Scenarios for group discussion Dynamics 365 Applications Architecture Solution Architect's role when deploying Dynamics 365 apps Architecture Considerations for primary apps Group Exercise - App specific working groups evaluate requirements Power Virtual Agents architecture Introduction Chatbot options Chatbot concepts Best practices Integrate chatbots Power Virtual Agents in Microsoft Teams Robotic Process Automation Introduction Power Automate Desktop Recording and editing tasks Running desktop flows Process advisor Testing and Go Live Solution Architect's role with testing and go live Planning for testing Planning for go live
Power BI Tips and Tricks (Includes Time-Saving ChatGPT Prompts)
By Packt
This compact crash course teaches learners to optimize their Microsoft Power BI use, gain insights into circular dependency errors and the new DAX functions, and use Power BI template files to enhance data modeling/analysis. The course provides guidance and real-world examples to streamline Power BI projects and achieve data visualization goals effectively.
55315: Introduction to SQL Databases
By Nexus Human
Duration 3 Days 18 CPD hours This course is intended for The primary audience for this course is people who are moving into a database role, or whose role has expanded to include database technologies. Developers that deliver content from SQL Server databases will also benefit from this material. Overview After completing this course, you will be able to: Describe key database concepts in the context of SQL Server Describe database languages used in SQL Server Describe data modelling techniques Describe normalization and denormalization techniques Describe relationship types and effects in database design Describe the effects of database design on performance Describe commonly used database objects This course is provided as an introductory class for anyone getting started with databases. It will be useful to programmers and other IT professionals whose job roles are expanding into database management. Students will learn fundamental database concepts through demonstrations and hands-on labs on a SQL Server instance. This material updates and replaces course Microsoft course 10985 which was previously published under the same title. Module 1: Introduction to databases Introduction to Relational Databases Other Databases and Storage Data Analysis SQL Server Database Languages Module 2: Data Modeling Data Modelling Designing a Database Relationship Modeling Module 3: Normalization Fundamentals of Normalization Normal Form Denormalization Module 4: Relationships Introduction to Relationships Planning Referential Integrity Module 5: Performance Indexing Query Performance Concurrency Module 6: Database Objects Tables Views Stored Procedures, Triggers and Functions
Introduction to Cassandra (TTDS6776)
By Nexus Human
Duration 3 Days 18 CPD hours Overview The goal of this course is to enable technical students new to Cassandra to begin working with Cassandra in an optimal manner. Throughout the course students will learn to: Understand the Big Data needs that C* addresses Be familiar with the operation and structure of C* Be able to install and set up a C* database Use the C* tools, including cqlsh, nodetool, and ccm (Cassandra Cluster Manager) Be familiar with the C* architecture, and how a C* cluster is structured Understand how data is distributed and replicated in a C* cluster Understand core C* data modeling concepts, and use them to create well-structured data models Be familiar with the C* eventual consistency model and use it intelligently Be familiar with consistency mechanisms such as read repair and hinted handoff Understand and use CQL to create tables and query for data Know and use the CQL data types (numerical, textual, uuid, etc.) Be familiar with the various kinds of primary keys available (simple, compound, and composite primary keys) Be familiar with the C* write and read paths Understand C* deletion and compaction The Cassandra (C*) database is a massively scalable NoSQL database that provides high availability and fault tolerance, as well as linear scalability when adding new nodes to a cluster. It has many powerful capabilities, such as tunable and eventual consistency, that allow it to meet the needs of modern applications, but also introduce a new paradigm for data modeling that many organizations do not have the expertise to use in the best way.Introduction to Cassandra is a hands-on course designed to teach attendees the basics of how to create good data models with Cassandra. This technical course has a focus on the practical aspects of working with C*, and introduces essential concepts needed to understand Cassandra, including enough coverage of internal architecture to make good decisions. It is hands-on, with labs that provide experience in core functionality. Students will also explore CQL (Cassandra Query Language), as well as some of the ?anti-patterns? that lead to non-optimal C* data models and be ready to work on production systems involving Cassandra. Session 1: Cassandra Overview Why We Need Cassandra - Big Data Challenges vs RDBMS High level Cassandra Overview Cassandra Features Optional: Basic Cassandra Installation and Configuration Session 2: Cassandra Architecture and CQL Overview Cassandra Architecture Overview Cassandra Clusters and Rings Nodes and Virtual Nodes Data Replication in Cassandra Introduction to CQL Defining Tables with a Single Primary Key Using cqlsh for Interactive Querying Selecting and Inserting/Upserting Data with CQL Data Replication and Distribution Basic Data Types (including uuid, timeuuid) Session 3: Data Modeling and CQL Core Concepts Defining a Compound Primary Key CQL for Compound Primary Keys Partition Keys and Data Distribution Clustering Columns Overview of Internal Data Organization Overview of Other Querying Capabilities ORDER BY, CLUSTERING ORDER BY, UPDATE , DELETE, ALLOW FILTERING Batch Queries Data Modeling Guidelines Denormalization Data Modeling Workflow Data Modeling Principles Primary Key Considerations Composite Partition Keys Defining with CQL Data Distribution with Composite Partition Key Overview of Internal Data Organization Session 4: Additional CQL Capabilities Indexing Primary/Partition Keys and Pagination with token() Secondary Indexes and Usage Guidelines Cassandra collections Collection Structure and Uses Defining and Querying Collections (set, list, and map) Materialized View Overview Usage Guidelines Session 5: Data Consistency In Cassandra Overview of Consistency in Cassandra CAP Theorem Eventual (Tunable) Consistency in C* - ONE, QUORUM, ALL Choosing CL ONE Choosing CL QUORUM Achieving Immediate Consistency Overview of Other Consistency Levels Supportive Consistency Mechanisms Writing / Hinted Handoff Read Repair Nodetool repair Session 6: Internal Mechanisms Ring Details Partitioners Gossip Protocol Snitches Write Path Overview / Commit Log Memtables and SSTables Write Failure Unavailable Nodes and Node Failure Requirements for Write Operations Read Path Overview Read Mechanism Replication and Caching Deletion/Compaction Overview Delete Mechanism Tombstones and Compaction Session 7: Working with IntelliJ Configuring JDBC Data Source for Cassandra Reading Schema Information Querying and Editing Tables. Additional course details: Nexus Humans Introduction to Cassandra (TTDS6776) training program is a workshop that presents an invigorating mix of sessions, lessons, and masterclasses meticulously crafted to propel your learning expedition forward. This immersive bootcamp-style experience boasts interactive lectures, hands-on labs, and collaborative hackathons, all strategically designed to fortify fundamental concepts. Guided by seasoned coaches, each session offers priceless insights and practical skills crucial for honing your expertise. Whether you're stepping into the realm of professional skills or a seasoned professional, this comprehensive course ensures you're equipped with the knowledge and prowess necessary for success. While we feel this is the best course for the Introduction to Cassandra (TTDS6776) course and one of our Top 10 we encourage you to read the course outline to make sure it is the right content for you. Additionally, private sessions, closed classes or dedicated events are available both live online and at our training centres in Dublin and London, as well as at your offices anywhere in the UK, Ireland or across EMEA.
