- Professional Development
- Medicine & Nursing
- Arts & Crafts
- Health & Wellbeing
- Personal Development
51908 Courses
Structural Interpretation of Seismic Data
By EnergyEdge - Training for a Sustainable Energy Future
Enhance your skills in structural interpretation of seismic data with EnergyEdge's comprehensive classroom training course. Sign up now!
Applied E&P Economics – Commercial Decisions & Fiscal Systems
By EnergyEdge - Training for a Sustainable Energy Future
Enhance your knowledge in applied EP economics and commercial decisions with EnergyEdge course. Enroll now to secure a spot in our course.

Petroleum Risk Analysis & Portfolio Management
By EnergyEdge - Training for a Sustainable Energy Future
Elevate your knowledge in petroleum risk analysis and portfolio management with Energyedge. Sign up with us today!

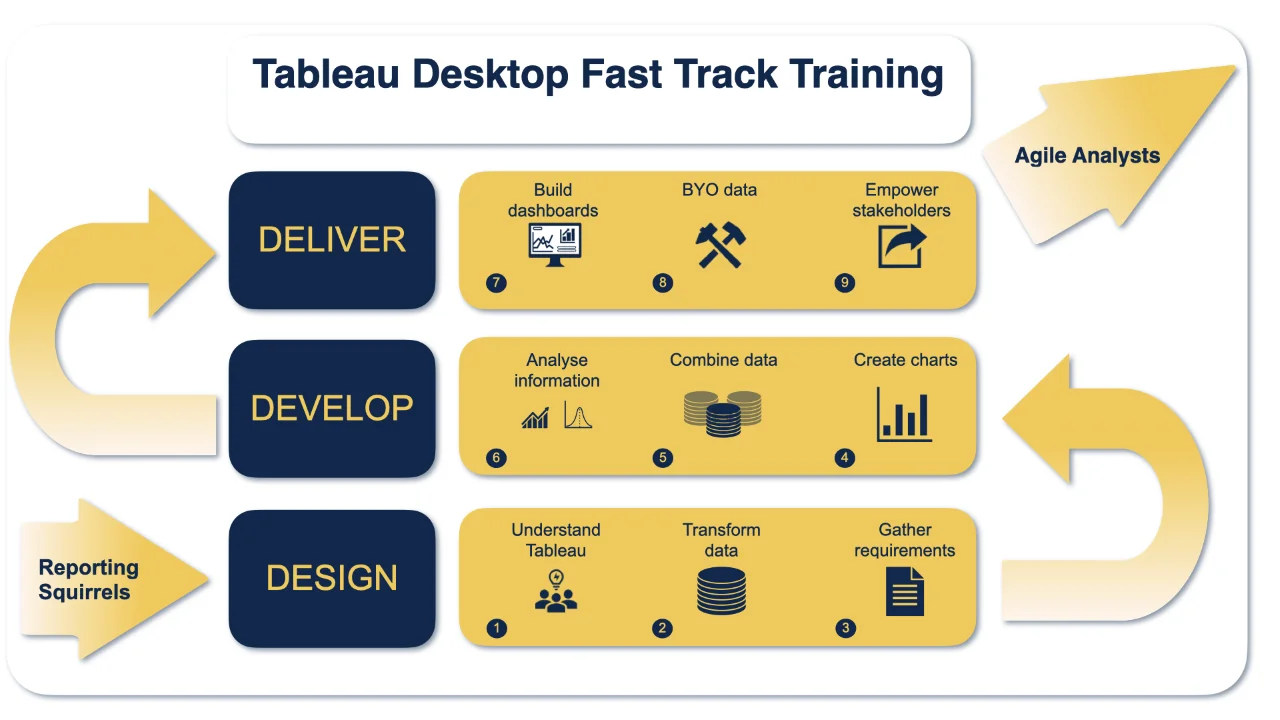
Tableau Training On Tap - Fast Track
By Tableau Training Uk
Tableau is an intuitive and simple tool to learn. This Tableau training course is a jumpstart to getting report writers and analysts who are self-taught or have no previous knowledge to being productive. It covers everything from connecting to data, through to creating interactive dashboards with a range of visualisations in three days. Having a quick turnaround from starting to use Tableau, to getting real, actionable insights means that you get a swift return on your investment. At the end of this course, you will be able to communicate insights more effectively, enabling your organisation to make better decisions, quickly. This accelerated approach is key to getting engagement from within your organisation so everyone can immediately see and feel the impact of the data and insights you create. Our Tableau Desktop Fast Track course combines all of our Foundation (Fundamentals) and Analyst (Intermediate) content into a 3 day live online course with added access to online bonus content of 3 additional modules. Gathering Requirements, Bring Your Own Data and Engaging Users. What do you get? This course is delivered live virtually and has all material provided through our online portal, together with email support and live coaching sessions. The full program includes all of the following elements: 3 days of live and interactive instructor-led sessions delivered by an expert Tableau Trainer 6 weeks access to our live coaching program delivered by expert Tableau coaches 50+ practical exercises to practice what you learn 12 months access to video’s that walk you through the theory and exercise solutions Practical advice, tools and resources for using Tableau in the real world The three additional online modules provide:Clarity on the approach to gathering dashboard requirements in a way that can be translated into dashboard designs.An agile and iterative development process that delivers products that meet user needs more quickly and effectively.An understanding of how end users will interact with dashboards to ensure that designers deliver actionable results. THE SYLLABUS PHASE 1: DESIGN MODULE 1: UNDERSTAND TABLEAU What is possible How does Tableau deal with data Know your way around Review of Type Conversions How do we format charts Dashboard basics – My first Dashboard MODULE 2: TRANSFORM DATA Connecting to and setting up data in Tableau Modifying data attributes How Do I Structure my Data – Groups & Hierarchies, Visual Groups How Tableau Deals with Dates – Using Discrete and Continuous Dates, Custom Dates How do I create calculated fields and why? – Creating Calculated Fields, Types of calculated fields, Row Level v Aggregations, Aggregating dimensions in calculations, Changing the Level of Detail (LOD) of calculations – What, Why, How MODULE 3: GATHER REQUIREMENTS(ONLINE CONTENT ONLY) Brainstorm and assess possible priorities Pitfalls to avoid Gather requirements PHASE 2: DEVELOP MODULE 4: CREATE CHARTS Charts that Compare Multiple Measures – Measure Names and Measure Values, Shared Axis Charts, Dual Axis Charts, Scatter Plots Showing progress over time Creating Tables – Creating Tables, Highlight Tables, Heat Maps Showing Relational & Proportional Data – Pie Charts, Donut Charts, Tree Maps Making things dynamic with parameters MODULE 5: COMBINE DATA Relationships Joining Tables – Join Types, Joining tables within the same database, cross database joins, join calculations Blending – How to create a blend with common fields, Custom defined Field relationships and mismatched element names, Calculated fields in blended data sources Unions – Manual Unions and mismatched columns, Wildcard unions Data Extracts – Creating & Editing Data extracts MODULE 6: ANALYSE INFORMATION Table Calculations Sets, Reference Lines, Trends and Forecasting Answering spatial questions – Mapping, Creating a choropleth (filled) map, Using your own images for spatial analysis, Mapping with spatial files Advanced charts Bar in Bar charts Bullet graphs Creating Bins and Histograms Creating a Box & Whisker plot Viz in Tooltips PHASE 3: DESIGN MODULE 7: BUILD DASHBOARDS Using the Dashboard Interface Device layouts Dashboard Actions – Set actions, Parameter actions Viz in Tooltips for Dashboards Dashboard containers – Horizontal & Vertical containers, Hidden containers Navigate between dashboards Telling data driven stories MODULE 8: BRING YOUR OWN DATA Design Best Practices & Resources Wireframe templates Questions Process Start building and testing MODULE 9: EMPOWER STAKEHOLDERS What is Tableau Server Publishing & permissions How can your users engage with content The Tableau ecosystem Review your progress Your next steps HOW MUCH OF YOUR TIME WILL THIS TAKE? Delegates are also provided 6 weeks access to our Tableau Coaching. We run Live Q&A sessions from 4pm-5pm on a Monday (Connecting to Data and Calculated Fields), 2pm-3pm Friday (Creating Charts) & 4pm-5pm Friday (Dashboard Design). The coaching helps delegates to transition from the theory of using Tableau to its practical use. We’d be expecting them to apply the exercises you’ll be doing during the course, onto your own data after the course. In our experience, this is the best way to increase both understanding and long term memory retention. The live coaching also acts as a troubleshooting platform for any practical issues that delegates need to overcome in the real world. Delegates also have 12 months access to all of the training material covered in the course in the form of an online portal (this includes theory videos, exercise solution videos, exercise materials and even quizzes). We have a growing LinkedIn community that delegates are encouraged to join and participate in. We regularly post useful blog posts and additional training that will enhance the Tableau journey and understanding. We help teams using Tableau to transform in the following ways : From a disjointed understanding of Tableau – To being familiar with Tableau terminology and capability From ad-hoc data uploads and error prone calculations – To reusable data connections and robust metrics From disjointed stakeholder questions – To clear and concise requirements that lead to decision making From being unsure how difficult Tableau will be to learn – To being able to develop standard charts and tables in Tableau with dynamic reporting capabilities From manually combining data for each analytical task – To dynamically combining data from multiple tables for analysis From being unsure how to answer analytical questions and what options there are – To being equipped with multiple actionable, dynamic, analytical use cases From not knowing Why, When and How to create Dashboards or Story’s – To being able to combine analysis to answer complex questions and tell data driven stories From using demo data theory – To Delivering value [Answering questions] on their own data From spending lots of time answering colleagues ad-hoc (data) questions – To empowering stakeholders in answering ad-hoc queries and reducing the time to analyse and steer the business
ESG Reporting Frameworks & Industry Best Practices – Comprehensive Analysis & Latest Developments On ESG Reporting Standards
By EnergyEdge - Training for a Sustainable Energy Future
Join our classroom training course to gain expertise in ESG reporting frameworks and industry best practices. Take the first step towards success with EnergyEdge!

Layer of Protection Analysis (LOPA)
By EnergyEdge - Training for a Sustainable Energy Future
Take your knowledge to the next level with EnergyEdge course on Layer of Protection Analysis (LOPA). Enroll now to advance your career.

This Level 4 course aims to equip professionals with the knowledge about the skills and practical behaviours which are required for them to step into a leadership/management role. The demand for management roles is expected to grow in the coming years. This is due to a number of factors, including: The ageing population, which is leading to a shortage of skilled workers. The increasing complexity of businesses requires more managers to oversee operations. The growing importance of technology is creating new opportunities for managers to lead and innovate.

RFID training course description This training course focuses on the technologies used in Radio Frequency Identification (RFID). What will you learn Describe the RFID architecture. Design RFID systems. Evaluate tag types. Recognise common RFID problems. RFID training course details Who will benefit: RFID technologists and system engineers. Prerequisites: RF fundamentals. Duration 2 days RFID training course contents What is RFID? Review of RF basics, what is RFID, RFID history, RFID base system architecture, frequency bands used by RFID, comparison with barcodes. RFID applications Supply chain, asset tracking, theft reduction, retail, access control, tolls. Tags Tag features, types of tag, passive and active, chips, read only, read write, affixing tags, selecting location to affix a tag, tag orientation and location, tag stacking, impact of rate of movement, tag data formats. Interrogators/readers Interrogation zones, interrogator types, antennas, read distance tests, multiple interrogators, synchronisation, dense interrogator environment issues. RFID peripherals. Standards and regulations Global regulatory requirements, regional regulatory requirements, ISO, ETSI, FCC, EPC, safety regulations/issues. Testing and troubleshooting Read rate problems, improperly tagged items, tag failure. RFID system design Antenna types, interference, antenna location and spacing, how many antennas? How many interrogators? tag types, grounding considerations, cabling, site diagrams.
This is a post-graduate course composed of a TCM and Acupuncture Theory Foundation Module (9 lecture days) and a Special Orthopaedic Acupuncture Module (8 lecture days) with additional 4 clinical practice days and a re- validation day. The TCM and Acupuncture Theory foundation Module leads to a Foundation Diploma in TCM and Acupuncture Level-1. The Orthopaedic Acupuncture module is designed in such a way that it can either be completed as a whole, or each of the 8 lectures can be taken as a CPD unit for therapist with special interests in the specific areas of the body. The course is specifically designed as an advanced, intensive course for acupuncturists, physiotherapists, osteopaths, chiropractors and other physical therapists who wish to broaden their knowledge and further their skills. The emphasis of the course falls on the practical application of acupuncture as a treatment for a variety of MSK conditions.

MRTG training course description A hands on course focusing on the installation, configuration and use of the MRTG network monitoring and graphing tools. What will you learn Install MRTG. Configure MRTG. Use MRTG to monitor networks. MRTG training course details Who will benefit: Anyone working with MRTG. Prerequisites: Total SNMP for engineers Duration 2 days MRTG training course contents What is MRTG? Network monitoring, review of SNMP. What MRTG does do, what MRTG doesn't do, MRTG architecture, MRTG components. Hands on configuring SNMP support on network devices, configuring extended SNMP support on Windows. Installing MRTG Configuring MRTG tasks, .cfg files, index.html files, running MRTG tasks, instances. Hands on Configuring and running MRTG tasks. MRTG tasks Configuring MRTG tasks, .cfg files, index.html files, running MRTG tasks, instances. Hands on Configuring and running MRTG tasks. MRTG graphs Daily, weekly, monthly, yearly, MRTG database support, RRDTOOL. Hands on MRTG graphs. Using MRTG MRTG examples, custom SNMP OIDs, using the MRTG configuration reference. Hands on MRTG examples. RRDTOOL Installing RRD database support, MRTG instances with the RRD database, RRD database structure, resizing and extending the database. Exporting database records into plain text and XML formats, on demand MRTG graphs using the database. Hands on Using MRTG with RRD database support. Alternatives to MRTG MRTG strengths and weaknesses, scalability, cricket, cacti, other SNMP tools.