- Professional Development
- Medicine & Nursing
- Arts & Crafts
- Health & Wellbeing
- Personal Development
2209 Spa courses in Cardiff delivered Live Online
Live, Love, Parent. A Guide To Smiling Through The Challenges And Enjoying Your Family Time.
By Happy Human Training
A workshop for parents about their experience of parenting. A chance to press pause and reflect, share and laugh whilst re-connecting with what it's all about and what really matters. No advice, just support and care for those on the journey.

When Life Gives You Lemons...
By Happy Human Training
A webinar about the simple stuff and how it can help get you through when everything else feels too tough.

LEVEL 2: BUILDING BRIDGES OF EMPATHY: THE SIX STAGES FRAMEWORK BOOK CLUB
By Six Stages Diversity Framework
This seminar supports you to implement ideas from the Six Stages Framework. It is designed for those who are reading or have read my book Understanding and Dealing with Everyday Racism- The Six Stages Framework

Clinical Coach Standardisation Event July 2025
By Samantha Morgan-Hourd
Clinical coach standardisation events

Tableau Desktop Training - Analyst
By Tableau Training Uk
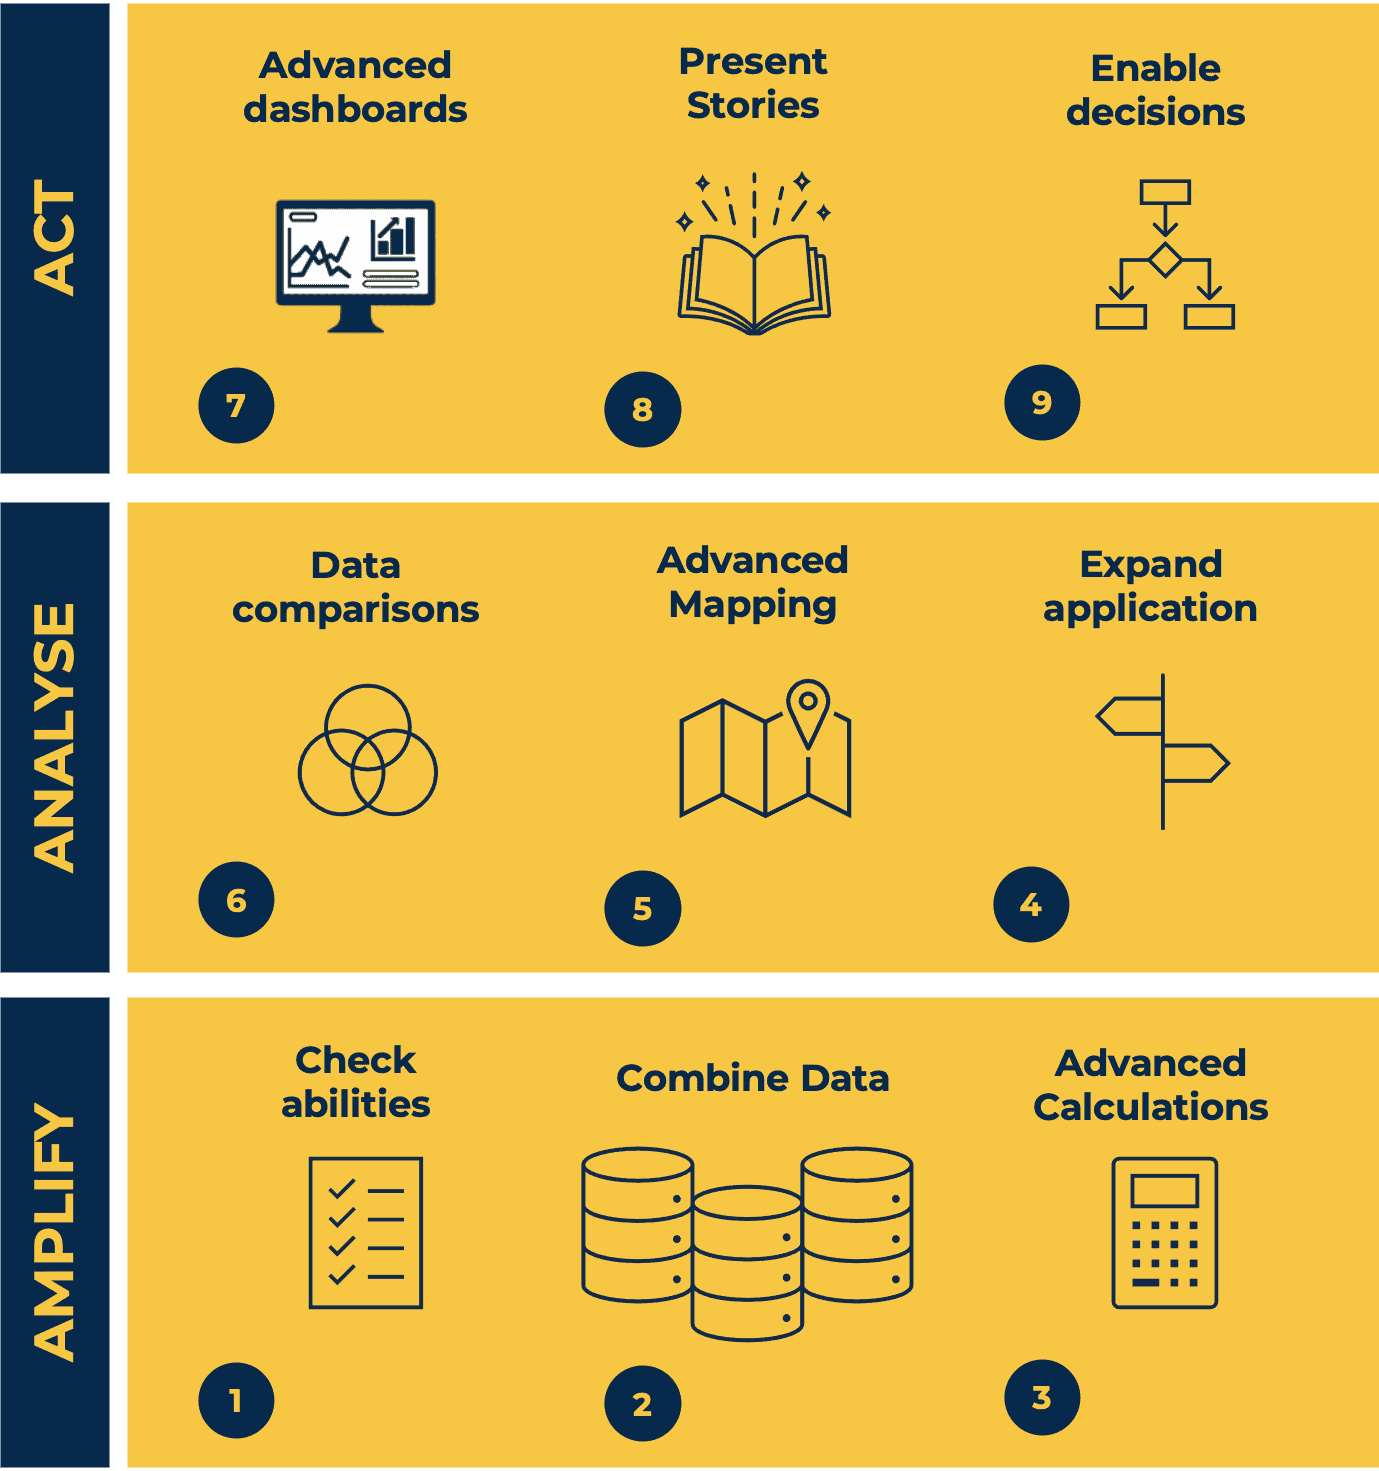
This Tableau Desktop Training intermediate course is designed for the professional who has a solid foundation with Tableau and is looking to take it to the next level. For Private options, online or in-person, please send us details of your requirements: This Tableau Desktop training intermediate course is designed for the professional who has a solid foundation with Tableau and is looking to take it to the next level. Attendees should have a good understanding of the fundamental concepts of building Tableau worksheets and dashboards typically achieved from having attended our Tableau Desktop Foundation Course. At the end of this course you will be able to communicate insights more effectively, enabling your organisation to make better decisions, quickly. The Tableau Desktop Analyst training course is aimed at people who are used to working with MS Excel or other Business Intelligence tools and who have preferably been using Tableau already for basic reporting. The course is split into 3 phases and 9 modules: Phase 1: AMPLIFY MODULE 1: CHECK ABILITIES Revision – What I Should Know What is possibleHow does Tableau deal with dataKnow your way aroundHow do we format chartsHow Tableau deals with datesCharts that compare multiple measuresCreating Tables MODULE 2: COMBINE DATA Relationships Joining Tables – Join Types, Joining tables within the same database, cross database joins, join calculations Blending – How to create a blend with common fields, Custom defined Field relationships and mismatched element names, Calculated fields in blended data sources Unions – Manual Unions and mismatched columns, Wildcard unions Data Extracts – Creating & Editing Data extracts MODULE 3: ADVANCED CALCULATIONS Row Level v Aggregations Aggregating dimensions in calculations Changing the Level of Detail (LOD) of calculations – What, Why, How Adding Table Calculations Phase 2: ANALYSE MODULE 4: EXPAND APPLICATION Making things dynamic with parameters Sets Trend Lines How do we format charts Forecasting MODULE 5: ADVANCED MAPPING Using your own images for spatial analysis Mapping with Spatial files MODULE 6: DATA COMPARISONS Advanced Charts Bar in Bar charts Bullet graphs Creating Bins and Histograms Creating a Box & Whisker plot Phase 3: ACT MODULE 7: ADVANCED DASHBOARDS Using the dashboard interface and Device layout Dashboard Actions and Viz In tooltips Horizontal & Vertical containers Navigate between dashboards MODULE 8: PRESENT STORIES Telling data driven stories MODULE 9: ENABLE DECISIONS What is Tableau Server Publishing & Permissions How can your users engage with content This training course includes over 25 hands-on exercises and quizzes to help participants “learn by doing” and to assist group discussions around real-life use cases. Each attendee receives a login to our extensive training portal which covers the theory, practical applications and use cases, exercises, solutions and quizzes in both written and video format. Students must bring their own laptop with an active version of Tableau Desktop 2018.2 (or later) pre-installed. What People Are Saying About This Course “Course was fantastic, and completely relevant to the work I am doing with Tableau. I particularly liked Steve’s method of teaching and how he applied the course material to ‘real-life’ use-cases.”Richard W., Dashboard Consulting Ltd “This course was extremely useful and excellent value. It helped me formalise my learning and I have taken a lot of useful tips away which will help me in everyday work.” Lauren M., Baillie Gifford “I would definitely recommend taking this course if you have a working knowledge of Tableau. Even the little tips Steve explains will make using Tableau a lot easier. Looking forward to putting what I’ve learned into practice.”Aron F., Grove & Dean “Steve is an excellent teacher and has a vast knowledge of Tableau. I learned a huge amount over the two days that I can immediately apply at work.”John B., Mporium “Steve not only provided a comprehensive explanation of the content of the course, but also allowed time for discussing particular business issues that participants may be facing. That was really useful as part of my learning process.”Juan C., Financial Conduct Authority “Course was fantastic, and completely relevant to the work I am doing with Tableau. I particularly liked Steve’s method of teaching and how he applied the course material to ‘real-life’ use-cases.”Richard W., Dashboard Consulting Ltd “This course was extremely useful and excellent value. It helped me formalise my learning and I have taken a lot of useful tips away which will help me in everyday work.” Lauren M., Baillie Gifford “I would definitely recommend taking this course if you have a working knowledge of Tableau. Even the little tips Steve explains will make using Tableau a lot easier. Looking forward to putting what I’ve learned into practice.”Aron F., Grove & Dean “Steve is an excellent teacher and has a vast knowledge of Tableau. I learned a huge amount over the two days that I can immediately apply at work.”John B., Mporium
Building services and maintenance - introduction (In-House)
By The In House Training Company
To provide a fundamental understanding of building services in the context of: The working environment The success of the core business The health and safety of the occupants Operating cost and environmental impact The optimisation of cost and value Strategies for continuous improvement DAY ONE 1 Building services fundamentals The function of services in commercial buildings and their importance to the core businessElectrical servicesLightingHeatingVentilation and air conditioningLiftsWater Understanding IT and communication systems Practical exercises 2 The provision of comfort and safety Statutory requirementsHealth and safety legislationControl of contractorsRisk assessmentFire precautionsLegionella, sick building and other risks Business requirementsUnderstanding user requirementsMatching systems to business needs Practical exercises 3 Getting the design right What the FM needs to know about design and its procurementSuccessful space planningRelationship between services, space planning and designGetting the brief rightSupplier selection and management Practical exercises DAY TWO 4 Operation and maintenance Why maintain?Maintenance contractsInput and output specificationsResource optionsContracts - principal elementsTendering - key stepsSelection criteriaOperational criteriaMaintenance trends Performance-based service provisionInput and output specificationsKPIs and thresholdsRisk containmentValue-add opportunitiesPerformance contract strategy Practical exercises 5 Contingency planning Being ready for the unexpected Identifying and reducing riskInternal risksExternal risksIdentifying threats at your site Managing riskProtective systemsOccupier obligationsFire managementTesting Practical exercises 6 Commissioning services systems Physical commissioning Common problems Typical costs Commissioning stages Continuous commissioning Energy efficiency and the scope for environmental improvement Practical exercises 7 Satisfying the occupants Obtaining and responding to feedbackWhen to get feedbackWhyHowWhat to do with it Practical exercises 8 'Air time' Sharing experience and addressing specific issues of interest to participants Course review Close

Power BI - dashboards (1 day) (In-House)
By The In House Training Company
Power BI is a powerful data visualisation program that allows businesses to monitor data, analyse trends, and make decisions. This course is designed to provide a solid understanding of the reporting side of Power BI, the dashboards, where administrators, and end users can interact with dynamic visuals that communicates information. This course focuses entirely on the creation and design of visualisations in dashboards, including a range of chart types, engaging maps, and different types of tables. Designing dashboards with KPI's (key performance indicators), heatmaps, flowcharts, sparklines, and compare multiple variables with trendlines. This one-day programme focuses entirely on creating dashboards, by using the many visualisation tools available in Power BI. You will learn to build dynamic, user-friendly interfaces in both Power BI Desktop and Power BI Service. 1 Introduction Power BI ecosystem Things to keep in mind Selecting dashboard colours Importing visuals into Power BI Data sources for your analysis Joining tables in Power BI 2 Working with data Utilising a report theme Table visuals Matrix visuals Drilling into hierarchies Applying static filters Group numbers with lists Group numbers with bins 3 Creating visuals Heatmaps in Power BI Visualising time-intelligence trends Ranking categorical totals Comparing proportions View trends with sparklines 4 Comparing variables Insert key performance indicators (KPI) Visualising trendlines as KPI Forecasting with trendlines Visualising flows with Sankey diagrams Creating a scatter plot 5 Mapping options Map visuals Using a filled map Mapping with latitude and longitude Mapping with ArcGIS or ESRI 6 Creating dashboards High-level dashboard Migration analysis dashboard Adding slicers for filtering Promote interaction with nudge prompts Searching the dashboard with a slicer Creating dynamic labels Highlighting key points on the dashboard Customised visualisation tooltips Syncing slicers across pages 7 Sharing dashboards Setting up and formatting phone views Exporting data Creating PDF files Uploading to the cloud Share dashboards in SharePoint online
Effective Personal Leadership
By Leadership Management International (LMI) UK
Before you can effective lead others, you must first lead yourself. This 12 module program will help you develop in the following areas: Self Knowledge & Emotional Intelligence Identifying your strengths and building on them Values and Personal Mission Statement Self-motivation and personal goals Taking personal responsibility Discovering your purpose Authentic leadership and influencing others

Tableau Desktop Training - Foundation
By Tableau Training Uk
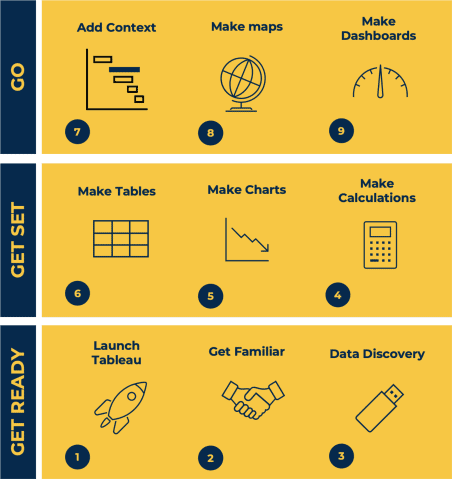
This Tableau Desktop Training course is a jumpstart to getting report writers and analysts with little or no previous knowledge to being productive. It covers everything from connecting to data, through to creating interactive dashboards with a range of visualisations in two days of your time. For Private options, online or in-person, please send us details of your requirements: This Tableau Desktop Training course is a jumpstart to getting report writers and analysts with little or no previous knowledge to being productive. It covers everything from connecting to data, through to creating interactive dashboards with a range of visualisations in two days of your time. Having a quick turnaround from starting to use Tableau, to getting real, actionable insights means that you get a swift return on your investment of time and money. This accelerated approach is key to getting engagement from within your organisation so everyone can immediately see and feel the impact of the data and insights you create. This course is aimed at someone who has not used Tableau in earnest and may be in a functional role, eg. in sales, marketing, finance, operations, business intelligence etc. The course is split into 3 phases and 9 modules: PHASE 1: GET READY MODULE 1: LAUNCH TABLEAU Check Install & Setup Why is Visual Analytics Important MODULE 2: GET FAMILIAR What is possible How does Tableau deal with data Know your way around How do we format charts Dashboard Basics – My First Dashboard MODULE 3: DATA DISCOVERY Connecting to and setting up data in Tableau How Do I Explore my Data – Filters & Sorting How Do I Structure my Data – Groups & Hierarchies, Visual Groups How Tableau Deals with Dates – Using Discrete and Continuous Dates, Custom Dates Phase 2: GET SET MODULE 4: MAKE CALCULATIONS How Do I Create Calculated Fields & Why MODULE 5: MAKE CHARTS Charts that Compare Multiple Measures – Measure Names and Measure Values, Shared Axis Charts, Dual Axis Charts, Scatter Plots Showing Relational & Proportional Data – Pie Charts, Donut Charts, Tree Maps MODULE 6: MAKE TABLES Creating Tables – Creating Tables, Highlight Tables, Heat Maps Phase 3: GO MODULE 7: ADD CONTEXT Reference Lines and Bands MODULE 8: MAKE MAPS Answering Spatial Questions – Mapping, Creating a Choropleth (Filled) Map MODULE 9: MAKE DASHBOARDS Using the Dashboard Interface Dashboard Actions This training course includes over 25 hands-on exercises and quizzes to help participants “learn by doing” and to assist group discussions around real-life use cases. Each attendee receives a login to our extensive training portal which covers the theory, practical applications and use cases, exercises, solutions and quizzes in both written and video format. Students must use their own laptop with an active version of Tableau Desktop 2018.2 (or later) pre-installed. What People Are Saying About This Course “Excellent Trainer – knows his stuff, has done it all in the real world, not just the class room.”Richard L., Intelliflo “Tableau is a complicated and powerful tool. After taking this course, I am confident in what I can do, and how it can help improve my work.”Trevor B., Morrison Utility Services “I would highly recommend this course for Tableau beginners, really easy to follow and keep up with as you are hands on during the course. Trainer really helpful too.”Chelsey H., QVC “He is a natural trainer, patient and very good at explaining in simple terms. He has an excellent knowledge base of the system and an obvious enthusiasm for Tableau, data analysis and the best way to convey results. We had been having difficulties in the business in building financial reports from a data cube and he had solutions for these which have proved to be very useful.”Matthew H., ISS Group
Working Safely - IOSH Award (In-House)
By The In House Training Company
A high-impact programme designed to be fun and to get people fully involved. The first-class, jargon-free content is based on what people need to know in practice, not off-putting legal language. This introductory course covers: Introducing Working Safely: Accidents can happen to anyone. The realities of the human suffering behind the statistics. The importance of personal responsibility. Defining hazard and risk: Focusing on the six broad hazard groups, participants are asked to think about the hazards and risks they come across in their own work. 'Risk assessment' demystified. Identifying common hazards: All the main issues - aggression and violence, asbestos, bullying, chemicals and harmful substances, computer workstations, confined spaces, drugs and alcohol, electricity, fire, getting in and out, height, housekeeping, lighting, manual handling, noise, personal hygiene, plant and machinery, slips and trips, stress, temperature, vehicles and transport, and welfare facilities. Improving safety performance: Bridging the gap between management and workforce, encouraging participants to play their part. Also covered: contract work, inspections, safe systems and permits, protective equipment, signage, emergency procedures, reporting and health checks.