- Professional Development
- Medicine & Nursing
- Arts & Crafts
- Health & Wellbeing
- Personal Development
811 Modeling courses
PL-300T00 Microsoft Power BI Data Analyst
By Nexus Human
Duration 3 Days 18 CPD hours This course is intended for The audience for this course are data professionals and business intelligence professionals who want to learn how to accurately perform data analysis using Power BI. This course is also targeted toward those individuals who develop reports that visualize data from the data platform technologies that exist on both in the cloud and on-premises. This course covers the various methods and best practices that are in line with business and technical requirements for modeling, visualizing, and analyzing data with Power BI. The course will show how to access and process data from a range of data sources including both relational and non-relational sources. Finally, this course will also discuss how to manage and deploy reports and dashboards for sharing and content distribution. Prerequisites Understanding core data concepts. Knowledge of working with relational data in the cloud. Knowledge of working with non-relational data in the cloud. Knowledge of data analysis and visualization concepts. DP-900T00 Microsoft Azure Data Fundamentals is recommended 1 - Discover data analysis Overview of data analysis Roles in data Tasks of a data analyst 2 - Get started building with Power BI Use Power BI Building blocks of Power BI Tour and use the Power BI service 3 - Get data in Power BI Get data from files Get data from relational data sources Create dynamic reports with parameters Get data from a NoSQL database Get data from online services Select a storage mode Get data from Azure Analysis Services Fix performance issues Resolve data import errors 4 - Clean, transform, and load data in Power BI Shape the initial data Simplify the data structure Evaluate and change column data types Combine multiple tables into a single table Profile data in Power BI Use Advanced Editor to modify M code 5 - Design a semantic model in Power BI Work with tables Create a date table Work with dimensions Define data granularity Work with relationships and cardinality Resolve modeling challenges 6 - Add measures to Power BI Desktop models Create simple measures Create compound measures Create quick measures Compare calculated columns with measures 7 - Add calculated tables and columns to Power BI Desktop models Create calculated columns Learn about row context Choose a technique to add a column 8 - Use DAX time intelligence functions in Power BI Desktop models Use DAX time intelligence functions Additional time intelligence calculations 9 - Optimize a model for performance in Power BI Review performance of measures, relationships, and visuals Use variables to improve performance and troubleshooting Reduce cardinality Optimize DirectQuery models with table level storage Create and manage aggregations 10 - Design Power BI reports Design the analytical report layout Design visually appealing reports Report objects Select report visuals Select report visuals to suit the report layout Format and configure visualizations Work with key performance indicators 11 - Configure Power BI report filters Apply filters to the report structure Apply filters with slicers Design reports with advanced filtering techniques Consumption-time filtering Select report filter techniques Case study - Configure report filters based on feedback 12 - Enhance Power BI report designs for the user experience Design reports to show details Design reports to highlight values Design reports that behave like apps Work with bookmarks Design reports for navigation Work with visual headers Design reports with built-in assistance Tune report performance Optimize reports for mobile use 13 - Perform analytics in Power BI Explore statistical summary Identify outliers with Power BI visuals Group and bin data for analysis Apply clustering techniques Conduct time series analysis Use the Analyze feature Create what-if parameters Use specialized visuals 14 - Create and manage workspaces in Power BI Distribute a report or dashboard Monitor usage and performance Recommend a development life cycle strategy Troubleshoot data by viewing its lineage Configure data protection 15 - Manage semantic models in Power BI Use a Power BI gateway to connect to on-premises data sources Configure a semantic model scheduled refresh Configure incremental refresh settings Manage and promote semantic models Troubleshoot service connectivity Boost performance with query caching (Premium) 16 - Create dashboards in Power BI Configure data alerts Explore data by asking questions Review Quick insights Add a dashboard theme Pin a live report page to a dashboard Configure a real-time dashboard Set mobile view 17 - Implement row-level security Configure row-level security with the static method Configure row-level security with the dynamic method Additional course details: Nexus Humans PL-300T00: Microsoft Power BI Data Analyst training program is a workshop that presents an invigorating mix of sessions, lessons, and masterclasses meticulously crafted to propel your learning expedition forward. This immersive bootcamp-style experience boasts interactive lectures, hands-on labs, and collaborative hackathons, all strategically designed to fortify fundamental concepts. Guided by seasoned coaches, each session offers priceless insights and practical skills crucial for honing your expertise. Whether you're stepping into the realm of professional skills or a seasoned professional, this comprehensive course ensures you're equipped with the knowledge and prowess necessary for success. While we feel this is the best course for the PL-300T00: Microsoft Power BI Data Analyst course and one of our Top 10 we encourage you to read the course outline to make sure it is the right content for you. Additionally, private sessions, closed classes or dedicated events are available both live online and at our training centres in Dublin and London, as well as at your offices anywhere in the UK, Ireland or across EMEA.

Fundamentals of Secure Software
By Packt
This course is complete training for someone who wants to join the security world and get familiar with most of the practices/risks and different areas, where they can invest to become experts. It covers both the 'admin' side of how to develop the processes and program around it as well as an insight into the technical aspects.
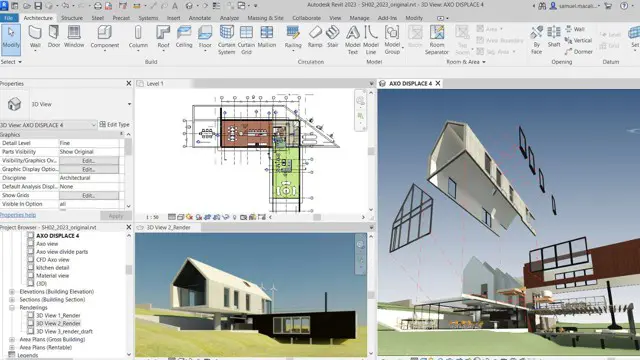
Revit Basic to Fundamentals
By London Design Training Courses
Why Choose Revit Basic to Fundamentals Course Course Link In this course you will learn Revit skills for BIM modeling. In-person or live online. Autodesk Revit Architecture training for students to create full 3D architectural project models and set them up in working drawings. Duration: 10hours Method: 1-on-1 method with tailored content and flexible pace, backed by individual support. Schedule: Choose a convenient hour from Mon to Sat between 9 am and 7 pm to create your own schedule. Revit Essentials Training: Learn Revit fundamentals for architecture and structural design, supporting efficient building construction with BIM workflows. Delivery Options: In-class at our center Live online sessions I. Introduction to Revit Overview of Revit and its uses Revit interface and basic tools Navigation and viewport controls Creating and saving projects II. Setting up a Project Creating a new project Setting up project levels and grids Adding site and building information Setting up project units III. Creating Building Elements Creating and modifying walls Adding doors and windows Creating and modifying floors and ceilings Creating roofs and modifying roof shapes Creating stairs and railings IV. Views and Sheets Creating and managing views Creating and managing sheets Adding schedules and tags Creating construction documents V. Annotation and Detailing Adding text and dimensions Creating and modifying detail components Adding symbols and keynote legends Adding annotations to construction documents VI. Conclusion and Next Steps Review of course content Tips for further learning and resources Q&A and feedback Note: The above course outline is just a suggestion, and the course content and duration can be adjusted according to the needs and level of the learners. Detailed Course Outline. 1. Starting a Project Creating a new project and the importance of a template. Understanding project settings and scales Adding levels Adding grids Adding columns 2. Modeling Basics Adding walls Using snaps Wall properties and wall types Using the modified tools Adding doors and windows Using constraints See: Autodesk Seek and Revit City websites 3. Links, Imports, and Groups Working with DWG files Creating topography from a DWG link Understanding CAD inserts Using import tips Creating a group Working with Revit links Managing links 4. Sketch-Based Modeling Components Working with floors Working with roofs Adding openings Working with stairs Working with railings Working with ceilings 5. Complex Walls Creating a custom basic wall type Adding curtain walls Adding curtain grids and mullions 6. Visibility and Graphics Controls Using object styles Working with visibility/graphic overrides Using Hide/Isolate Understanding view range Using the Linework Using cutaway views 7. Rooms Adding rooms Controlling room numbering Understanding room bounding elements 8. Schedules and Tags Understanding tags Adding schedules Modifying schedules Creating a key schedule 9. Annotation and Details Adding text Adding dimensions Adding symbols Adding legend views Creating a detail callout Using detail components Adding filled and masking regions 10. The Basics of Families Understanding familiesUsing reference planes, parameters, and constraints Adding solid geometry Adding void geometry Completing the family 11. Sheets, Plotting, and Publishing Adding sheets Exporting to AutoCAD and JPG

Rhino 3d training course 1-2-1
By Real Animation Works
Rhino 3d face to face training customised and bespoke Online or Face to Face

Revit One to One Basic to Advance Weekends Online or Face to Face
By Real Animation Works
Revit face to face training customised and bespoke. Online or Face to Face
The Solidworks: Complete CSWA Preparation course provides comprehensive training in Solidworks, focusing on preparing students for the CSWA (Certified SolidWorks Associate) exam. It covers fundamental sketching and part modeling techniques, advanced features, assembly creation, and drawing tools. Learning Outcomes: Understand the Solidworks user interface and essential mouse movements for sketching and part modeling. Gain proficiency in creating and editing sketches, using basic and advanced sketch tools, and applying dimensions and relations. Learn part modeling techniques such as extrusions, cuts, fillets, chamfers, ribs, and drafts. Explore intermediate part modeling concepts like 3D sketching, equations, mass properties, and defining material properties. Acquire skills in creating assemblies, inserting and manipulating parts, and applying mates for assembly constraints. Master drawing tools to create and edit drawing sheets, projection views, dimensioning, and generating a bill of materials. Familiarize yourself with various miscellaneous views like auxiliary view, section view, detail view, and more. Why buy this Solidworks: Complete CSWA Preparation? Unlimited access to the course for forever Digital Certificate, Transcript, student ID all included in the price Absolutely no hidden fees Directly receive CPD accredited qualifications after course completion Receive one to one assistance on every weekday from professionals Immediately receive the PDF certificate after passing Receive the original copies of your certificate and transcript on the next working day Easily learn the skills and knowledge from the comfort of your home Certification After studying the course materials of the Solidworks: Complete CSWA Preparation there will be a written assignment test which you can take either during or at the end of the course. After successfully passing the test you will be able to claim the pdf certificate for £5.99. Original Hard Copy certificates need to be ordered at an additional cost of £9.60. Who is this course for? This Solidworks: Complete CSWA Preparation course is ideal for Students Recent graduates Job Seekers Anyone interested in this topic People already working in the relevant fields and want to polish their knowledge and skill. Prerequisites This Solidworks: Complete CSWA Preparation does not require you to have any prior qualifications or experience. You can just enrol and start learning.This Solidworks: Complete CSWA Preparation was made by professionals and it is compatible with all PC's, Mac's, tablets and smartphones. You will be able to access the course from anywhere at any time as long as you have a good enough internet connection. Career path As this course comes with multiple courses included as bonus, you will be able to pursue multiple occupations. This Solidworks: Complete CSWA Preparation is a great way for you to gain multiple skills from the comfort of your home. Course Curriculum Introduction Introduction 00:05:00 Overview of Solidworks Creating a New Document 00:01:00 User Interface 00:02:00 Mouse Movements in Sketch 00:02:00 Mouse Movements in Part 00:03:00 Sketching Creating a Sketch File 00:02:00 Basic Sketch Tools 00:07:00 Dimensions and Relations 00:12:00 Mirror Entities 00:02:00 Linear and Circular Sketch Pattern 00:06:00 Sketch Offset Entities 00:02:00 Converting Sketch to 3D Model 00:03:00 Opening and Saving Part Document 00:01:00 Exercises 00:04:00 Part Modeling Basics Extruded Base 00:03:00 Extruded Boss Additional Techniques 00:04:00 Creating a Sketch on the Part 00:02:00 Creating a Sketch on the New Plane 00:05:00 Convert and Offset Entities 00:02:00 Extruded Cut 00:03:00 Fillet and Chamfer 00:03:00 Rib 00:03:00 Draft 00:04:00 Shell 00:02:00 Part and Sketch Modification 00:02:00 Exercises 00:06:00 Part Modeling Intermediate 3D Sketch 00:03:00 Equation 00:03:00 Mass Properties and Coordinate System 00:03:00 Defining Density and Material 00:02:00 Measuring Tool 00:03:00 Exercises 00:07:00 Part Modeling Advanced Mirror Feature 00:01:00 Revolved Boss Base 00:02:00 Swept Boss Base 00:05:00 Exercises 00:14:00 Assembly Creation Inserting Part Relative to Origin 00:02:00 Inserting Part Relative to Planes 00:02:00 Standard Mates 00:04:00 Move Component 00:02:00 Mirror Component 00:01:00 Sketch in Assembly 00:03:00 Exercises 00:08:00 Drawing Tools Basics Creating Drawing Sheet 00:01:00 Projection Views and Edit Sheet 00:04:00 View Properties 00:02:00 Drawing - View Dimensioning 00:03:00 Bill of Material 00:02:00 Exercises 00:03:00 Drawing Tools - Miscellaneous Views Auxiliary View 00:01:00 Section View 00:02:00 Aligned Section View 00:02:00 Detail View 00:02:00 Broken-out Section View 00:02:00 Break View 00:02:00 Crop View 00:01:00 Alternative Position View 00:02:00 Resources Resources - Solidworks: Complete CSWA Preparation 00:00:00 Assignment Assignment - Solidworks: Complete CSWA Preparation 00:00:00

Microsoft Power BI Desktop In-company (now with live online classes)
By Microsoft Office Training
This course will allow you to explore the potential of self-service business intelligence using Power BI Desktop to analyse and connect to different sources of data, creating Relationships between those different datasets, Query the data using Shaping and data Modelling, to create Visualizations, and publish Reports to different platforms . Course Objectives At the end of this course you will be able to: Connect to data from different sources. Use the Query Editor Perform Power BI desktop data Shaping and Transformation. Create Power BI desktop Modelling. Create Power BI desktop Visualizations and Reports. ' 1 year email support service Take a closer look at the consistent excellent feedback from our growing corporate clients visiting our site ms-officetraining co uk With more than 20 years experience, we deliver courses on all levels of the Desktop version of Microsoft Office and Office 365; ranging from Beginner, Intermediate, Advanced to the VBA level and Business Intelligence. Our trainers are Microsoft certified professionals with a proven track record with several years experience in delivering public, one to one, tailored and bespoke courses. Our competitive rates start from £550.00 per day of training Tailored training courses: You can choose to run the course exactly as they are outlined by us or we can customise it so that it meets your specific needs. A tailored or bespoke course will follow the standard outline but may be adapted to your specific organisational needs. Please visit our site (ms-officetraining co uk) to get a feel of the excellent feedback our courses have had and look at other courses you might be interested in. Introduction to Power BI Power BI Jargon explained A quick look at Power BI Desktop A quick look at the Power BI service Helpful resources Power BI and Excel Introduction to using Excel data in Power BI Upload Excel data to Power BI Import Power View and Power Pivot to Power BI Getting started with Power BI Desktop Overview of Power BI Desktop Accessing Help and Helpful resources Connect to data sources in Power BI Desktop Shaping and Transforming Data with Query Editor Introduction to the Query Editor Data Sources Power BI Desktop can Connect to Introduction to Steps and M code Combining Data Using Merge and Append Queries Data Type Properties Working with Delimiters Clean and transform your data with the Query Editor Text Specific Transformation Tools Number Specific Transformation Tools Date Specific Transformation Tools Split and Merge columns Creating an Index Column Adding Conditional Columns Columns From Examples Grouping and Aggregating data Pivoting and Unpivoting Using filters Modeling the data Introduction to modeling your data How to manage your data relationships Create calculated columns Optimizing data models Create calculated measures Show Values As and Quick Measures Create calculated tables Explore your time-based data Introduction to DAX DAX calculation types DAX functions Visualizations Introduction to visuals in Power BI Create and customize simple visualizations Modify colors in charts and visuals Shapes, text boxes, and images Page layout and formatting Group interactions among visualizations Visual hierarchies and drill-down Using custom visualizations Create a KPI Visualization Geo-Data and Maps Reports, Publishing and Sharing Introduction to the Power BI service Quick insights in Power BI Create and configure a dashboard Ask questions of your data with natural language Create custom Q&A suggestions Share dashboards with your organization Introduction to content packs, security, and groups Publish Power BI Desktop reports Print and export dashboards and reports Create groups in Power BI Use content packs Update content packs Publish to web Who is this course for? Who is this course for? This course facilitates you with knowledge on the potential for Power BI Desktop to analyse and connect to different sources of data, creating Relationships between those different datasets, Query the data using Shaping and data Modelling, and to create Visualizations, and publish Reports to different platforms. Requirements Requirements Before attending this course, delegates should have: - A general knowledge of database concepts (fields, records and relationships) - Familiarity with Excel. Career path Career path Business Intelligence Data Analysis ETL & Data Warehousing

BW362 SAP BW on SAP HANA
By Nexus Human
Duration 5 Days 30 CPD hours This course is intended for Technology Consultants Overview Enables you to implement and maintain SAP BW powered by SAP HANA.Outlines advantages of the new SAP 'In-Memory' database foundation for SAP BW.Explains HANA specific features as well as optimized existing as well as new data models and functions of SAP BW.Introduces the new SAP architecture framework of LSA++ and provides guidelines on how to convert your existing EDW-architecture into this new concept.Explains native HANA modeling and how both, HANA information views as well as BW InfoProviders, can complement each other in so-called 'mixed scenarios'. In this course, students gain the knowledge to enable themselves to implement and maintain SAP BW powered by SAP HANA. The course explains HANA specific features as well as optimized existing as well as new data models and functions of SAP BW. Getting Started SAP HANA Basics SAP BW Basics SAP HANA BW Modeling Tools SAP HANA Native Modeling Migration to SAP BW on HANA Migration Strategies and Tools SAP BW Migration Cockpit BW on HANA Data Management Multi-Temperature Data Management Optimizing BW Data Management based on Dynamic Tiering and Non- Active Concept Optimizing BW Data Management based on Nearline-Storage Optimization Areas in BW on HANA HANA-Optimized Data Modeling: InfoCubes HANA-Optimized Data Modeling: Advanced DataStore-Objects HANA-Optimized Data Modeling: CompositeProviders HANA-Optimized Data Staging HANA-Optimized Analytic Manager HANA-Optimized Analysis Processes Modeling with SAPïs Reference Architecture LSA++ Review of Layered Scalable Architecture (LSA) From LSA to LSA++: Streamline Core Layers LSA++: Open Operational Data Store Layer (Open ODS Views) LSA++: Agile Data Mart & BW Workspace Layer Hybrid Modeling in Mixed Scenarios Generation of HANA-Views of BW InfoProviders Mixed Scenarios SAP HANA Live HANA-Optimized BI Content Data Provisioning into SAP HANA and SAP BW Overview of Data Provisioning Methods to SAP HANA SLT Replication into SAP HANA SLT Replication into SAP BW Operational Data Provisioning into SAP BW DB-Connect and Open Hub Destination Additional Enhancements of BW 7.40 InfoObject Enhancements Authorization Enhancements Process Chain Monitoring HANA-Optimized BW Search HANA-Optimized BW Planning Obsolete BW Object Types Mobile Enablement Enhancements SAP HANA vs. BW Accelerator Summary & Outlook New Transactions and BW on HANA Roadmap Additional course details: Nexus Humans BW362 SAP BW on SAP HANA training program is a workshop that presents an invigorating mix of sessions, lessons, and masterclasses meticulously crafted to propel your learning expedition forward. This immersive bootcamp-style experience boasts interactive lectures, hands-on labs, and collaborative hackathons, all strategically designed to fortify fundamental concepts. Guided by seasoned coaches, each session offers priceless insights and practical skills crucial for honing your expertise. Whether you're stepping into the realm of professional skills or a seasoned professional, this comprehensive course ensures you're equipped with the knowledge and prowess necessary for success. While we feel this is the best course for the BW362 SAP BW on SAP HANA course and one of our Top 10 we encourage you to read the course outline to make sure it is the right content for you. Additionally, private sessions, closed classes or dedicated events are available both live online and at our training centres in Dublin and London, as well as at your offices anywhere in the UK, Ireland or across EMEA.
Facilitation Skills for Business Analysts - Communication and Problem Solving: On-Demand
By IIL Europe Ltd
Facilitation Skills for Business Analysts - Communication and Problem Solving: On-Demand This course teaches the methods needed to organize and run information-gathering events. It combines the basics of graphic decision making and modeling with facilitation, communication, and meeting management skills. What You Will Learn Upon completion, participants will be able to: Define the solution scope Work with the development team in the systems testing stage Ensure the solution is usable in the business environment Foundation Concepts Defining the Business Analyst Function Role of the Business Analyst as Change Agent An Introduction to the BABOK® Guide Business Analyst Roles and Relationships through the Project Life Cycle Business Analysis Planning and Monitoring - Defining the Process Overview of Business Analysis Planning & Monitoring (BAP&M) BAP&M - Process and Tools BAP&M - Roles and Responsibilities BAP&M - Governance, Information Management & Performance Improvement Elicitation and Collaboration - Gathering and Confirming Information Overview of Elicitation and Collaboration Elicitation and Collaboration Techniques Requirements Life Cycle Management - Maintaining Requirements and Design Information Overview of Requirements Life Cycle Management Requirements Life Cycle Management Tasks - Details Strategy Analysis - Providing Context to Requirements Analysis and Design Definition Overview of Strategy Analysis Analyze Current State Define Future State Assess Risks Define Change Strategy Requirements Analysis and Design Definition - Defining Solution Options Overview of Requirements Analysis and Design Definition (RA&DD) The Anatomy of Requirements RA&DD Task Descriptions RA&DD Techniques Solution Evaluation - Assessing Solution Performance Overview of Solution Evaluation Solution Evaluation Tasks Solution Evaluation in Development Stages Underlying Competencies Overview of Underlying Competencies (UCs) Underlying Competencies - Details
