- Professional Development
- Medicine & Nursing
- Arts & Crafts
- Health & Wellbeing
- Personal Development
1477 Insights courses in Cardiff delivered Live Online
M&A Insights for CFOs
By FD Capital
An M&A specialist is a senior CFO with a proven track record of overseeing and implementing mergers and acquisitions. An M&A specialist is a senior CFO with a proven track record of overseeing and implementing mergers and acquisitions. They may be hired on a full-time basis and carry a full CFO workload or can be recruited on a part-time or interim basis to focus on a specific merger or acquisition. This flexibility is ideal for start-ups and SMEs who don’t have the budget to recruit a full external team to oversee an M&A or to hire a full-time CFO. The CFO is a link between both companies engaged in the M&A, acting as the eyes and ears for both the board and CEO. Their financial skills enable them to identify potential M&A opportunities and incorporate risk management into their strategy to get the most value out of their deal. Most companies evolve their approach to mergers and acquisitions organically, especially those who rely on an M&A specialist instead of having a dedicated team that works solely on M&A. The CFO is responsible for considering any potential acquisitions, crunching the numbers involved, and ensuring due diligence. They’ll be responsible for determining the value of a potential M&A and presenting it to the company’s board and leadership team to determine whether to make the purchase. An M&A specialist is responsible for gathering the data – including both positive and negative factors – to present an objective look at the other organisation and the potential value the acquisition could bring. CFOs will spend most of their time getting to grips with the numbers involved, long before presenting the M&A proposal to the board. This exercise also requires them to have real-time insight into their own company’s performance, value, and finances to paint a wider picture. An M&A specialist will take the critical steps of ensuring that the numbers presented to them are correct. CFOs who don’t specialise in M&As will still have the skill set required to oversee the process but may lack the efficiency and unique insight of an M&A specialist. Companies that are exploring the option of a merger or being acquired by another company may also decide to recruit an M&A specialist to prepare their accounting. The organisation will want to ensure they present the correct numbers to get the correct valuation and prevent any delays further in the process if incorrect numbers pop up. Getting on top of the data early can enable CFOs to plan accordingly. Most will want to provide extra time within their strategy for any potential hiccups along the way. Spending more time on the data early on can speed up the process while still ensuring due diligence is met. Visit our website to learn more https://www.fdcapital.co.uk/mergers-and-acquistions-specialist/ Tags Online Events Things To Do Online Online Networking Online Business Networking #finance #insights #cfo #mergers #acquisitions

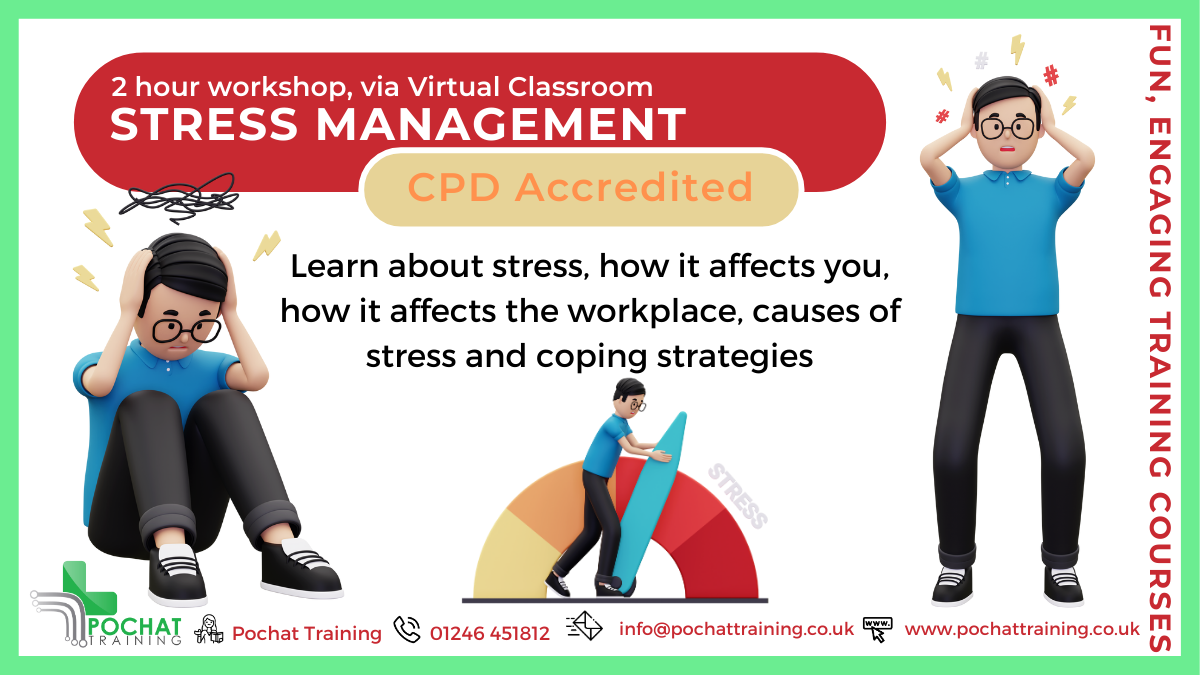
Tackle Stress Before It Tackles You! Work-related stress affects 875,000 people every year, and its impacts go beyond the workplace—affecting your mind, body, and personal life. But it doesn’t have to be this way. Join our Stress Management Workshops to: ✔️ Understand the difference between stress and pressure ✔️ Learn the causes of stress in and out of the workplace ✔️ Discover practical coping strategies and build mental resilience These workshops are packed with insights, tools, and strategies to help you take control of your stress levels and improve your well-being—personally and professionally. There are two different ones to choose from - a 2 hour workshop and a 4 hour workshop! Course Contents of 2 hour course: What is Stress Stress versus Pressure Statistics Absenteeism, Presenteeism and Leaveism Workplace Causes of Stress Personal Causes of Stress Short-Term and Long-Term Effects of Stress Coping Strategies Mental Resilience Benefits of this Workshop: In 2022/23. 875,000 people suffered from work-related stress, depression or anxiety The affects of stress are far reaching, affecting one's mind, body, social and personal life Become more aware of what stresses you, what is does to you and find ways to reduce those stress levels
November 2025 Fundamentals Organisation & Relationship Systems Coaching Training
By CRR UK
CRRUK equips professionals with the concepts, skills and tools to build conscious, intentional relationships, and to coach relationship systems of any size.
Making the Right Decisions Under Pressure
By Nexus Human
Duration 2 Days 12 CPD hours This course is intended for Executives, directors, managers, and others tasked with making important decisions for their organizations will benefit from this course. Overview Make intelligent decisions with limited time and information Reframe issues to ensure greater problem-solving accuracy Convert conflicting opinions into useful insights In this course, students will learn to evaluate options, generate possible solutions, and decide on logical strategies. Private classes on this topic are available. We can address your organization?s issues, time constraints, and save you money, too. Contact us to find out how. Prerequisites While there are no prerequisites for this course, please ensure you have the right level of experience to be successful in this training. 1. The Complexity of Decision Making Establishing the Needs of the Organization Defining Organizational Objectives and Goals Measuring Your Goals Calculating Probabilities of Success 2. Dealing with Opinion in the Face of Uncertainty Understanding Theories of Decision-Making Avoiding Irrationality Being Aware of Risks Reframing the Options Asking the Right Questions Knowing What You Want Making Proper Comparisons Working with Stereotypes and Expectations 3. Adapting Decision Strategies for a Complex World Reviewing Your Plans Engaging Stakeholders Enlisting Your Network Managing Risks Planning for Risks - Avoidance, Mitigation, Transference, and Acceptance Applying Complexity Theory and the Butterfly Effect Adjusting Decisions Building in Metrics & Measurements Monitoring Progress and Managing Risks Looking for Emerging Trends Additional course details: Nexus Humans Making the Right Decisions Under Pressure training program is a workshop that presents an invigorating mix of sessions, lessons, and masterclasses meticulously crafted to propel your learning expedition forward. This immersive bootcamp-style experience boasts interactive lectures, hands-on labs, and collaborative hackathons, all strategically designed to fortify fundamental concepts. Guided by seasoned coaches, each session offers priceless insights and practical skills crucial for honing your expertise. Whether you're stepping into the realm of professional skills or a seasoned professional, this comprehensive course ensures you're equipped with the knowledge and prowess necessary for success. While we feel this is the best course for the Making the Right Decisions Under Pressure course and one of our Top 10 we encourage you to read the course outline to make sure it is the right content for you. Additionally, private sessions, closed classes or dedicated events are available both live online and at our training centres in Dublin and London, as well as at your offices anywhere in the UK, Ireland or across EMEA.

Fully Booked - How to Attract and Keep New Clients
By Dan Roberts
In this four-hour interactive 1-2-1 session, Dan will analyse all the ways you currently attract new clients, advise on how to tweak/revolutionise your systems and suggest new ways to become a client magnet. Hence, the right clients contact you without having to ‘sell’. Dan will also share his insights on customer retention – having looked after many private clients for over a decade; he shares practical insights that go beyond being a good coach (such as boundaries, rapport building, empathy, and leadership) and that help you manage your working relationships with grace and kindness and professionalism. This Masterclass will be tailor-made for YOU and requires completing an onboarding questionnaire upon purchase.
Thinking with Critical Insight
By Nexus Human
Duration 2 Days 12 CPD hours This course is intended for Professionals who want to make the best decisions and develop creative and elegant solutions to challenging problems will benefit from this course. Overview Enable you to evaluate, identify, and distinguish between relevant and irrelevant information Engage critical thinking through curiosity and your ability to ask good questions Apply the eight best practices of critical thinking in practice Leverage open-mindedness to become more receptive and highly tuned for new ideas Students will learn to explore challenges, defy incorrect assumptions, and look at things with new and differing perspectives, incorporating these insights into your thought processes, and enabling them to find solutions to even the most difficult tasks. Private classes on this topic are available. We can address your organization?s issues, time constraints, and save you money, too. Contact us to find out how. 1. The Challenges of Modern Thinking Becoming a Rational Thinker Critical Thinking in Application Applying Reason Developing Open-Mindedness Stepping Out of Your Comfort Zone Avoiding Jumping to Conclusions Expecting and Initiating Change Being Ready to Adapt Thinking Logically 2. Critical Thinking Best Practices Listening Actively Evaluating Information Making Assumptions Watching Out for Bias Asking Clarifying Questions Performing SWOT Analysis Benefitting from Critical Thinking 3. Putting It All Together Changing Your Perspective Considering Other Viewpoints Dealing with New Information Solving Problems Identifying Inconsistencies Asking Why Evaluating the Solution Retaining Your New Skills Reflecting and Learning from Mistakes Asking Questions on an Ongoing Basis Additional course details: Nexus Humans Thinking with Critical Insight training program is a workshop that presents an invigorating mix of sessions, lessons, and masterclasses meticulously crafted to propel your learning expedition forward. This immersive bootcamp-style experience boasts interactive lectures, hands-on labs, and collaborative hackathons, all strategically designed to fortify fundamental concepts. Guided by seasoned coaches, each session offers priceless insights and practical skills crucial for honing your expertise. Whether you're stepping into the realm of professional skills or a seasoned professional, this comprehensive course ensures you're equipped with the knowledge and prowess necessary for success. While we feel this is the best course for the Thinking with Critical Insight course and one of our Top 10 we encourage you to read the course outline to make sure it is the right content for you. Additionally, private sessions, closed classes or dedicated events are available both live online and at our training centres in Dublin and London, as well as at your offices anywhere in the UK, Ireland or across EMEA.
ANXIETY – UNDERSTANDING AND INCLUDING CHILDREN AND YOUNG PEOPLE
By Inclusive Solutions
In this practical workshop session we will explore ways of including young people of all ages who experience anxiety some of whom may well be on the autism spectrum. The session will be values based and practical and will aim to allow the sharing of experiences and good practice as well as promoting innovative approaches to inclusion through the design of best practice. Course Category Autism and Communication Inclusion Parents and Carers Behaviour and Relationships Meeting emotional needs Description In this practical workshop session we will explore ways of including anxious children in mainstream schools and settings. The session will be values based and practical and will aim to allow the sharing of experiences and good practice as well as promoting innovative approaches to inclusion through the design of best practice. Family perspectives and experiences will also be explored. This is not a ‘medical model’ day on anxiety. Testimonials ‘Really gave me an idea of how people feel and helped me think how to plan to meet their needs.’ ‘Really useful insights’ Learning Objectives Increased confidence and understanding regarding including anxious children Access to a wider range of practical strategies to impact on anxiety Deeper understanding of core values surrounding inclusion New skills and processes to strengthen the inclusion of anxious children Insights and understanding of sensory sensitivities Understanding increased in area of movement differences Who Is It For? Personal Assistants Teachers Heads and deputies Guidance staff Learning support teams SENCOs Primary and secondary teachers Parents Brothers and sisters Local authority support services Community workers and carers Course Content The course answers the questions : What is anxiety? How do we go about including anxious children? Can we understand more deeply what is going on underneath concerning behaviours? Key themes include: Movement differences Supports and Accommodations for Sensory Sensitivities Developing Friendships and Peer Support Learning to Listen

Inclusive Leadership
By Mpi Learning - Professional Learning And Development Provider
Learn from two decades of specialist equality & inclusion expertise and the pitfalls to avoid, plus adventures in self-discovery. Participants enjoy the engaging and motivational style, building up the confidence to apply deepened insights and practical tools.

Power BI for Data-driven Decision Makers
By Nexus Human
Duration 1 Days 6 CPD hours This course is intended for This course is designed for professionals in a variety of job roles who receive Power BI data visualizations and reports from data analysts or from data visualization engineers. These data report recipients want to use the features and capabilities of Power BI to fully explore the visualizations and initial analyses provided to them in reports, perform additional analysis to ask next-level questions of the data, and to customize and create new visualizations and dashboards in order to share new insights and create compelling reports. Overview Explore Power BI reports. Analyze data to get answers and insights. Sort and group data for analysis and reporting. Filter visualizations. Prepare reports. Troubleshoot, collaborate, and share reports. As data acquisition, access, analysis, and reporting are interwoven with our businesses and lives, more and more data is collected about business and personal activities. This abundance of data and the computing power to analyze it has increased the use of data analysis and data visualization across a broad range of job roles. Decision makers of all types, including managers and executives, must interact with, interpret, and develop reports based on data and analysis provided to them. Microsoft Power BI software is designed for data analysis and the creation of visualizations. Data analysts prepare data, perform initial analysis, and create visualizations that are then passed to business data decision makers. These decision makers can use Power BI's tools to explore the data, perform further analysis to find new insights, make decisions, and create customized reports to share their findings. Prerequisites To ensure your success in this course, you have experience managing data with Microsoft Excel or Google Sheets 1. Exploring Power BI Reports Topic A: Data Analysis Workflow with Power BI Topic B: Explore Reports in the Power BI Service Topic C: Edit Reports 2. Analyzing Data to Get Answers and Insights Topic A: Configure Data Visualizations Topic B: Ask New Questions by Changing Aggregation Topic C: Find Answers with Calculations 3. Sorting and Grouping Data for Analysis and Reporting Topic A: Sort Data Topic B: Group Data 4. Filtering Visualizations Topic A: Filter Data to Refine Analysis Topic B: Create Slicers for Reports 5. Preparing Reports Topic A: Format and Annotate Reports Topic B: Emphasize Data in Reports 6. Troubleshooting, Sharing, and Collaborating Topic A: Troubleshoot Data Issues Topic B: Collaborate in Power BI Topic C: Collaborate with Non-Power BI Users
MB-910T00 Microsoft Certified: Dynamics 365 Fundamentals (CRM)
By Nexus Human
Duration 1 Days 6 CPD hours This course is intended for People in different roles and at various stages in their careers can benefit from this fundamentals course. This includes IT professionals, business stakeholders and others who want to be exposed to the customer engagement capabilities of Dynamics 365, students, recent graduates, and people changing careers who want to leverage Dynamics 365 to move to the next level. Overview Describe the customer engagement apps and what they have in common Describe the standard marketing processes and how Dynamics 365 Marketing addresses them Describe Dynamics 365 Marketing features and capabilities Describe additional marketing apps Describe the standard sales processes and how Dynamics 365 Sales addresses them Describe Dynamics 365 Sales capabilities Describe additional sales apps such as Sales Insights and Sales Navigator Describe the standard customer service processes and how Dynamics 365 Customer Serviceaddresses them Describe Dynamics Customer Service capabilities Describe additional sales apps such as Sales Insights and Sales Navigator Describe the standard field service business processes and how Dynamics 365 Field Service addresses Describe how to generate Work Orders Describe the scheduling capabilities of Dynamics 365 Field Service Describe the inventory management capabilities of Dynamics 365 Field Service Describe the asset management capabilities of Dynamics 365 Field Service Describe project-based customer engagement processes addressed by Dynamics 365 Project Operations Describe the sales capabilities of Dynamics 365 Project Operations Describe the project management capabilities of Dynamics 365 Project Operations Describe the resource utilization capabilities of Dynamics 365 Project Operations This course will provide you with a broad introduction to the customer engagement capabilities of Dynamics 365. You will become familiar with the concept of customer engagement, as well as each of the customer engagement apps, including Dynamics 365 Marketing, Dynamics 365 Sales, Dynamics 365 Customer Service, Dynamics 365 Field Service, and the customer relationship management (CRM) capabilities of Dynamics 365 Project Operations. This course will include lecture as well as hands-on labs. Learn the Fundamentals of Dynamics 365 Marketing Get introduced to the Dynamics 365 customer engagement apps Examine Dynamics 365 Marketing Describe Dynamics 365 Marketing capabilities Review Additional Marketing Apps Learn the Fundamentals of Dynamics 365 Sales Explore Dynamics 365 Sales Manage the sales lifecycle with Dynamics 365 Sales Review additional sales apps Learn the Fundamentals of Dynamics 365 Customer Service Examine Dynamics 365 Customer Service Describe Dynamics Customer Service capabilities Review additional customer service apps Learn the Fundamentals of Dynamics 365 Field Service Examine Dynamics Field Service Generate Work Orders in Dynamics 365 Field Service Describe the scheduling capabilities of Dynamics 365 Field Service Examine the inventory management capabilities of Dynamics 365 Field Service Review the asset management capabilities of Dynamics 365 Field Service Learn the Fundamentals of Dynamics 365 Project Operations (CRM) Examine Dynamics 365 Project Operations Describe the sales capabilities of Dynamics 365 Project Operations Plan projects with Dynamics 365 Project Operations Review the resource utilization capabilities of Dynamics 365 Project Operations Additional course details: Nexus Humans MB-910T00 Microsoft Dynamics 365 Fundamentals (CRM) training program is a workshop that presents an invigorating mix of sessions, lessons, and masterclasses meticulously crafted to propel your learning expedition forward. This immersive bootcamp-style experience boasts interactive lectures, hands-on labs, and collaborative hackathons, all strategically designed to fortify fundamental concepts. Guided by seasoned coaches, each session offers priceless insights and practical skills crucial for honing your expertise. Whether you're stepping into the realm of professional skills or a seasoned professional, this comprehensive course ensures you're equipped with the knowledge and prowess necessary for success. While we feel this is the best course for the MB-910T00 Microsoft Dynamics 365 Fundamentals (CRM) course and one of our Top 10 we encourage you to read the course outline to make sure it is the right content for you. Additionally, private sessions, closed classes or dedicated events are available both live online and at our training centres in Dublin and London, as well as at your offices anywhere in the UK, Ireland or across EMEA.