- Professional Development
- Medicine & Nursing
- Arts & Crafts
- Health & Wellbeing
- Personal Development
6443 Courses in Downpatrick delivered Live Online
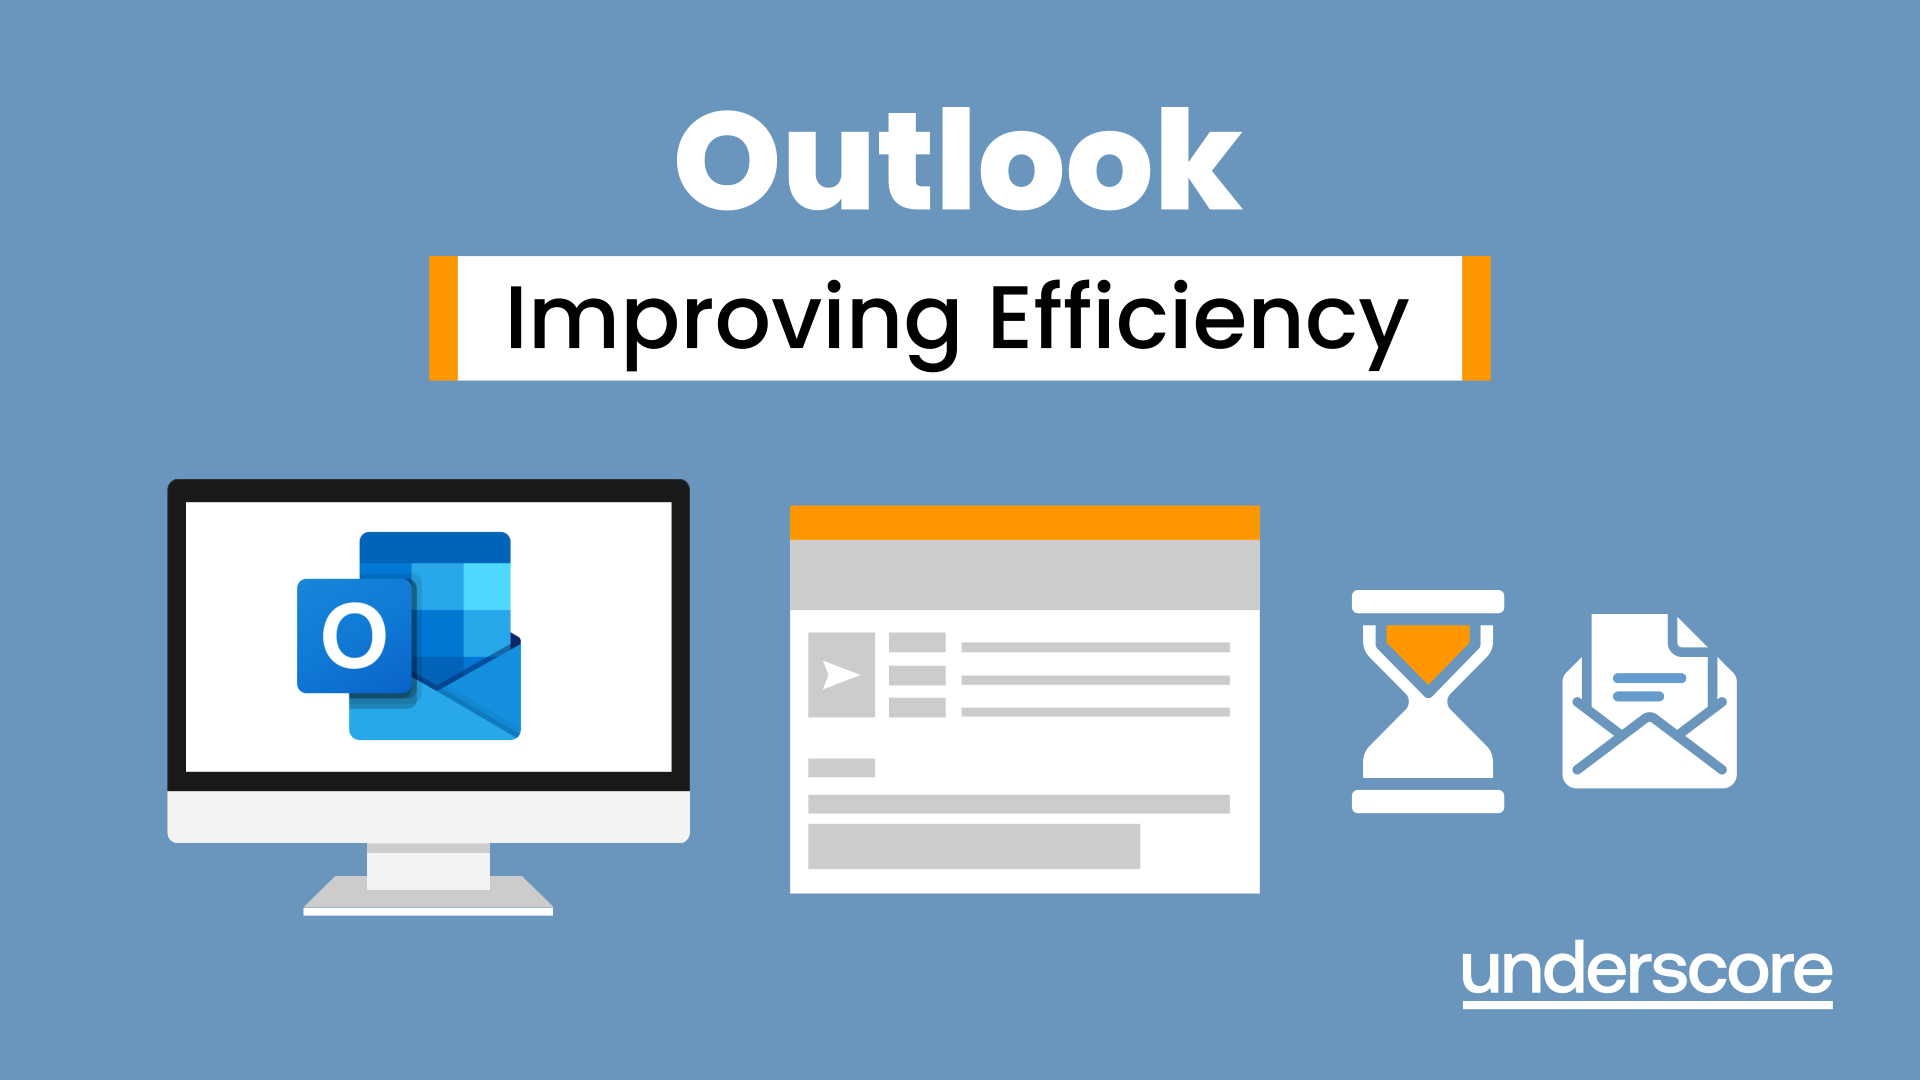
Outlook - Improving Efficiency
By Underscore Group
We use it everyday but there are so many additional tools to save you time and make your work in Outlook more efficient and less stressful. Course overview Duration: 4 hours People tend to think they know how to use Outlook however there are so many lesser known features that can make working in Outlook so much more efficient. Simply understanding the layouts, how to turn things on and off and customising the environment to your preferences can save time and frustration. You then have search features, things such as conversation clean up and quick steps that can help to tidy up and organise what you do. Objectives By the end of the course you will be able to: Customise Outlook to your preferences Manage email conversations Setup and use Quick Steps Create folders and organise information Setup rules Search for information Work effectively with calendars Content Customising the user interface Using the Navigation Pane and “To-do Bar” Setting folder pane options Adding favourites Peak preview Customising the quick access bar Setting reading pane and message preview Customizing email mail views Using the field chooser Email options Email conversations Conversation clean up Using Quick Steps Creating folders and organising information Setting email options Setting up rules Searching for information Using the Search bar Setting what to search for Setting where to search Searching for categories Adding more search options Working with calendars Setting what to view Using Schedule View Setting calendar options Weather bar Adding different time zones Adding meetings and appointments Setting up and using categories Opening other people’s calendars Setting calendar permissions Calendar groups Working with Tasks Lists Setting task options Adding and amending tasks Setting dates, deadlines and reminders Adding attachments to tasks Assigning tasks to others Flagging tasks Using and setting Quick Click Recurring tasks Flagging emails to appear on your task list Converting emails to tasks Converting tasks to calendar appointments
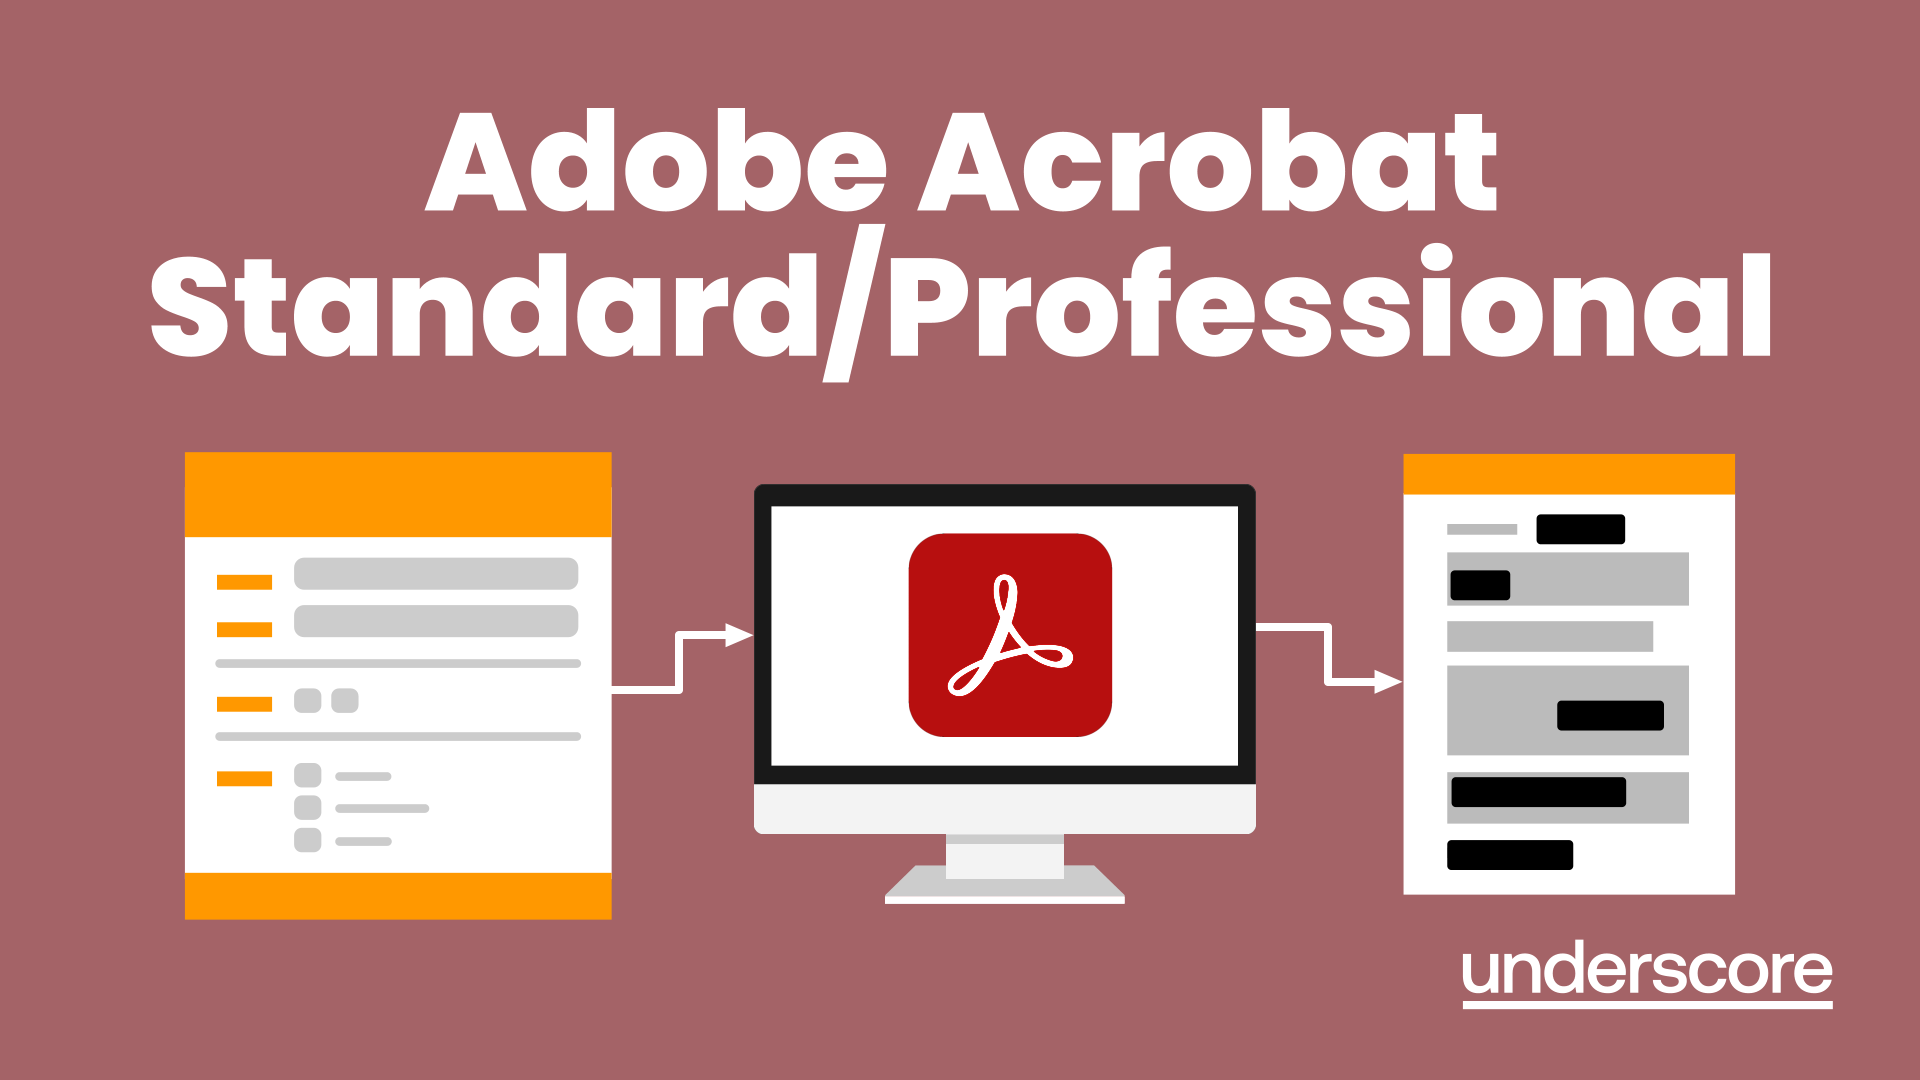
Adobe Acrobat (Standard or Professional)
By Underscore Group
Discover the amazing features this tool has to offer in combining, collating and editing documents and the forms, markups and redaction techniques available. Duration 1 day (6.5 hours) Overview This Adobe Acrobat course looks at the powerful features of the tool quite often overlooked. The course requires the use of either the Standard or Professional versions of Acrobat as the free Acrobat Reader only has limited functionality. Learn how to combine documents into a single file, edit and mark up PDFs, compare documents, redact data from documents and create fillable forms. Objectives By the end of the course you will be able to: Create PDFs from other tools Set security Collate and combine files into a single PDF Edit PDF files Complete and sign documents Create fillable forms Mark up PDF documents Compare files Redact data Content Creating PDFs Building PDF documents from Word, Excel and PowerPoint Setting PDF options for print, image quality and security Working in Acrobat Home, Tools and Document Views Using the Navigation Panel and Pane Floating toolbar and Contextual menus Collating and Combining Files Combining multiple files into a single PDF Adding extra files Deleting pages and reorganising pages Editing Files Editing text and graphics Adding text and images Adding headers and footers, watermarks and backgrounds Adding Links Adding manual links Automatic links Completing and signing documents Using fill and sign to complete forms Adding signatures Creating Fillable and Signable Forms Prepare a form Autodetect fillable fields Add manual fillable fields Adding drop downs, check boxes, etc. Naming fields Setting field properties Previewing the form Marking Up Documents Marking up changes Using sticky notes Using the highlighter pen Adding stamps Attaching documents and audio Replying to comments Comparing Files Selecting settings Comparison report Reviewing differences Using the changes pane Redacting Data (Acrobat Professional only) Setting redaction options Redacting chosen text Searching and redacting words, phrases or patterns Redacting whole pages Applying redaction
Power BI Advanced Reporting
By Underscore Group
Expand your Power BI knowledge and take your reports to the next level. Course overview Duration: 1 day (6.5 hours) This course is aimed at existing users who want to expand their skills to use advanced reporting techniques and use DAX to create calculated columns and measures. Participants should have either attended our Power BI – Introduction course or have equivalent knowledge. You should be able to import and transform data and create simple reports. Objectives By the end of the course you will be able to: Import and connect data tables Create and use date calendars Create calculated columns Create and use measures Use drill down and drill through Create Tooltip pages Add and customise slicers Add action buttons Streamline your report for use in the Power BI Service Content Review of importing and loading data Importing data Transforming data Adding custom columns Creating data models Building visuals Creating date calendars Building date tables Creating Financial Year information Including Month and Day information Creating calculated columns Power Query custom columns vs DAX columns Creating DAX calculated columns Creating measures Implicit vs Explicit Measures Building measures Using DAX Common DAX functions Drill Down vs Drill Through Review of drill down Creating drill through pages Using drill through Creating ToolTips Pages Adding pages to use for Tooltips Linking ToolTip pages to visuals Using action buttons Adding images Adding buttons Setting actions Working with slicers Adding slicers Changing slicer settings Syncing slicers between pages Showing what has been sliced Setting slicer interactions Techniques in the Power BI Service Hiding the navigation bar Stopping users manually filtering

Nodes and Links Project Insights and Managing Risk
By Underscore Group
Learn how to use this innovative tool to analyse and validate your schedule, to add and model uncertainty and risk and to work with updated plans to compare project progress. Course overview Duration: 1 day (6.5 hours) This course looks at the powerful features of Nodes and Links. It looks at analysing and validating your schedule, adding uncertainty and risk and working with updated plans to compare project progress. Hands on practice will be gained throughout the course to ensure you can confidentially put your new skills into practice back in the workplace. This course is designed for new users of Nodes and links, no previous experience is required. You should however be familiar with risk management processes and terminology. Objectives By the end of the course you will be able to: Import and validate plans Analyse and review plans Add and model uncertainty Add and model risk Load updated schedules Re run analysis on updated schedules Content Validating your plan Importing a baseline plan Running a health check Analysing the results Reviewing the plan Analysing critical paths Reviewing activities Reviewing resources Adding Uncertainty Setting uncertainty templates Distributions Adding uncertainty Using Inherit Using AI Reviewing activity distributions Modelling Uncertainty Running the Analysis Reviewing the results Reviewing activity results Risk Drivers Filtering for activities Setting up the Risk Register Setting Risk Templates Adding Risks to the Risk Register Independent vs Dependant Events Setting Probability and Impact Modelling Uncertainty and Risk Mapping risks to activities Running the Analysis Reviewing the results Updated Plans Importing a new plan version Comparing plans Tracking progress Trend analysis Analysing Updated Plans Using updated plans Synchronising uncertainly and risk Rerunning analysis

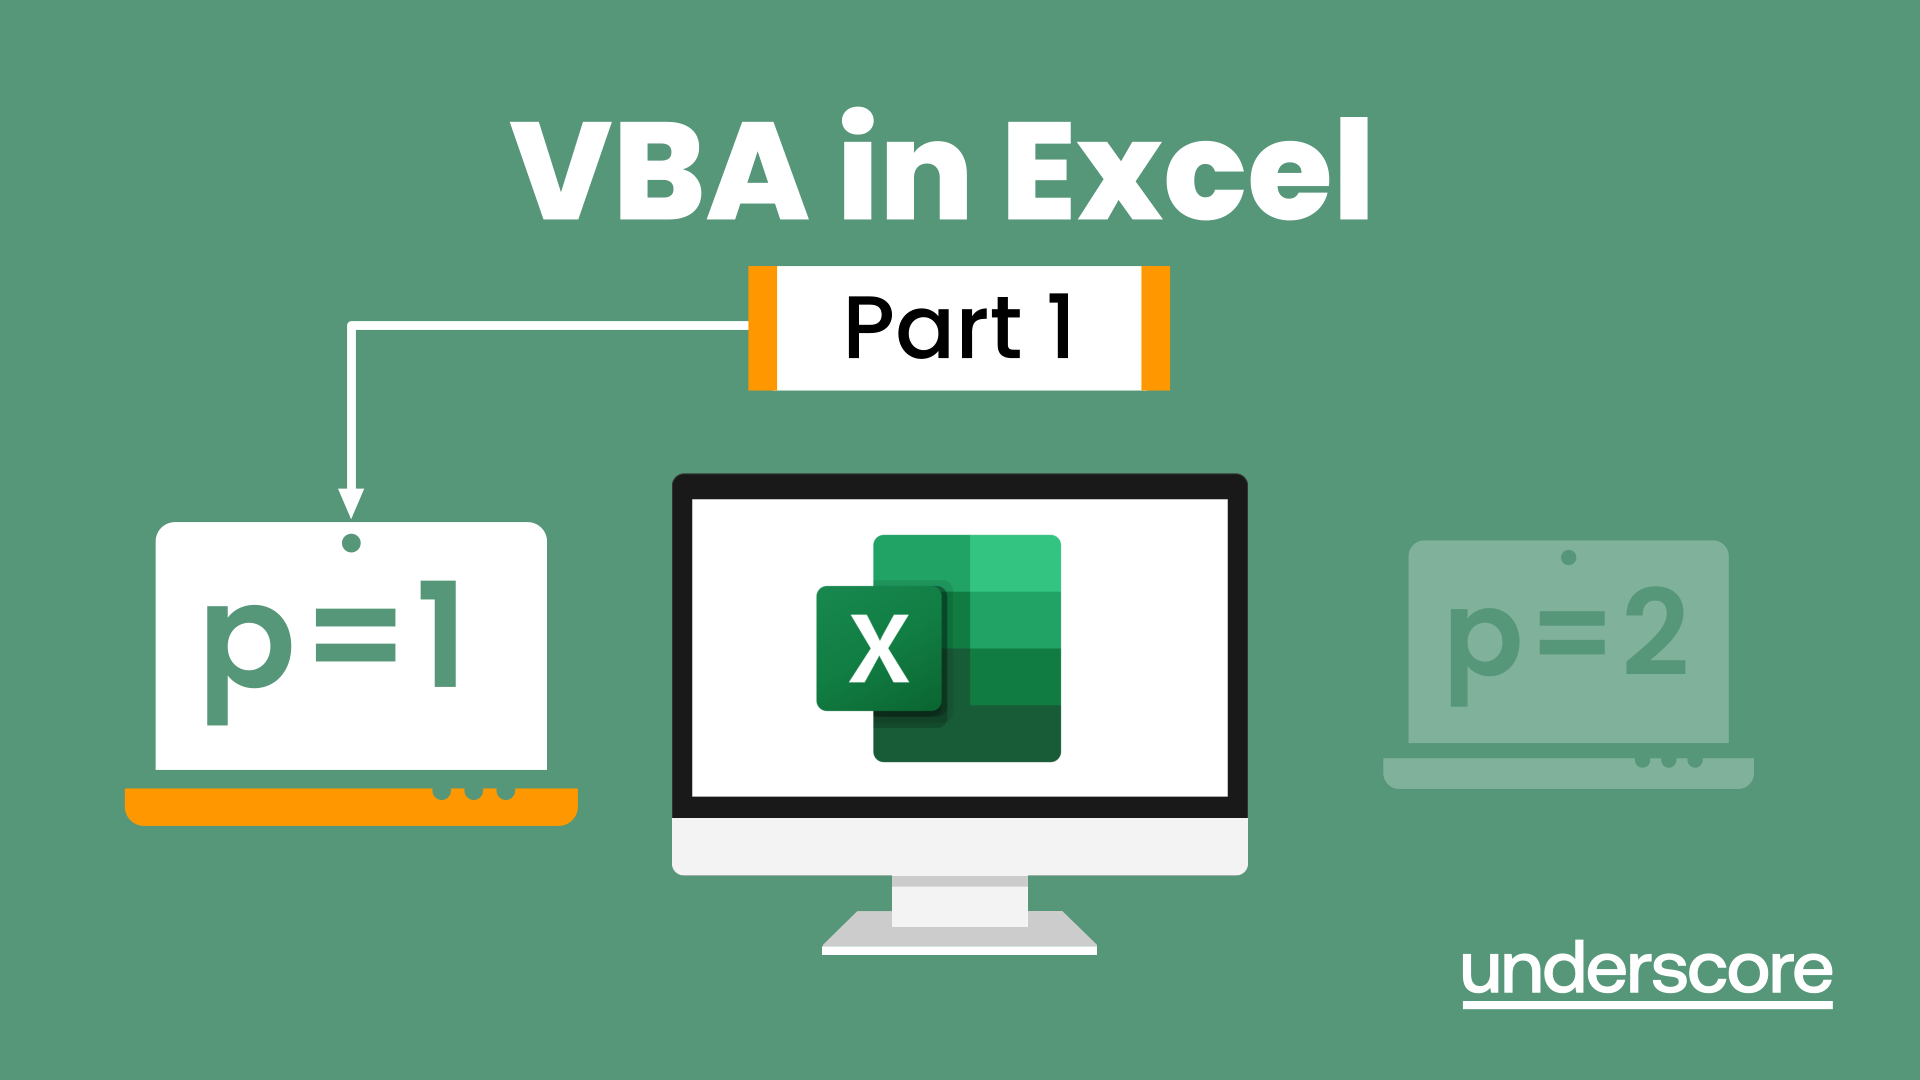
VBA in Excel - Part 1
By Underscore Group
Following on from the Macros course look at how you can write your own Visual Basic code within Excel to fully automate tasks and save time. Course overview Duration: 2 days (13 hours) Our VBA in Excel course is an introduction to using the Visual Basic for Applications language for programming in Excel. It looks at structures, syntax and coding standards. This course is designed for existing experienced users of Excel who can record and run macros and those who have dabbled in VBA but would like some formal training and help to put some structure to their code. Objectives By the end of the course you will be able to: Write visual basic procedures Create event and general procedures Use commands from the Excel data model Use statements and functions Use a selection of debugging tools Create and use variables and constants Use different types of loops Create an Excel user form Content The VBA environment Project explorer Excel objects Modules Properties window Code window Code structure Code structure Navigating within your code Adding comments Using WITH Steps to creating a VBA procedure Procedures Sub procedures Event procedures Calling procedures The Excel data model Workbook commands Worksheet commands Excel selection methods Data manipulation commands Debugging Using breakpoints Stepping through code The immediate window The watch window The locals window points Variables and Constants Declaring variables Declaring multiple variables Variable data types Concatenation Scope of variables Constants Declaring constants Using constants Scope of constants Looping Do while loops Do until loops For next loops Conditional Statements IF statement SELECT CASE statement Comparison statements Logical operators Creating a User Form Form layout The control toolbox Naming conventions Adding objects Naming objects Captions Displaying the form Object properties Object properties Setting properties at design time Setting properties at run time Interconnectivity between the user form and Excel Comparing values Transferring information Running code
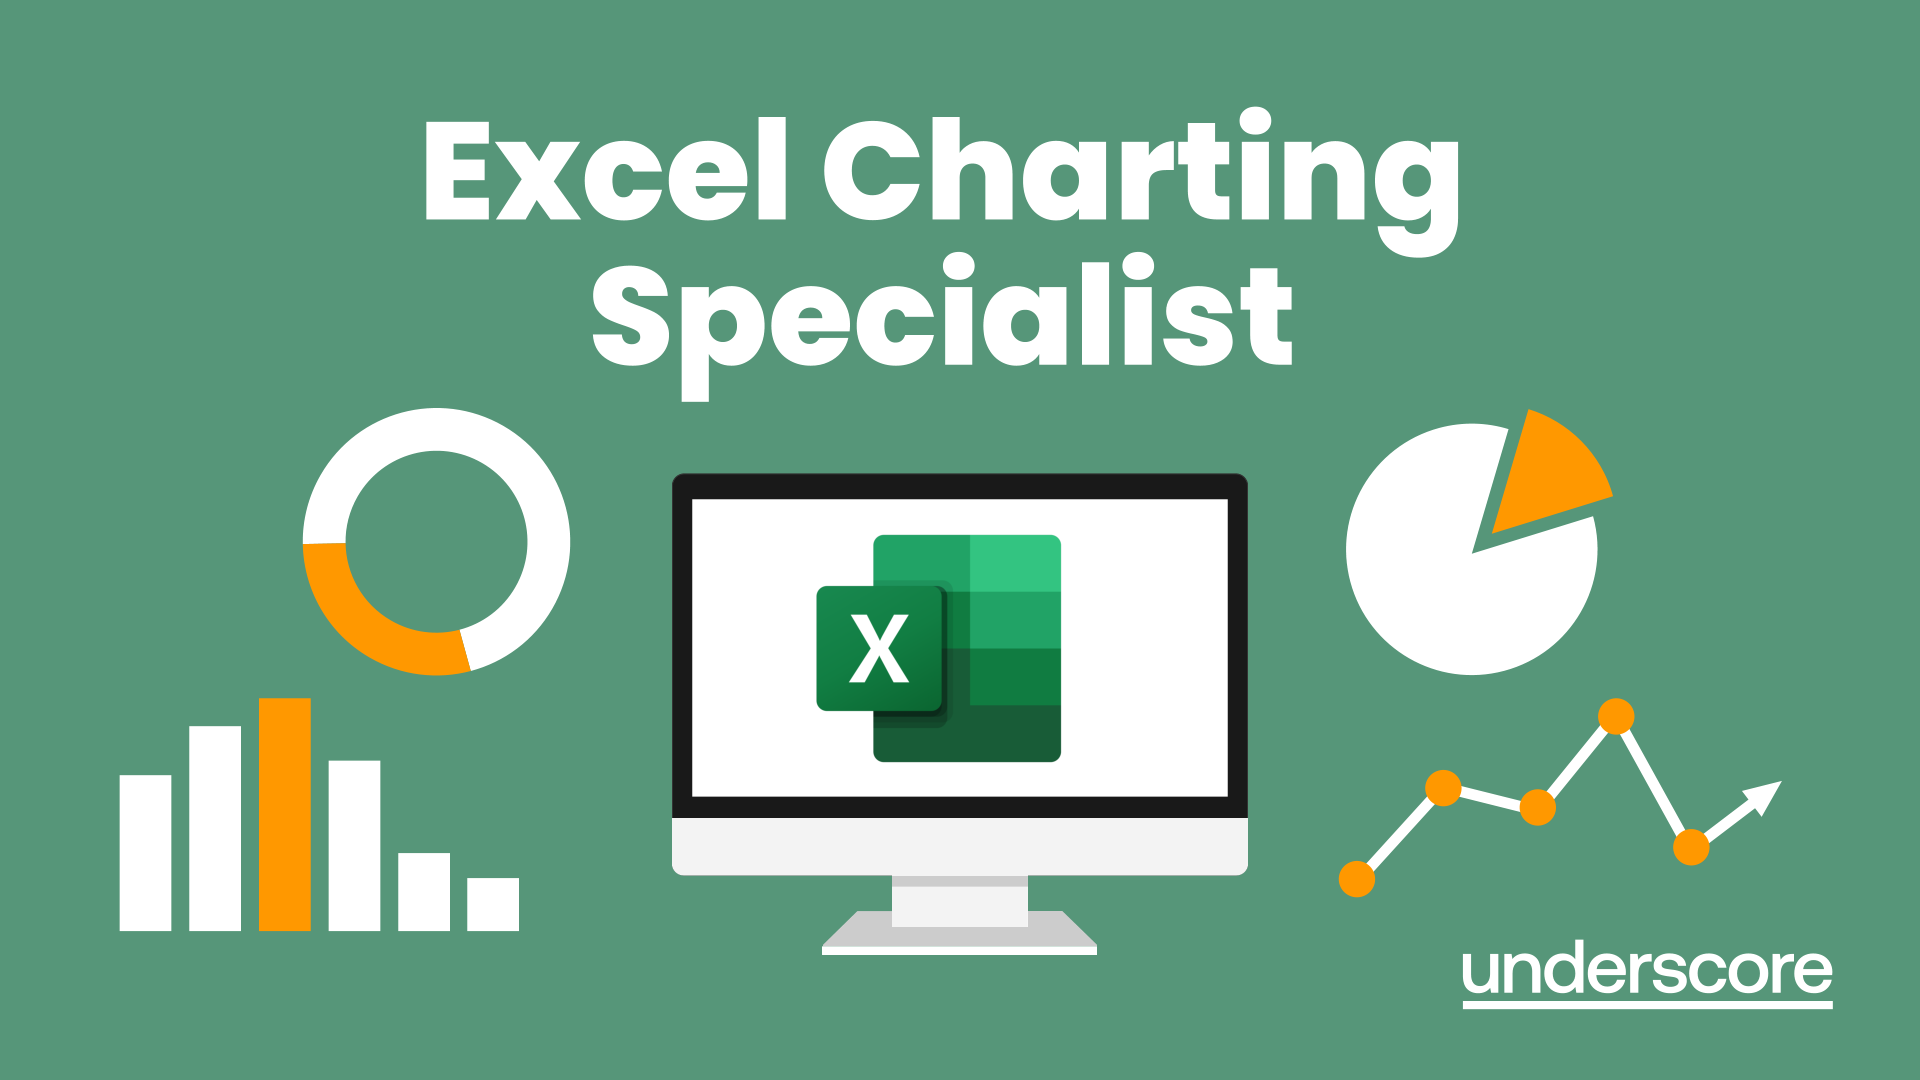
Excel Charting Specialist
By Underscore Group
Look at the in depth features of charts and some specialist tools to make your charts come to life. Course overview Duration: 1 day (6.5 hours) Our Excel Charting Specialist course examines how to unlock the full potential of Charts in Excel. It investigates the useful tools needed for creating bespoke Charts, allowing you to creatively present data more visually. By the end of the course, you will have an awareness of the tools used for creating more advanced Charts and will be able to create your own Dynamic Charts. The course is designed for existing users of Excel who are looking at more advanced ways to visualise data in Excel using Charts. Objectives By the end of the course you will be able to: Create and Amend Charts Format multiple areas of a Chart Use a Combo Chart Apply Conditional Formatting to a Chart Create Dynamic Charts Work with Custom Formatting Create an Advanced Dynamic Chart Content Creating and amending charts Creating Simple Charts Using the Chart Design tab Adding Chart Elements Changing the type of Chart Formatting charts Format Chart Area Format Data Series Format Data Point Format Axis Working with combo charts Adding additional data to a Chart Customising Chart types Creating Clustered Column/line Charts Applying conditional formatting on charts Using IF Statements Highlighting Max/Min Data points in Charts Using Series Overlap Dynamic charts Creating dynamic Target vs Actual Charts Introducing the NA function Hiding data used for Charts Custom formatting charts Formatting Data Labels Customising number formats Using Trend Arrows to show changes Editing Format Code Advanced dynamic charts Pivot Chart rules Creating a Pivot Chart Working with your Pivot Chart Creating calculations Combining all elements to create an Advanced Chart Using Error Bars to create a line Adding a scroll bar and linking with data
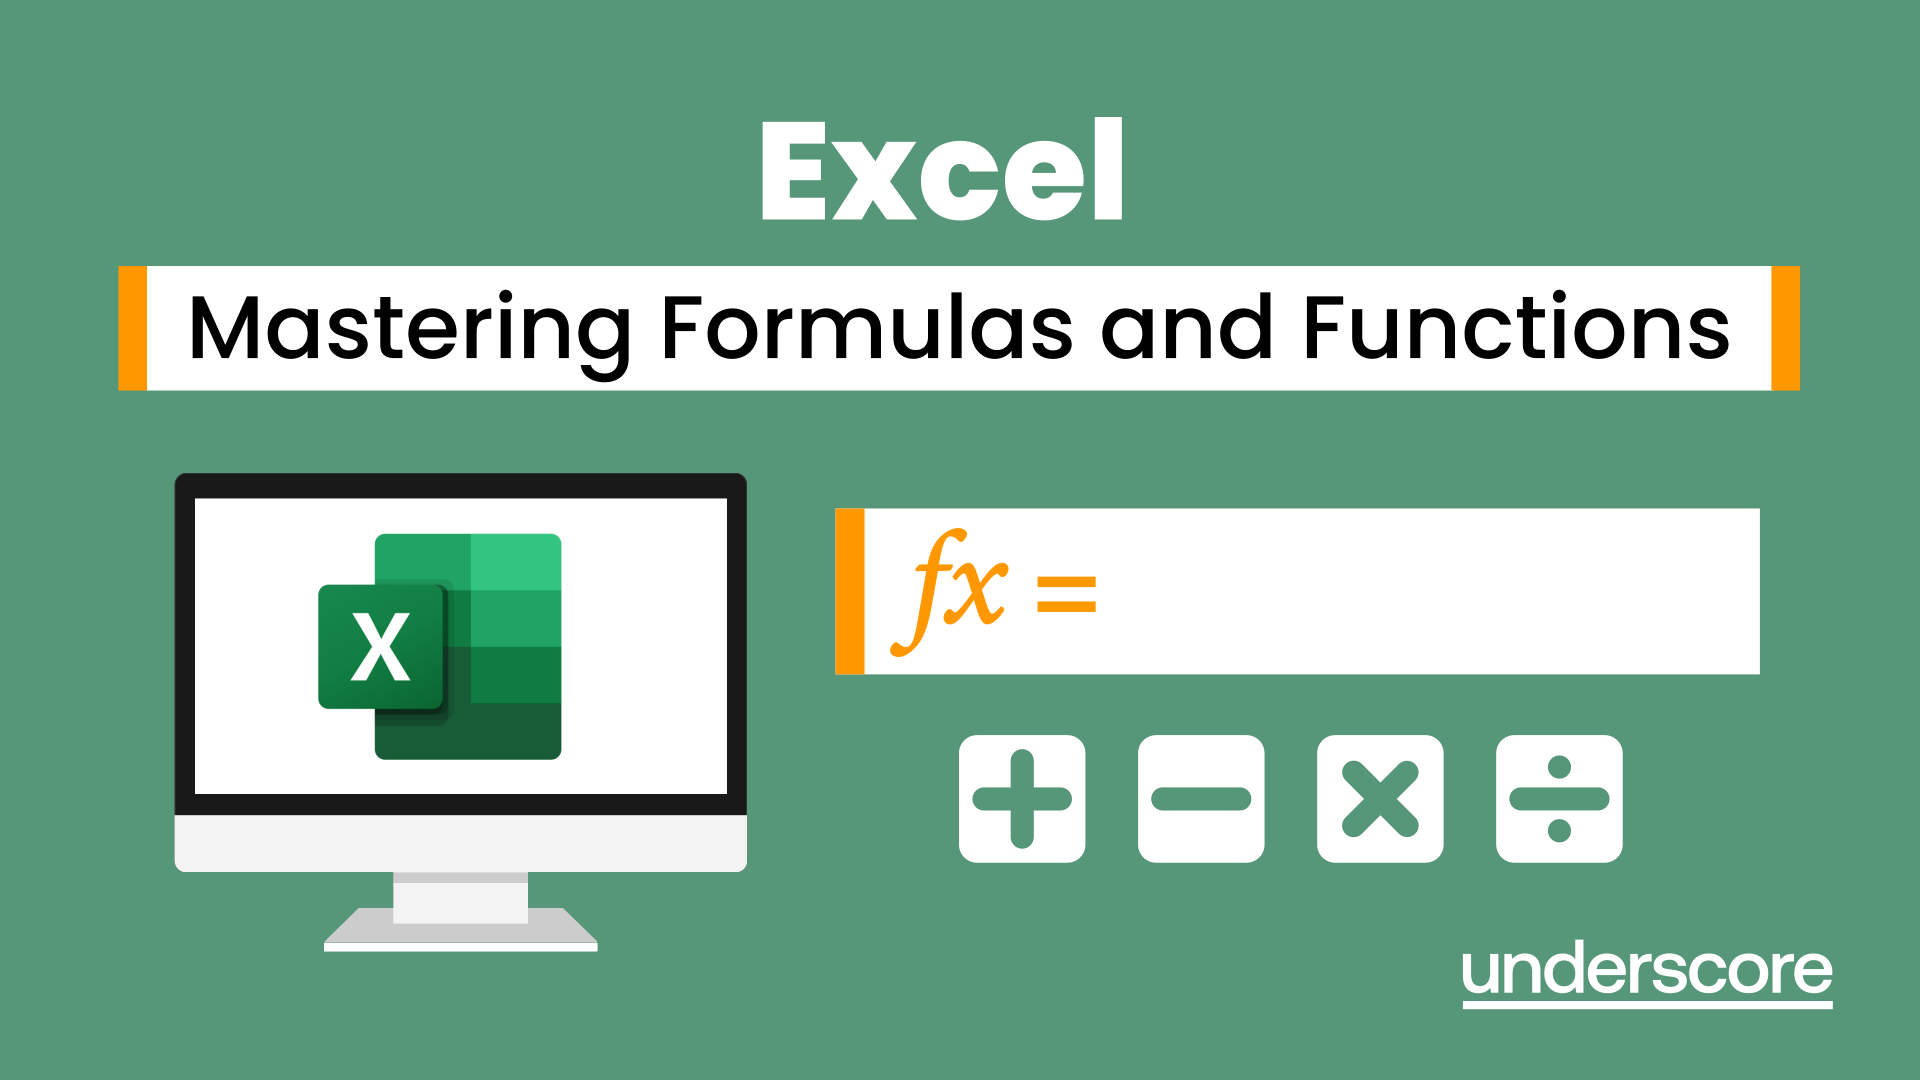
Excel - Mastering Formulas and Functions
By Underscore Group
Ideal for those already using Excel but who really want to get to grips with formulas and functions. Course overview Duration: 1 day (6.5 hours) Our Excel Mastering Formulas and Functions course looks at how to confidently use formulas and functions within Excel. It looks at how to correctly construct formulas and explains how to build common formulas such as working with percentages. It investigates a range of built in Excel functions and shows you how to use the formula auditing tools to help when things go wrong. This course is aimed at existing users of Excel who want to further their skills. Participants should be able to confidently create and amend worksheets. Objectives By the end of the course you will be able to: Construct Formulas Use a range of common Functions Work with absolute and relative references in formulas Create percentage calculations Use named ranges in formulas Use the XLOOKUP command Create formulas with date and use date functions Use formulas in conditional formatting Use a range of Count functions Use the formula auditing tools Content Formulas vs Functions Constructing formulas Using functions Common Excel functions Using the function wizard vs the formula bar Formulas in tables Absolute vs relative references in formulas Using absolute references in formulas Using partial absolute referencing Range Naming Naming ranges Using range names in formulas Single and multi-cell ranges Working with percentages Creating formulas with percentages Percentage breakdowns Percentage increases Formatting as a percentage Using Lookups Using XLOOKUP to insert information from other spreadsheets Calculating with dates Calculating with dates Using date functions Using formulas in conditional formatting Using conditional formulas Using functions in conditional formatting Count functions COUNT COUNTA COUNTBLANK Formula auditing Using the auditing facility Tracing how formulas are made up Tracing precedents and dependants Evaluating formulas Error checking Showing formulas on a sheet
Finance for Non Financial Managers
By Underscore Group
Learn the basics of financial awareness and better understand the language used by accountants and how financial statements fit together within organisations. Course overview Duration: 2 days (13 hours) This workshop will provide participants with a grasp of basic financial awareness, to help them to better understand the language used by accountants and how financial statements fit together. Training is done in a jargon-free way that is aimed building attendees’ confidence in using financial terms and concepts within their organisation. Competent financial management has many aspects, it is wide reaching and requires multiple skills but if participants work to become organised and effective in planning, these skills can be easily acquired. There is a misconception that to be a good operational manager dealing with financial decisions people must be accounting or numerical geniuses. There are basic skills that attendees can easily learn that will support them in those areas. Objectives By the end of the course you will be able to: Identify the importance of financial management and its impact Identify the link between financial information and decision making Set, manage, monitor and review budgets Analyse financial statements Demonstrate the link between the statements, budgets and decision making. Content Financial Management Budgeting process (generic / client specific if possible) Forecasting and re forecasting process The need for accurate forecasting Accrual v cash accounting revisited Financial Objectives of the business Users of the accounts Financial Tools Depreciation and Amortisation Accruals and Prepayments Deferred and Accrued Income Costs, Opex and Capex Financial Statements The Income Statement The Balance Sheet Understanding capital employed The relationship between balance sheet and income statement The cash flow statement Profitability: gross, operating and net margins Review of client’s management information reports Building the Business Case Break even analysis Discounted Cash Flow Discount factors Net Present Value (NPV) Internal Rate of Return (IRR)

Safeguarding Vulnerable Adults Level 1
By Prima Cura Training
This course provides detailed safeguarding adults & children awareness, including essential knowledge in the recognition and reporting of abuse and neglect, procedures and responsibilities. This is for all workforce involved in Social Care from the health, public, independent, or voluntary sectors. This subject forms standard 10 & 11 in The Care Certificate.

Risk Assessing
By Prima Cura Training
This course is designed to enable learners to increase their understanding of risk assessment and risk management in Health and Social Care settings.