- Professional Development
- Medicine & Nursing
- Arts & Crafts
- Health & Wellbeing
- Personal Development
18 Data Visualization courses


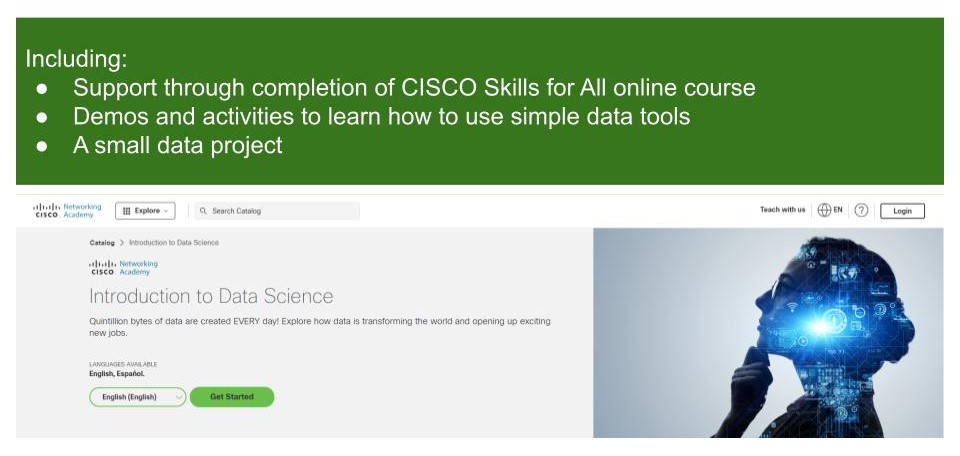
Introduction to Data Science
By futureCoders SE
Learn the basics of Data Science, combining a supported #CISCO Skills for All online course with practical learning and a project to help consolidate the learning.

Are you looking to enter the dynamic world of real estate? Our course is designed to equip you with the knowledge and tools you need to communicate effectively with real estate professionals and develop key skills in real estate investment strategy and analytics. At the end of the course, you'll be able to read and interpret real estate market reports, and have a firm grasp of how iconic buildings, cities, and companies fit into the overall picture of the real estate sector. On this course, you will… Become familiar with the players, structure, general terminology and overall needs of Real Estate. Learn what is Real Estate and why it is different from other asset classes Get to grips with the overall size and structure of the UK Real Estate Market Learn and analyse the links between the different parts of the property market Understand who works in the Real Estate Market, their qualifications and their job descriptions Recognise how and when to use basic real estate concepts: Rent, Value, Yield, Risk and Return, etc… Learn how to read a real estate market report Understand how current affairs, politics and economics affects Real Estate Investment Use household names and iconic companies, cities and buildings to help consolidate your appreciation of this exciting sector Who will benefit from this course: Graduates or undergraduates studying economics, finance. Professionals working in Marketing or Accounting teams within Real Estate firms. APC students. Anyone interested in Real Estate. School leavers/A-Level Students looking to gain an understanding of Real Estate. Non cognate students who wish to transfer into Real Estate/Finance careers. Course Outline Module 1: What is and why buy Real Estate? The property Market The Size and Structure of the UK property market The impact of Real Estate in the Economy Module 2: The Real Estate Market System The Space Market The Asset Market The Development Market Module 3: How to value Real Estate An Introduction to Financial Mathematics The difference between Price, Value and Worth Property Yield Conventional Valuation Methods Module 4: How to read a Real Estate Market Report Property Market Indicators: Stock Indicators Property Market Indicators: Investment Indicators Module 5: Who works in Real Estate? The build Environment by Cobalt Recruitment Rea; Estate Agents Examples of Real Estate Market Agents CVs Real Estate Network

Power BI - dashboards (1 day) (In-House)
By The In House Training Company
Power BI is a powerful data visualisation program that allows businesses to monitor data, analyse trends, and make decisions. This course is designed to provide a solid understanding of the reporting side of Power BI, the dashboards, where administrators, and end users can interact with dynamic visuals that communicates information. This course focuses entirely on the creation and design of visualisations in dashboards, including a range of chart types, engaging maps, and different types of tables. Designing dashboards with KPI's (key performance indicators), heatmaps, flowcharts, sparklines, and compare multiple variables with trendlines. This one-day programme focuses entirely on creating dashboards, by using the many visualisation tools available in Power BI. You will learn to build dynamic, user-friendly interfaces in both Power BI Desktop and Power BI Service. 1 Introduction Power BI ecosystem Things to keep in mind Selecting dashboard colours Importing visuals into Power BI Data sources for your analysis Joining tables in Power BI 2 Working with data Utilising a report theme Table visuals Matrix visuals Drilling into hierarchies Applying static filters Group numbers with lists Group numbers with bins 3 Creating visuals Heatmaps in Power BI Visualising time-intelligence trends Ranking categorical totals Comparing proportions View trends with sparklines 4 Comparing variables Insert key performance indicators (KPI) Visualising trendlines as KPI Forecasting with trendlines Visualising flows with Sankey diagrams Creating a scatter plot 5 Mapping options Map visuals Using a filled map Mapping with latitude and longitude Mapping with ArcGIS or ESRI 6 Creating dashboards High-level dashboard Migration analysis dashboard Adding slicers for filtering Promote interaction with nudge prompts Searching the dashboard with a slicer Creating dynamic labels Highlighting key points on the dashboard Customised visualisation tooltips Syncing slicers across pages 7 Sharing dashboards Setting up and formatting phone views Exporting data Creating PDF files Uploading to the cloud Share dashboards in SharePoint online