- Professional Development
- Medicine & Nursing
- Arts & Crafts
- Health & Wellbeing
- Personal Development
49 Data Analysis courses
Power BI - intermediate (2 day) (In-House)
By The In House Training Company
This course is designed for those already using Power BI Desktop and are ready to work with more comprehensive elements of analysing and reporting in Power BI. The course maintains a balanced look at data analysis including the Power Query Editor, with a deep dive into writing DAX formulas, and enhanced dashboard visualisations. The aim of this course is to provide a more complete understanding of the whole Power BI analytics process, by working with business examples that will equip you with the necessary skills to output comprehensive reports and explore Power BI's analytical capabilities in more depth. 1 The Query Editor Grouping rows in a table Split row by delimiter Add days to determine deadlines The query editor 2 Fuzzy Matching Joins Matching inconsistencies by percentage Matching with transformation table 3 The Query Editor M Functions Adding custom columns Creating an IF function Nested AND logics in an IF function 4 DAX New Columns Functions Including TRUE with SWITCH Using multiple conditions The FIND DAX function The IF DAX function Logical functions IF, AND, OR 5 Editing DAX Measures Making DAX easier to read Add comments to a measure Using quick measures 6 The Anatomy of CALCULATE Understanding CALCULATE filters Add context to CALCULATE with FILTER Using CALCULATE with a threshold 7 The ALL Measure Anatomy of ALL Create an ALL measure Using ALL as a filter Use ALL for percentages 8 DAX Iterators Anatomy of iterators A closer look at SUMX Using RELATED with SUMX Create a RANKX RANKX with ALL 9 Date and Time Functions Overview of functions Create a DATEDIFF function 10 Time Intelligent Measures Compare historical monthly data Create a DATEADD measure Creating cumulative totals Creating cumulative measures Visualising cumulative totals 11 Visualisations In-Depth Utilising report themes Applying static filters Group data using lists Group numbers using bins Creating heatmaps Comparing proportions View trends with sparklines 12 Comparing Variables Visualising trendlines as KPI Forecasting with trendlines Creating a scatter plot Creating dynamic labels Customised visualisation tooltips Export reports to SharePoint


Understanding Key Principles of Real Estate Modelling (Advanced Theoretical Course)
(5)By Bayfield Training
On this course, we will use case studies to enhance the delegates understanding of Real Estate financial appraisals, and help them fully appreciate the theory behind the numbers.

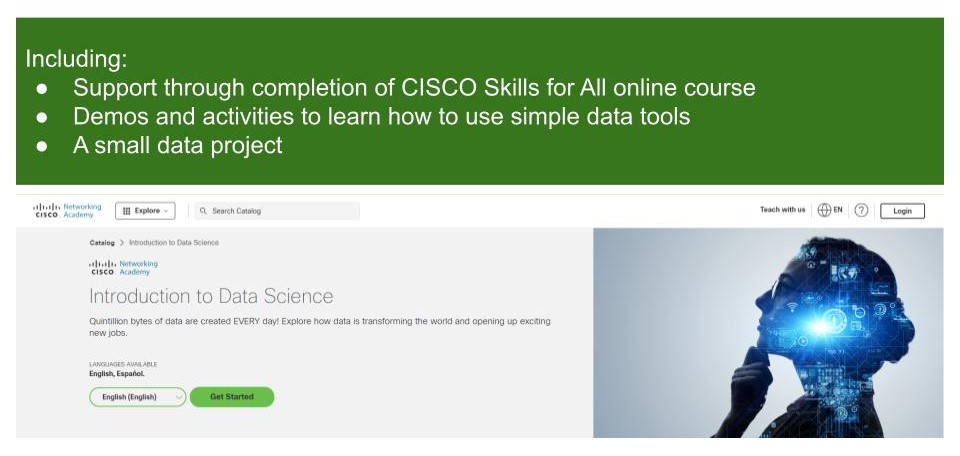
Introduction to Data Science
By futureCoders SE
Learn the basics of Data Science, combining a supported #CISCO Skills for All online course with practical learning and a project to help consolidate the learning.

Are you looking to enter the dynamic world of real estate? Our course is designed to equip you with the knowledge and tools you need to communicate effectively with real estate professionals and develop key skills in real estate investment strategy and analytics. At the end of the course, you'll be able to read and interpret real estate market reports, and have a firm grasp of how iconic buildings, cities, and companies fit into the overall picture of the real estate sector. On this course, you will… Become familiar with the players, structure, general terminology and overall needs of Real Estate. Learn what is Real Estate and why it is different from other asset classes Get to grips with the overall size and structure of the UK Real Estate Market Learn and analyse the links between the different parts of the property market Understand who works in the Real Estate Market, their qualifications and their job descriptions Recognise how and when to use basic real estate concepts: Rent, Value, Yield, Risk and Return, etc… Learn how to read a real estate market report Understand how current affairs, politics and economics affects Real Estate Investment Use household names and iconic companies, cities and buildings to help consolidate your appreciation of this exciting sector Who will benefit from this course: Graduates or undergraduates studying economics, finance. Professionals working in Marketing or Accounting teams within Real Estate firms. APC students. Anyone interested in Real Estate. School leavers/A-Level Students looking to gain an understanding of Real Estate. Non cognate students who wish to transfer into Real Estate/Finance careers. Course Outline Module 1: What is and why buy Real Estate? The property Market The Size and Structure of the UK property market The impact of Real Estate in the Economy Module 2: The Real Estate Market System The Space Market The Asset Market The Development Market Module 3: How to value Real Estate An Introduction to Financial Mathematics The difference between Price, Value and Worth Property Yield Conventional Valuation Methods Module 4: How to read a Real Estate Market Report Property Market Indicators: Stock Indicators Property Market Indicators: Investment Indicators Module 5: Who works in Real Estate? The build Environment by Cobalt Recruitment Rea; Estate Agents Examples of Real Estate Market Agents CVs Real Estate Network

Tableau Desktop Training - Foundation
By Tableau Training Uk
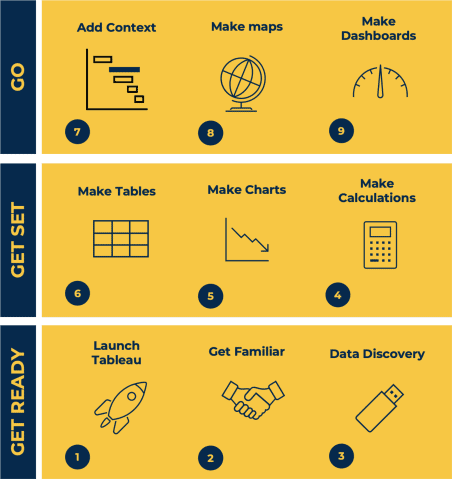
This Tableau Desktop Training course is a jumpstart to getting report writers and analysts with little or no previous knowledge to being productive. It covers everything from connecting to data, through to creating interactive dashboards with a range of visualisations in two days of your time. For Private options, online or in-person, please send us details of your requirements: This Tableau Desktop Training course is a jumpstart to getting report writers and analysts with little or no previous knowledge to being productive. It covers everything from connecting to data, through to creating interactive dashboards with a range of visualisations in two days of your time. Having a quick turnaround from starting to use Tableau, to getting real, actionable insights means that you get a swift return on your investment of time and money. This accelerated approach is key to getting engagement from within your organisation so everyone can immediately see and feel the impact of the data and insights you create. This course is aimed at someone who has not used Tableau in earnest and may be in a functional role, eg. in sales, marketing, finance, operations, business intelligence etc. The course is split into 3 phases and 9 modules: PHASE 1: GET READY MODULE 1: LAUNCH TABLEAU Check Install & Setup Why is Visual Analytics Important MODULE 2: GET FAMILIAR What is possible How does Tableau deal with data Know your way around How do we format charts Dashboard Basics – My First Dashboard MODULE 3: DATA DISCOVERY Connecting to and setting up data in Tableau How Do I Explore my Data – Filters & Sorting How Do I Structure my Data – Groups & Hierarchies, Visual Groups How Tableau Deals with Dates – Using Discrete and Continuous Dates, Custom Dates Phase 2: GET SET MODULE 4: MAKE CALCULATIONS How Do I Create Calculated Fields & Why MODULE 5: MAKE CHARTS Charts that Compare Multiple Measures – Measure Names and Measure Values, Shared Axis Charts, Dual Axis Charts, Scatter Plots Showing Relational & Proportional Data – Pie Charts, Donut Charts, Tree Maps MODULE 6: MAKE TABLES Creating Tables – Creating Tables, Highlight Tables, Heat Maps Phase 3: GO MODULE 7: ADD CONTEXT Reference Lines and Bands MODULE 8: MAKE MAPS Answering Spatial Questions – Mapping, Creating a Choropleth (Filled) Map MODULE 9: MAKE DASHBOARDS Using the Dashboard Interface Dashboard Actions This training course includes over 25 hands-on exercises and quizzes to help participants “learn by doing” and to assist group discussions around real-life use cases. Each attendee receives a login to our extensive training portal which covers the theory, practical applications and use cases, exercises, solutions and quizzes in both written and video format. Students must use their own laptop with an active version of Tableau Desktop 2018.2 (or later) pre-installed. What People Are Saying About This Course “Excellent Trainer – knows his stuff, has done it all in the real world, not just the class room.”Richard L., Intelliflo “Tableau is a complicated and powerful tool. After taking this course, I am confident in what I can do, and how it can help improve my work.”Trevor B., Morrison Utility Services “I would highly recommend this course for Tableau beginners, really easy to follow and keep up with as you are hands on during the course. Trainer really helpful too.”Chelsey H., QVC “He is a natural trainer, patient and very good at explaining in simple terms. He has an excellent knowledge base of the system and an obvious enthusiasm for Tableau, data analysis and the best way to convey results. We had been having difficulties in the business in building financial reports from a data cube and he had solutions for these which have proved to be very useful.”Matthew H., ISS Group
Developing the Business Case
By IIL Europe Ltd
Developing the Business Case Business analysts must be able to create business case documents that highlight project benefits, costs, and risks. The business case is based on the real business need to be solved. These become parts of proposals, feasibility studies, and other decision support documents. This course teaches the purpose, structure, and content of a business case. It presents the basic techniques for determining financial ROI, non-tangible benefits, and the probability of meeting expectations. What you will Learn At the end of this program, you will be able to: Perform feasibility studies Justify the business investment to solve the business problem Prepare an effective business case document Plan and implement a business case approval process Foundation Concepts The role of the BA An introduction to the BABOK® Guide The business analyst and the product / project life cycle (PLC) The business case deliverable Introducing the Business Case Process The BA and strategy analysis The BA and the business case process (BCP) The BA during the business case process (BCP) The BA after the business case process (BCP) Importance of defining solution performance metrics Defining the Business Need Overview of defining the business need Business needs: problem / opportunity statement Product vision Objectives and constraints Exploring Business Case Solutions Overview of exploring solutions Solution identification for feasibility Solution definition for analysis Assessing project risks Justifying the Business Case Overview of justifying the business case Qualitative justification Quantitative justification Approving the Business Case Overview of business case approval Developing recommendations Preparing the decision package - documents Preparing the decision package - presentations

Business Analysis Fundamentals
By IIL Europe Ltd
Business Analysis Fundamentals This course is part of IIL's Business Analysis Certificate Program (BACP), a program designed to help prepare individuals to pass the IIBA® Certification exam to become a Certified Business Analysis Professional (CBAP™). This course teaches participants the overall process of business analysis and where it fits in the bigger picture of the project life cycle and the business context. The course is interactive and combines discussion, active workshops, and demonstrations of techniques. The goal is bottom-line results that cut through the real-world problems facing people seeking to improve the way they operate to develop new and improved systems and products or otherwise deliver results through project performance. What you will Learn At the end of this program, you will be able to: Define the solution scope Work with the development team in the systems testing stage Ensure the solution is usable in the business environment Foundation Concepts Defining the business analyst (BA) function The role of the BA as change agent An introduction to the BABOK® Guide BA roles and relationships through the project life cycle (PLC) Business Analysis Planning and Monitoring Overview of business analysis planning and monitoring (BAP&M) Business analysis planning and monitoring - process and tools Business analysis planning and monitoring - roles and responsibilities Business analysis planning and monitoring - governance, information management, and performance improvement Elicitation and Collaboration Overview of elicitation and collaboration Elicitation and collaboration techniques Requirements Life Cycle Management Overview of requirements life cycle management Requirements life cycle management task details Strategy Analysis Overview of strategy analysis Analyze current state Define future state Assess risks Define change strategy Requirements Analysis and Design Definition Overview of requirements analysis and design definition (RA&DD) The anatomy of requirements RA&DD task descriptions RA&DD techniques Solution Evaluation Overview of solution evaluation Solution evaluation tasks Solution evaluation in development stages Underlying Competencies Overview of underlying competencies (UC) Underlying competencies