- Professional Development
- Medicine & Nursing
- Arts & Crafts
- Health & Wellbeing
- Personal Development
Data Analysis and Visualization with Microsoft Excel
By Mpi Learning - Professional Learning And Development Provider
This course is designed for students who already have foundational knowledge and skills in Excel and who wish to perform robust and advanced data and statistical analysis with Microsoft Excel using PivotTables, use tools such as Power Pivot and the Data Analysis ToolPak to analyze data and visualize data and insights using advanced visualizations in charts and dashboards in Excel.

Introduction to WordPress
By Platform Training
This beginner's WordPress course will enable you to create your own website using the world's favourite content management system. The user friendly web based software enables you to quickly and easily get your website up and running. This one day course will teach you how to write, edit and manage your WordPress site and also to use image, audio and video content. Whether you are seeking to learn WordPress for your own personal posts or for business and marketing purposes this course will get you up and running right away.

Power BI - dashboards (1 day) (In-House)
By The In House Training Company
Power BI is a powerful data visualisation program that allows businesses to monitor data, analyse trends, and make decisions. This course is designed to provide a solid understanding of the reporting side of Power BI, the dashboards, where administrators, and end users can interact with dynamic visuals that communicates information. This course focuses entirely on the creation and design of visualisations in dashboards, including a range of chart types, engaging maps, and different types of tables. Designing dashboards with KPI's (key performance indicators), heatmaps, flowcharts, sparklines, and compare multiple variables with trendlines. This one-day programme focuses entirely on creating dashboards, by using the many visualisation tools available in Power BI. You will learn to build dynamic, user-friendly interfaces in both Power BI Desktop and Power BI Service. 1 Introduction Power BI ecosystem Things to keep in mind Selecting dashboard colours Importing visuals into Power BI Data sources for your analysis Joining tables in Power BI 2 Working with data Utilising a report theme Table visuals Matrix visuals Drilling into hierarchies Applying static filters Group numbers with lists Group numbers with bins 3 Creating visuals Heatmaps in Power BI Visualising time-intelligence trends Ranking categorical totals Comparing proportions View trends with sparklines 4 Comparing variables Insert key performance indicators (KPI) Visualising trendlines as KPI Forecasting with trendlines Visualising flows with Sankey diagrams Creating a scatter plot 5 Mapping options Map visuals Using a filled map Mapping with latitude and longitude Mapping with ArcGIS or ESRI 6 Creating dashboards High-level dashboard Migration analysis dashboard Adding slicers for filtering Promote interaction with nudge prompts Searching the dashboard with a slicer Creating dynamic labels Highlighting key points on the dashboard Customised visualisation tooltips Syncing slicers across pages 7 Sharing dashboards Setting up and formatting phone views Exporting data Creating PDF files Uploading to the cloud Share dashboards in SharePoint online

SSRS Report Builder Course Summary. Practical SSRS Report Builder course, to leavy you full conversant with queries, DML and DDL statements. Hands-on, Practical SSRS course. PCWorkshops SSRS Course Certificate. Max 4 people per course, we keep it personalised. Where is the SSRS Report Builder Course? Online: Instructor-led. Classroom: Request per email. SSRS Course Materials SSRS Coding Examples Manuals and Notes: In-depth reference materials Exercises: Practical exercises Payment Options → £600, Follow the booking link Arrange for installments Included with SSRS Report Builder Course: SSRS Course Certificate on completion. SSRS Course Manual. Practical SSRS Course exercises. SSRS Code Samples. After the course, 1 free session for questions. Max group size, online and in classroom, on this SSRS Course is 4. Course Topics SSRS Report Builder Course Topics SSRS Course topics: This course focus on producing reports using MS SQL SSRS Report Builder, to use the product features and tools related to data retrieval, visualisations and deployment. The Target Audience: end-users who will produce reports for their department or group using datasets. SSRS Course Topics Report Models: Data source views Creating a model Entities, attributes and roles Tables: Creating tables Interactive sorting Floating headers Grouping: Inserting groups Group headers/footers Displaying group totals Expanding and collapsing Expressions: The expression builder The Report Items collection Built-in fields Conditional formatting expressions Page headers and footers Page names and numbers Exporting reports: The various report formats Using RenderFormat. Parameters: Creating parameters Filtering using parameters Drop list parameters Coping with empty tables Matrices: Row and column groups Sorting and filtering matrices Creating subtotals Charts: Creating charts The parts of a chart Formatting charts Basic reports: Text boxes and images Selecting report items Formatting parts of a report Miniature charts Creating sparklines Creating data bars Graphical indicators Creating and customising indicators Linear and radial gauges Lists: Page-per-record lists Dashboard lists Other list ideas Subreports: Creating a child report Creating the main report Linking the two reports Report parts: Publishing report parts The report part gallery Updating report parts Book the SSRS Course About us Our experienced trainers are award winners. More about us FAQ's Client Comments

SSRS Report Builder Course Summary. Practical SSRS Report Builder course, to leavy you full conversant with queries, DML and DDL statements. Hands-on, Practical SSRS course. PCWorkshops SSRS Course Certificate. Max 4 people per course, we keep it personalised. Where is the SSRS Report Builder Course? Online: Instructor-led. Classroom: Request per email. SSRS Course Materials SSRS Coding Examples Manuals and Notes: In-depth reference materials Exercises: Practical exercises Payment Options → £600, Follow the booking link Arrange for installments Included with SSRS Report Builder Course: SSRS Course Certificate on completion. SSRS Course Manual. Practical SSRS Course exercises. SSRS Code Samples. After the course, 1 free session for questions. Max group size, online and in classroom, on this SSRS Course is 4. Course Topics SSRS Report Builder Course Topics SSRS Course topics: This course focus on producing reports using MS SQL SSRS Report Builder, to use the product features and tools related to data retrieval, visualisations and deployment. The Target Audience: end-users who will produce reports for their department or group using datasets. SSRS Course Topics Report Models: Data source views Creating a model Entities, attributes and roles Tables: Creating tables Interactive sorting Floating headers Grouping: Inserting groups Group headers/footers Displaying group totals Expanding and collapsing Expressions: The expression builder The Report Items collection Built-in fields Conditional formatting expressions Page headers and footers Page names and numbers Exporting reports: The various report formats Using RenderFormat. Parameters: Creating parameters Filtering using parameters Drop list parameters Coping with empty tables Matrices: Row and column groups Sorting and filtering matrices Creating subtotals Charts: Creating charts The parts of a chart Formatting charts Basic reports: Text boxes and images Selecting report items Formatting parts of a report Miniature charts Creating sparklines Creating data bars Graphical indicators Creating and customising indicators Linear and radial gauges Lists: Page-per-record lists Dashboard lists Other list ideas Subreports: Creating a child report Creating the main report Linking the two reports Report parts: Publishing report parts The report part gallery Updating report parts Book the SSRS Course About us Our experienced trainers are award winners. More about us FAQ's Client Comments
Tableau Desktop Training - Analyst
By Tableau Training Uk
This Tableau Desktop Training intermediate course is designed for the professional who has a solid foundation with Tableau and is looking to take it to the next level. For Private options, online or in-person, please send us details of your requirements: This Tableau Desktop training intermediate course is designed for the professional who has a solid foundation with Tableau and is looking to take it to the next level. Attendees should have a good understanding of the fundamental concepts of building Tableau worksheets and dashboards typically achieved from having attended our Tableau Desktop Foundation Course. At the end of this course you will be able to communicate insights more effectively, enabling your organisation to make better decisions, quickly. The Tableau Desktop Analyst training course is aimed at people who are used to working with MS Excel or other Business Intelligence tools and who have preferably been using Tableau already for basic reporting. The course is split into 3 phases and 9 modules: Phase 1: AMPLIFY MODULE 1: CHECK ABILITIES Revision – What I Should Know What is possibleHow does Tableau deal with dataKnow your way aroundHow do we format chartsHow Tableau deals with datesCharts that compare multiple measuresCreating Tables MODULE 2: COMBINE DATA Relationships Joining Tables – Join Types, Joining tables within the same database, cross database joins, join calculations Blending – How to create a blend with common fields, Custom defined Field relationships and mismatched element names, Calculated fields in blended data sources Unions – Manual Unions and mismatched columns, Wildcard unions Data Extracts – Creating & Editing Data extracts MODULE 3: ADVANCED CALCULATIONS Row Level v Aggregations Aggregating dimensions in calculations Changing the Level of Detail (LOD) of calculations – What, Why, How Adding Table Calculations Phase 2: ANALYSE MODULE 4: EXPAND APPLICATION Making things dynamic with parameters Sets Trend Lines How do we format charts Forecasting MODULE 5: ADVANCED MAPPING Using your own images for spatial analysis Mapping with Spatial files MODULE 6: DATA COMPARISONS Advanced Charts Bar in Bar charts Bullet graphs Creating Bins and Histograms Creating a Box & Whisker plot Phase 3: ACT MODULE 7: ADVANCED DASHBOARDS Using the dashboard interface and Device layout Dashboard Actions and Viz In tooltips Horizontal & Vertical containers Navigate between dashboards MODULE 8: PRESENT STORIES Telling data driven stories MODULE 9: ENABLE DECISIONS What is Tableau Server Publishing & Permissions How can your users engage with content This training course includes over 25 hands-on exercises and quizzes to help participants “learn by doing” and to assist group discussions around real-life use cases. Each attendee receives a login to our extensive training portal which covers the theory, practical applications and use cases, exercises, solutions and quizzes in both written and video format. Students must bring their own laptop with an active version of Tableau Desktop 2018.2 (or later) pre-installed. What People Are Saying About This Course “Course was fantastic, and completely relevant to the work I am doing with Tableau. I particularly liked Steve’s method of teaching and how he applied the course material to ‘real-life’ use-cases.”Richard W., Dashboard Consulting Ltd “This course was extremely useful and excellent value. It helped me formalise my learning and I have taken a lot of useful tips away which will help me in everyday work.” Lauren M., Baillie Gifford “I would definitely recommend taking this course if you have a working knowledge of Tableau. Even the little tips Steve explains will make using Tableau a lot easier. Looking forward to putting what I’ve learned into practice.”Aron F., Grove & Dean “Steve is an excellent teacher and has a vast knowledge of Tableau. I learned a huge amount over the two days that I can immediately apply at work.”John B., Mporium “Steve not only provided a comprehensive explanation of the content of the course, but also allowed time for discussing particular business issues that participants may be facing. That was really useful as part of my learning process.”Juan C., Financial Conduct Authority “Course was fantastic, and completely relevant to the work I am doing with Tableau. I particularly liked Steve’s method of teaching and how he applied the course material to ‘real-life’ use-cases.”Richard W., Dashboard Consulting Ltd “This course was extremely useful and excellent value. It helped me formalise my learning and I have taken a lot of useful tips away which will help me in everyday work.” Lauren M., Baillie Gifford “I would definitely recommend taking this course if you have a working knowledge of Tableau. Even the little tips Steve explains will make using Tableau a lot easier. Looking forward to putting what I’ve learned into practice.”Aron F., Grove & Dean “Steve is an excellent teacher and has a vast knowledge of Tableau. I learned a huge amount over the two days that I can immediately apply at work.”John B., Mporium
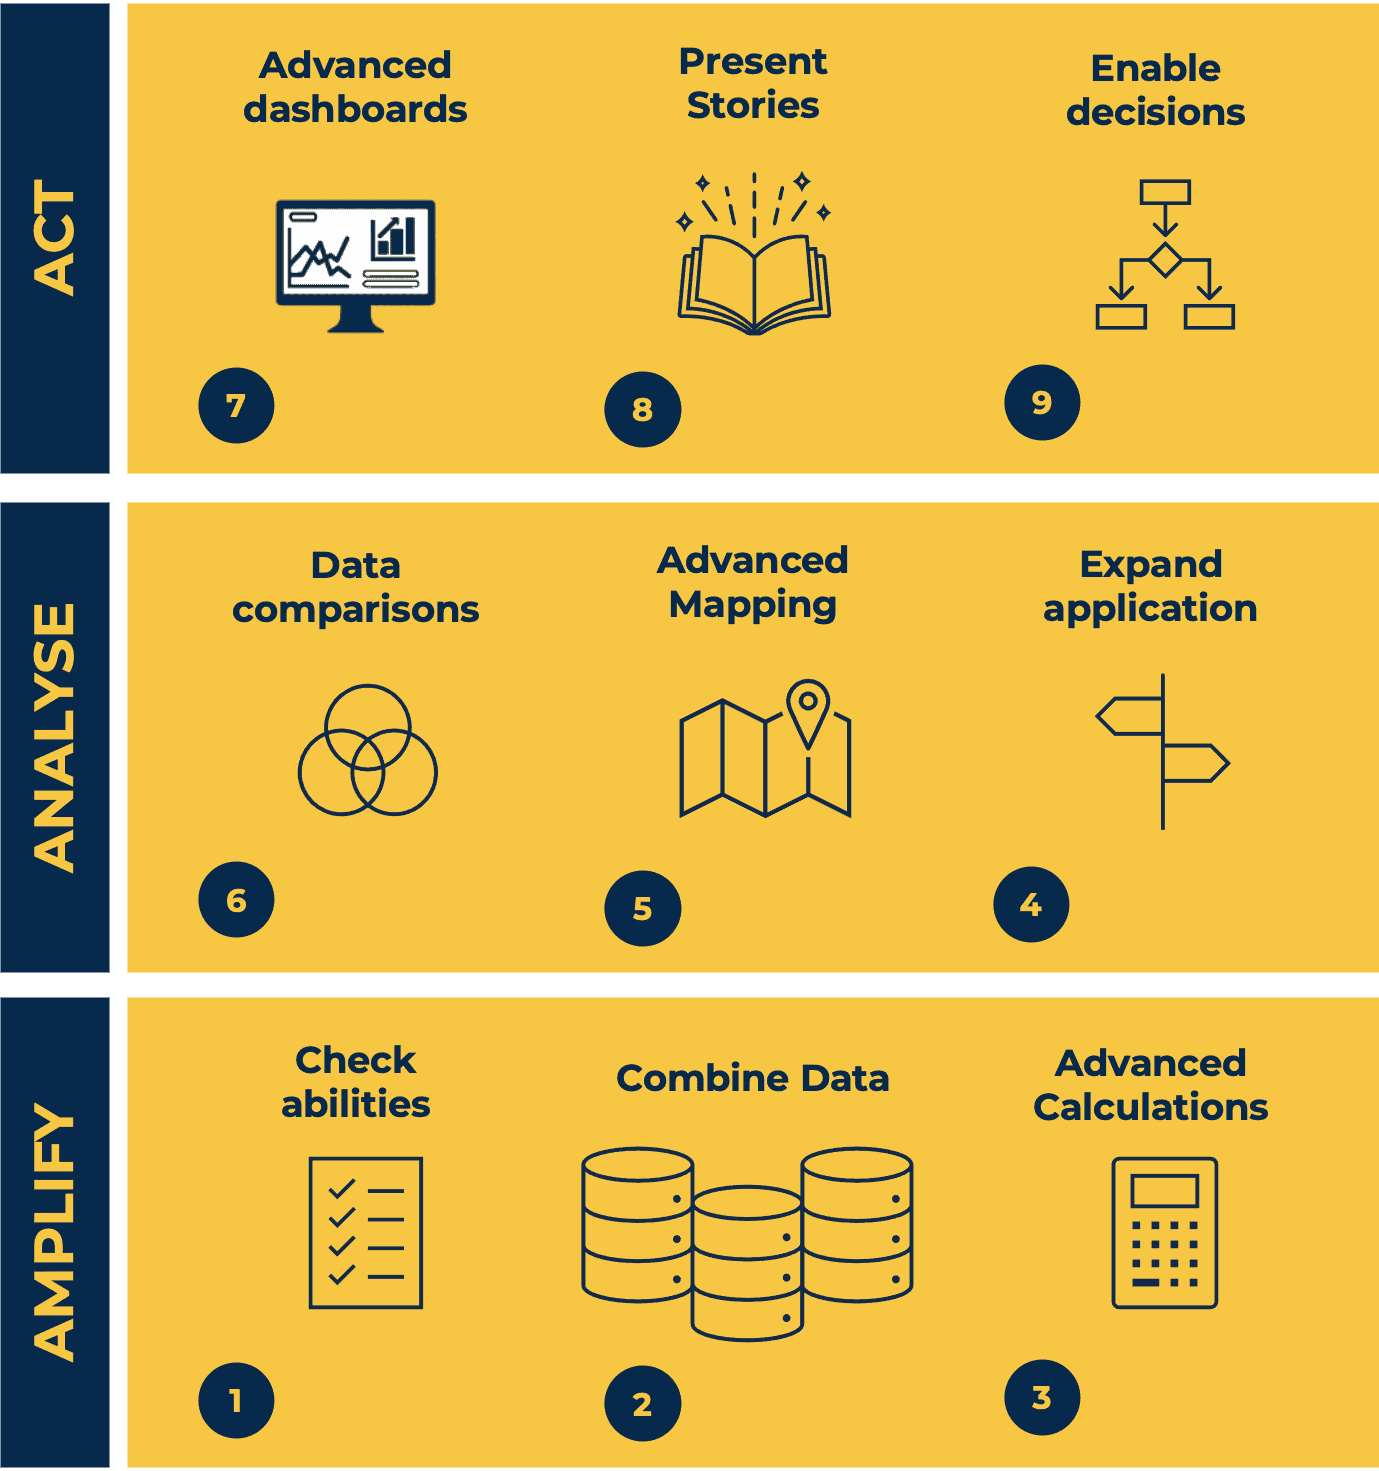
Tableau Desktop Training - Foundation
By Tableau Training Uk
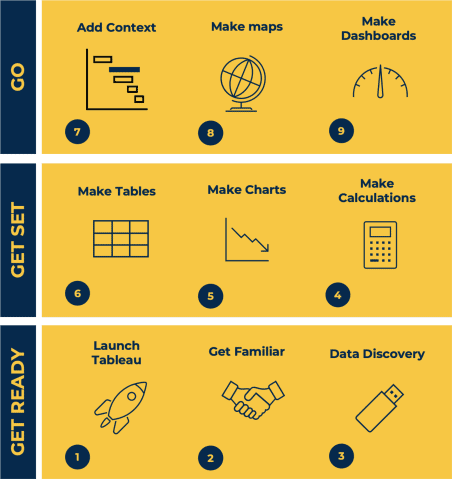
This Tableau Desktop Training course is a jumpstart to getting report writers and analysts with little or no previous knowledge to being productive. It covers everything from connecting to data, through to creating interactive dashboards with a range of visualisations in two days of your time. For Private options, online or in-person, please send us details of your requirements: This Tableau Desktop Training course is a jumpstart to getting report writers and analysts with little or no previous knowledge to being productive. It covers everything from connecting to data, through to creating interactive dashboards with a range of visualisations in two days of your time. Having a quick turnaround from starting to use Tableau, to getting real, actionable insights means that you get a swift return on your investment of time and money. This accelerated approach is key to getting engagement from within your organisation so everyone can immediately see and feel the impact of the data and insights you create. This course is aimed at someone who has not used Tableau in earnest and may be in a functional role, eg. in sales, marketing, finance, operations, business intelligence etc. The course is split into 3 phases and 9 modules: PHASE 1: GET READY MODULE 1: LAUNCH TABLEAU Check Install & Setup Why is Visual Analytics Important MODULE 2: GET FAMILIAR What is possible How does Tableau deal with data Know your way around How do we format charts Dashboard Basics – My First Dashboard MODULE 3: DATA DISCOVERY Connecting to and setting up data in Tableau How Do I Explore my Data – Filters & Sorting How Do I Structure my Data – Groups & Hierarchies, Visual Groups How Tableau Deals with Dates – Using Discrete and Continuous Dates, Custom Dates Phase 2: GET SET MODULE 4: MAKE CALCULATIONS How Do I Create Calculated Fields & Why MODULE 5: MAKE CHARTS Charts that Compare Multiple Measures – Measure Names and Measure Values, Shared Axis Charts, Dual Axis Charts, Scatter Plots Showing Relational & Proportional Data – Pie Charts, Donut Charts, Tree Maps MODULE 6: MAKE TABLES Creating Tables – Creating Tables, Highlight Tables, Heat Maps Phase 3: GO MODULE 7: ADD CONTEXT Reference Lines and Bands MODULE 8: MAKE MAPS Answering Spatial Questions – Mapping, Creating a Choropleth (Filled) Map MODULE 9: MAKE DASHBOARDS Using the Dashboard Interface Dashboard Actions This training course includes over 25 hands-on exercises and quizzes to help participants “learn by doing” and to assist group discussions around real-life use cases. Each attendee receives a login to our extensive training portal which covers the theory, practical applications and use cases, exercises, solutions and quizzes in both written and video format. Students must use their own laptop with an active version of Tableau Desktop 2018.2 (or later) pre-installed. What People Are Saying About This Course “Excellent Trainer – knows his stuff, has done it all in the real world, not just the class room.”Richard L., Intelliflo “Tableau is a complicated and powerful tool. After taking this course, I am confident in what I can do, and how it can help improve my work.”Trevor B., Morrison Utility Services “I would highly recommend this course for Tableau beginners, really easy to follow and keep up with as you are hands on during the course. Trainer really helpful too.”Chelsey H., QVC “He is a natural trainer, patient and very good at explaining in simple terms. He has an excellent knowledge base of the system and an obvious enthusiasm for Tableau, data analysis and the best way to convey results. We had been having difficulties in the business in building financial reports from a data cube and he had solutions for these which have proved to be very useful.”Matthew H., ISS Group
Power BI - introduction (2 day) (In-House)
By The In House Training Company
There is a lot to learn in Power BI, this course takes a comprehensive look at the fundamentals of analysing data and includes a balanced look at the four main components that make up Power BI Desktop: Report view, Data view, Model view, and the Power Query Editor. It also demonstrates how to utilise the online Power BI service. It looks at authoring tools that enable you to connect to and transform data from a variety of sources, allowing you to produce detailed reports through a range of visualisations, in an interactive and dynamic way. It also includes a detailed look at formulas by writing both M functions in Power Query, and DAX functions in Desktop view. This knowledge will allow you to take your reports to the next level. The aim of this course is to provide a complete introduction to understanding the Power BI analysis process, by working hands-on with examples that will equip you with the necessary skills to start applying your learning straight away. 1 Getting Started The Power BI ecosystem Opening Power BI Desktop Power BI's four views Introduction to Dashboards 2 Importing Files Importing data sources Importing an Excel file Importing a CSV file Importing a database Connect to an SQL Server Database Import vs. Direct Query Importing from the web Importing a folder of files Managing file connections 3 Shape Data in the Query Editor The process of shaping data Managing data types Keeping and removing rows Add a custom column Appending tables together Hiding queries in reports Fixing error issues Basic maths operations 4 The Data Model Table relationships Relationship properties 5 Merge Queries Table join kinds Merging tables 6 Inserting Dashboard Visuals Things to keep in mind Inserting maps Formatting Maps Inserting charts Formatting Charts Inserting a tree map Inserting a table, matrix, and card Controlling number formats About report themes Highlighting key points Filter reports with slicers Sync slicers across dashboards Custom web visuals 7 Publish and share Reports Publishing to Power BI service Editing online reports Pinning visuals to a dashboard What is Q&A? Sharing dashboards Exporting reports to PowerPoint Exporting reports as PDF files 8 The Power Query Editor Fill data up and down Split column by delimiter Add a conditional column More custom columns Merging columns 9 The M Functions Inserting text functions Insert an IF function Create a query group 10 Pivoting Tables Pivot a table Pivot and append tables Pivot but don't aggregate Unpivot tables Append mismatched headers 11 Data Modelling Expanded Understanding relationships Mark a date table 12 DAX New Columns New columns and measures New column calculations Insert a SWITCH function 13 Introduction to DAX Measures Common measure functions Insert a SUM function Insert a COUNTROWS function Insert a DISTINCTCOUNT function Insert a DIVIDE function DAX rules 14 The CALCULATE Measure The syntax of CALCULATE Insert a CALCULATE function Control field summarisation Things of note 15 The SUMX measure X iterator functions Anatomy of SUMX Insert a SUMX function When to use X functions 16 Time Intelligence Measures Importance of a calendar table Insert a TOTALYTD function Change financial year end date Comparing historical data Insert a DATEADD function 17 Hierarchies and Groups Mine data using hierarchies Compare data in groups
Visual Analytics Best Practice
By Tableau Training Uk
This course is very much a discussion, so be prepared to present and critically analyse your own and class mates work. You will also need to bring a few examples of work you have done in the past. Learning and applying best practice visualisation principles will improve effective discussions amongst decision makers throughout your organisation. As a result more end-users of your dashboards will be able to make better decisions, more quickly. This 2 Day training course is aimed at analysts with good working knowledge of BI tools (we use Tableau to present, but attendees can use their own software such as Power BI or Qlik Sense). It is a great preparation for taking advanced certifications, such as Tableau Certified Professional. Contact us to discuss the Visual Analytics Best Practice course Email us if you are interested in an on-site course, or would be interested in different dates and locations This Tableau Desktop training intermediate course is designed for the professional who has a solid foundation with Tableau and is looking to take it to the next level. Attendees should have a good understanding of the fundamental concepts of building Tableau worksheets and dashboards typically achieved from having attended our Tableau Desktop Foundation Course. At the end of this course you will be able to communicate insights more effectively, enabling your organisation to make better decisions, quickly. The Tableau Desktop Analyst training course is aimed at people who are used to working with MS Excel or other Business Intelligence tools and who have preferably been using Tableau already for basic reporting. The course includes the following topics: WHAT IS VISUAL ANALYSIS? Visual Analytics Visual Analytics Process Advantages of Visual Analysis Exercise: Interpreting Visualisations HOW DO WE PROCESS VISUAL INFORMATION? Memory and Processing Types Exercise: Identifying Types of Processing Cognitive Load Exercise: Analysing Cognitive Load Focus and Guide the Viewer Remove Visual Distractions Organise Information into Chunks Design for Proximity Exercise: Reducing Cognitive Load SENSORY MEMORY Pre-attentive Attributes Quantitatively-Perceived Attributes Categorically-Perceived Attributes Exercise: Analysing Pre-attentive Attributes Form & Attributes Exercise: Using Form Effectively Colour & Attributes Exercise: Using Colour Effectively Position & Attributes Exercise: Using Position Effectively ENSURING VISUAL INTEGRITY Informing without Misleading Gestalt Principles Visual Area Axis & Scale Colour Detail Exercise: Informing without Misleading CHOOSING THE RIGHT VISUALISATION Comparing and Ranking Categories Comparing Measures Comparing Parts to Whole Viewing Data Over Time Charts Types for Mapping Viewing Correlation Viewing Distributions Viewing Specific Values DASHBOARDS AND STORIES Exercise: Picking the Chart Type Exercise: Brainstorming Visual Best Practice Development Process for Dashboards and Stories Plan the Visualisation Create the Visualisation Test the Visualisation Exercise: Designing Dashboards and Stories This training course includes over 20 hands-on exercises to help participants “learn by doing” and to assist group discussions around real-life use cases. Each attendee receives an extensive training manual which covers the theory, practical applications and use cases, exercises and solutions together with a USB with all the materials required for the training. The course starts at 09:30 on the first day and ends at 17:00. On the second day the course starts at 09:00 and ends at 17:00. Students must bring their own laptop with an active version of Tableau Desktop 10.5 (or later) pre-installed. What People Are Saying About This Course "Steve was willing to address questions arising from his content in a full and understandable way"Lisa L. "Really enjoyed the course and feel the subject and the way it was taught was very close to my needs"James G. "The course tutor Steve was incredibly helpful and taught the information very well while making the two days very enjoyable."Bradd P. "The host and his courses will give you the tools and confidence that you need to be comfortable with Tableau."Jack S. "Steve was fantastic with his knowledge and knowhow about the product. Where possible he made sure you could put demonstrations in to working practice, to give the audience a clear understanding."Tim H. "This was a very interesting and helpful course, which will definitely help me produce smarter, cleaner visualisations that will deliver more data-driven insights within our business."Richard A. "Steve is very open to questions and will go out of his way to answer any query. Thank you"Wasif N. "Steve was willing to address questions arising from his content in a full and understandable way"Lisa L. "Really enjoyed the course and feel the subject and the way it was taught was very close to my needs"James G.

Microsoft Project Reporting
By Underscore Group
Use the features in project to report effectively on your plans. Course overview Duration: 4 hours Our Project – Reporting course is aimed at experienced users of Project who need to create reports in their project plans. It looks at using the different types of report in Project, exporting data to other packages, building new reports and sharing reports between projects. Experience of using Project to create and resource plans is required. Objectives By the end of the course you will be able to: Print and PDF data from your project Use timelines Setup filters and groups Import and export data Create and share dashboard reports Content Printing and reporting Setup and Printing Creating PDFs Visual reports Using the Timeline Filtering and grouping Applying filters Applying grouping Creating your own filters and groups Importing and exporting data Importing data into Project Exporting data Creating and saving data maps Dashboard reports Using dashboard reports Creating dashboard reports Adding widgets Customising data shown