- Professional Development
- Medicine & Nursing
- Arts & Crafts
- Health & Wellbeing
- Personal Development
803 Business Analytics & Intelligence courses
PL-300T00 Microsoft Power BI Data Analyst
By Nexus Human
Duration 3 Days 18 CPD hours This course is intended for The audience for this course are data professionals and business intelligence professionals who want to learn how to accurately perform data analysis using Power BI. This course is also targeted toward those individuals who develop reports that visualize data from the data platform technologies that exist on both in the cloud and on-premises. This course covers the various methods and best practices that are in line with business and technical requirements for modeling, visualizing, and analyzing data with Power BI. The course will show how to access and process data from a range of data sources including both relational and non-relational sources. Finally, this course will also discuss how to manage and deploy reports and dashboards for sharing and content distribution. Prerequisites Understanding core data concepts. Knowledge of working with relational data in the cloud. Knowledge of working with non-relational data in the cloud. Knowledge of data analysis and visualization concepts. DP-900T00 Microsoft Azure Data Fundamentals is recommended 1 - Discover data analysis Overview of data analysis Roles in data Tasks of a data analyst 2 - Get started building with Power BI Use Power BI Building blocks of Power BI Tour and use the Power BI service 3 - Get data in Power BI Get data from files Get data from relational data sources Create dynamic reports with parameters Get data from a NoSQL database Get data from online services Select a storage mode Get data from Azure Analysis Services Fix performance issues Resolve data import errors 4 - Clean, transform, and load data in Power BI Shape the initial data Simplify the data structure Evaluate and change column data types Combine multiple tables into a single table Profile data in Power BI Use Advanced Editor to modify M code 5 - Design a semantic model in Power BI Work with tables Create a date table Work with dimensions Define data granularity Work with relationships and cardinality Resolve modeling challenges 6 - Add measures to Power BI Desktop models Create simple measures Create compound measures Create quick measures Compare calculated columns with measures 7 - Add calculated tables and columns to Power BI Desktop models Create calculated columns Learn about row context Choose a technique to add a column 8 - Use DAX time intelligence functions in Power BI Desktop models Use DAX time intelligence functions Additional time intelligence calculations 9 - Optimize a model for performance in Power BI Review performance of measures, relationships, and visuals Use variables to improve performance and troubleshooting Reduce cardinality Optimize DirectQuery models with table level storage Create and manage aggregations 10 - Design Power BI reports Design the analytical report layout Design visually appealing reports Report objects Select report visuals Select report visuals to suit the report layout Format and configure visualizations Work with key performance indicators 11 - Configure Power BI report filters Apply filters to the report structure Apply filters with slicers Design reports with advanced filtering techniques Consumption-time filtering Select report filter techniques Case study - Configure report filters based on feedback 12 - Enhance Power BI report designs for the user experience Design reports to show details Design reports to highlight values Design reports that behave like apps Work with bookmarks Design reports for navigation Work with visual headers Design reports with built-in assistance Tune report performance Optimize reports for mobile use 13 - Perform analytics in Power BI Explore statistical summary Identify outliers with Power BI visuals Group and bin data for analysis Apply clustering techniques Conduct time series analysis Use the Analyze feature Create what-if parameters Use specialized visuals 14 - Create and manage workspaces in Power BI Distribute a report or dashboard Monitor usage and performance Recommend a development life cycle strategy Troubleshoot data by viewing its lineage Configure data protection 15 - Manage semantic models in Power BI Use a Power BI gateway to connect to on-premises data sources Configure a semantic model scheduled refresh Configure incremental refresh settings Manage and promote semantic models Troubleshoot service connectivity Boost performance with query caching (Premium) 16 - Create dashboards in Power BI Configure data alerts Explore data by asking questions Review Quick insights Add a dashboard theme Pin a live report page to a dashboard Configure a real-time dashboard Set mobile view 17 - Implement row-level security Configure row-level security with the static method Configure row-level security with the dynamic method Additional course details: Nexus Humans PL-300T00: Microsoft Power BI Data Analyst training program is a workshop that presents an invigorating mix of sessions, lessons, and masterclasses meticulously crafted to propel your learning expedition forward. This immersive bootcamp-style experience boasts interactive lectures, hands-on labs, and collaborative hackathons, all strategically designed to fortify fundamental concepts. Guided by seasoned coaches, each session offers priceless insights and practical skills crucial for honing your expertise. Whether you're stepping into the realm of professional skills or a seasoned professional, this comprehensive course ensures you're equipped with the knowledge and prowess necessary for success. While we feel this is the best course for the PL-300T00: Microsoft Power BI Data Analyst course and one of our Top 10 we encourage you to read the course outline to make sure it is the right content for you. Additionally, private sessions, closed classes or dedicated events are available both live online and at our training centres in Dublin and London, as well as at your offices anywhere in the UK, Ireland or across EMEA.

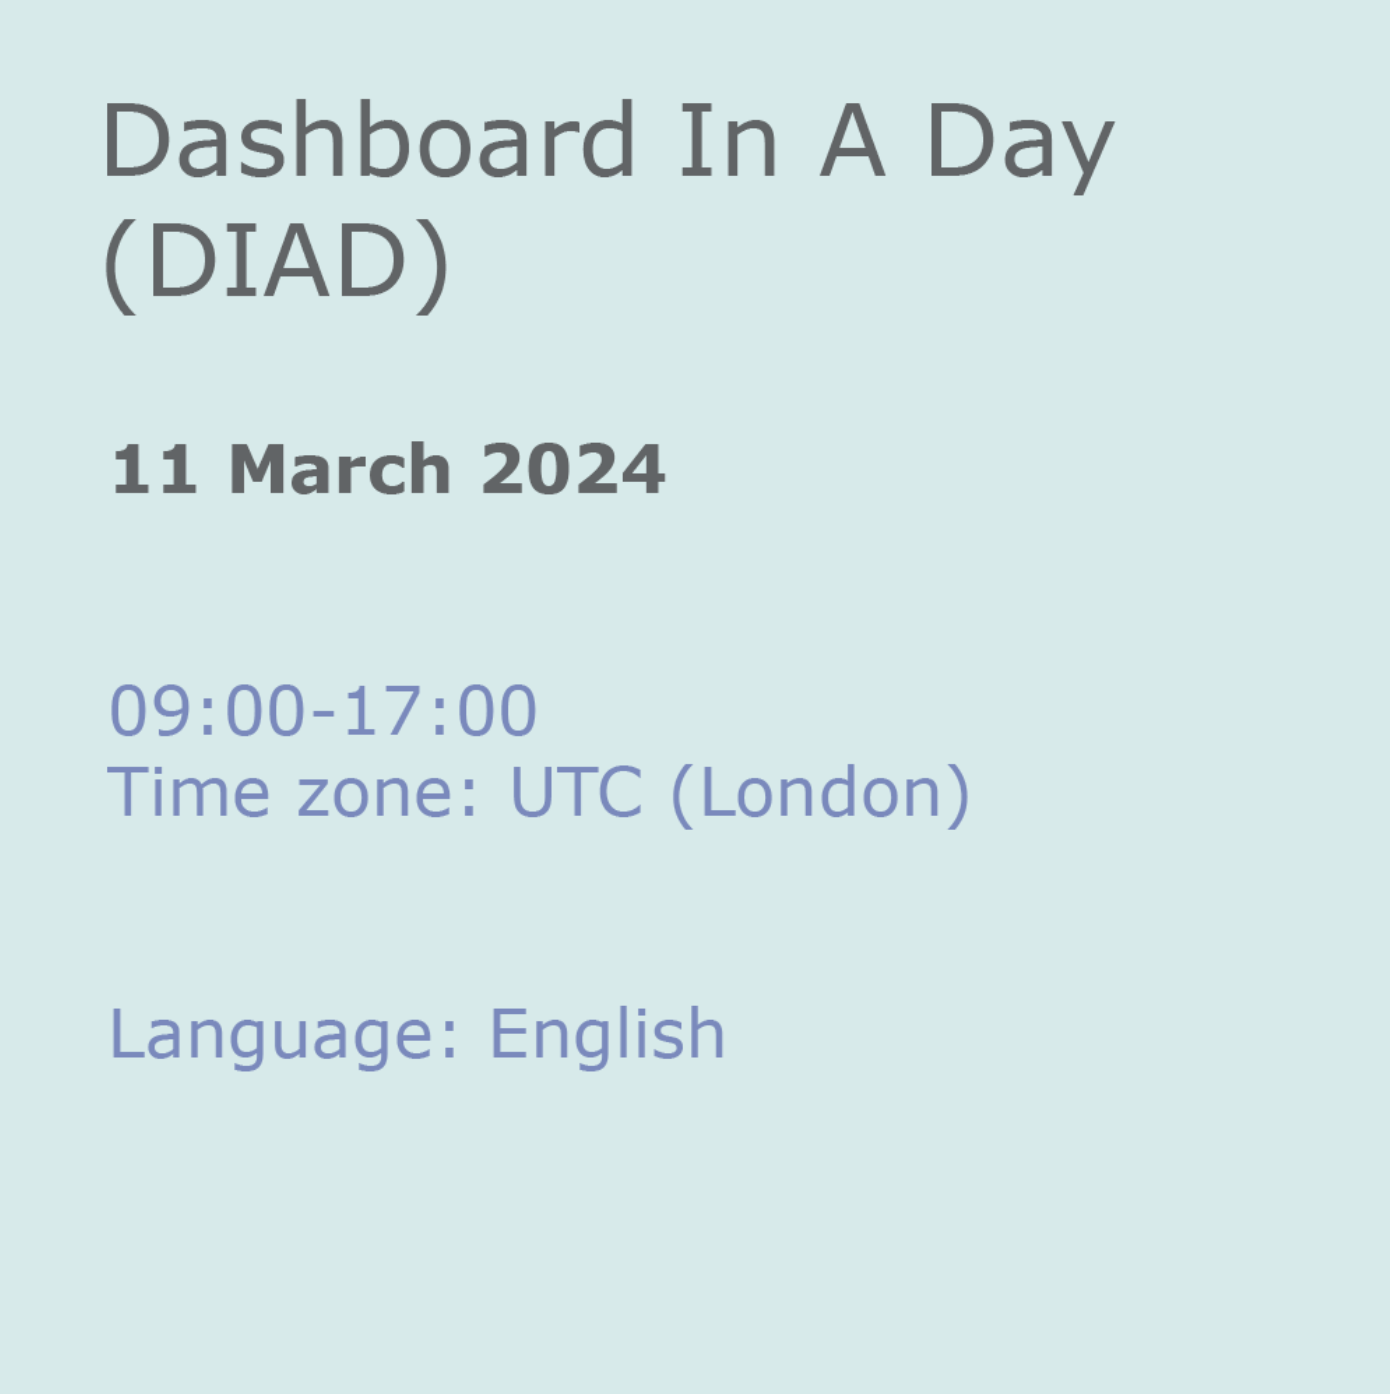
Dashboard In A Day (DIAD)
By Online Productivity Training
OVERVIEW DIAD is a one-day, hands-on workshop for business analysts, covering the breadth of Power BI capabilities. The course focuses on five practical Labs and at the end of the day, attendees will better understand how to: Connect and transform data from a variety of data sources. Define business rules and KPIs. Explore data with powerful interactive visuals. Build stunning reports. Share their dashboards with their team business partners and publish them to the web. The course content is managed by the Power BI engineering team at Microsoft. There is no exam associated with the course. COURSE BENEFITS: Learn how to clean, transform, and load data from various sources Create and manage a data model in Power BI consisting of multiple tables connected with relationships Build Measures and other calculations in the DAX language to plot in reports Manage and share report assets to the Power BI Service WHO IS THE COURSE FOR? Data Analysts and Management Consultants with little or no experience of Power BI who wish to upgrade their knowledge to include Business Intelligence Analysts looking for a quick introduction to Power BI who don’t have the time for the full three day PL-300 course Marketers in data-intensive organisations who need new tools to build visually appealing, dynamic charts for their stakeholders to use LAB OUTLINE Lab 1 Accessing & Preparing The Data Load data from Excel and CSV sources Manipulate the data to prepare it for reporting Prepare tables in Power Query and load them into the data model Lab 2 Data Modelling And Exploration Create a range of different charts Highlight and cross-filter Create new groups and hierarchies Add new measures to the model Lab 3 Data Visualization Add conditional formatting to a report Add logos to a filter Import a custom visual Apply a custom theme Add bookmarks to the report to tell a story Lab 4 Publishing A Report And Creating A Dashboard Create a Workspace in the Power BI Service Publish a report to the Service Create a Dashboard and pin visuals to it Generate and view insights Lab 5 Collaboration Share a Dashboard Access a Dashboard on a Mobile Device
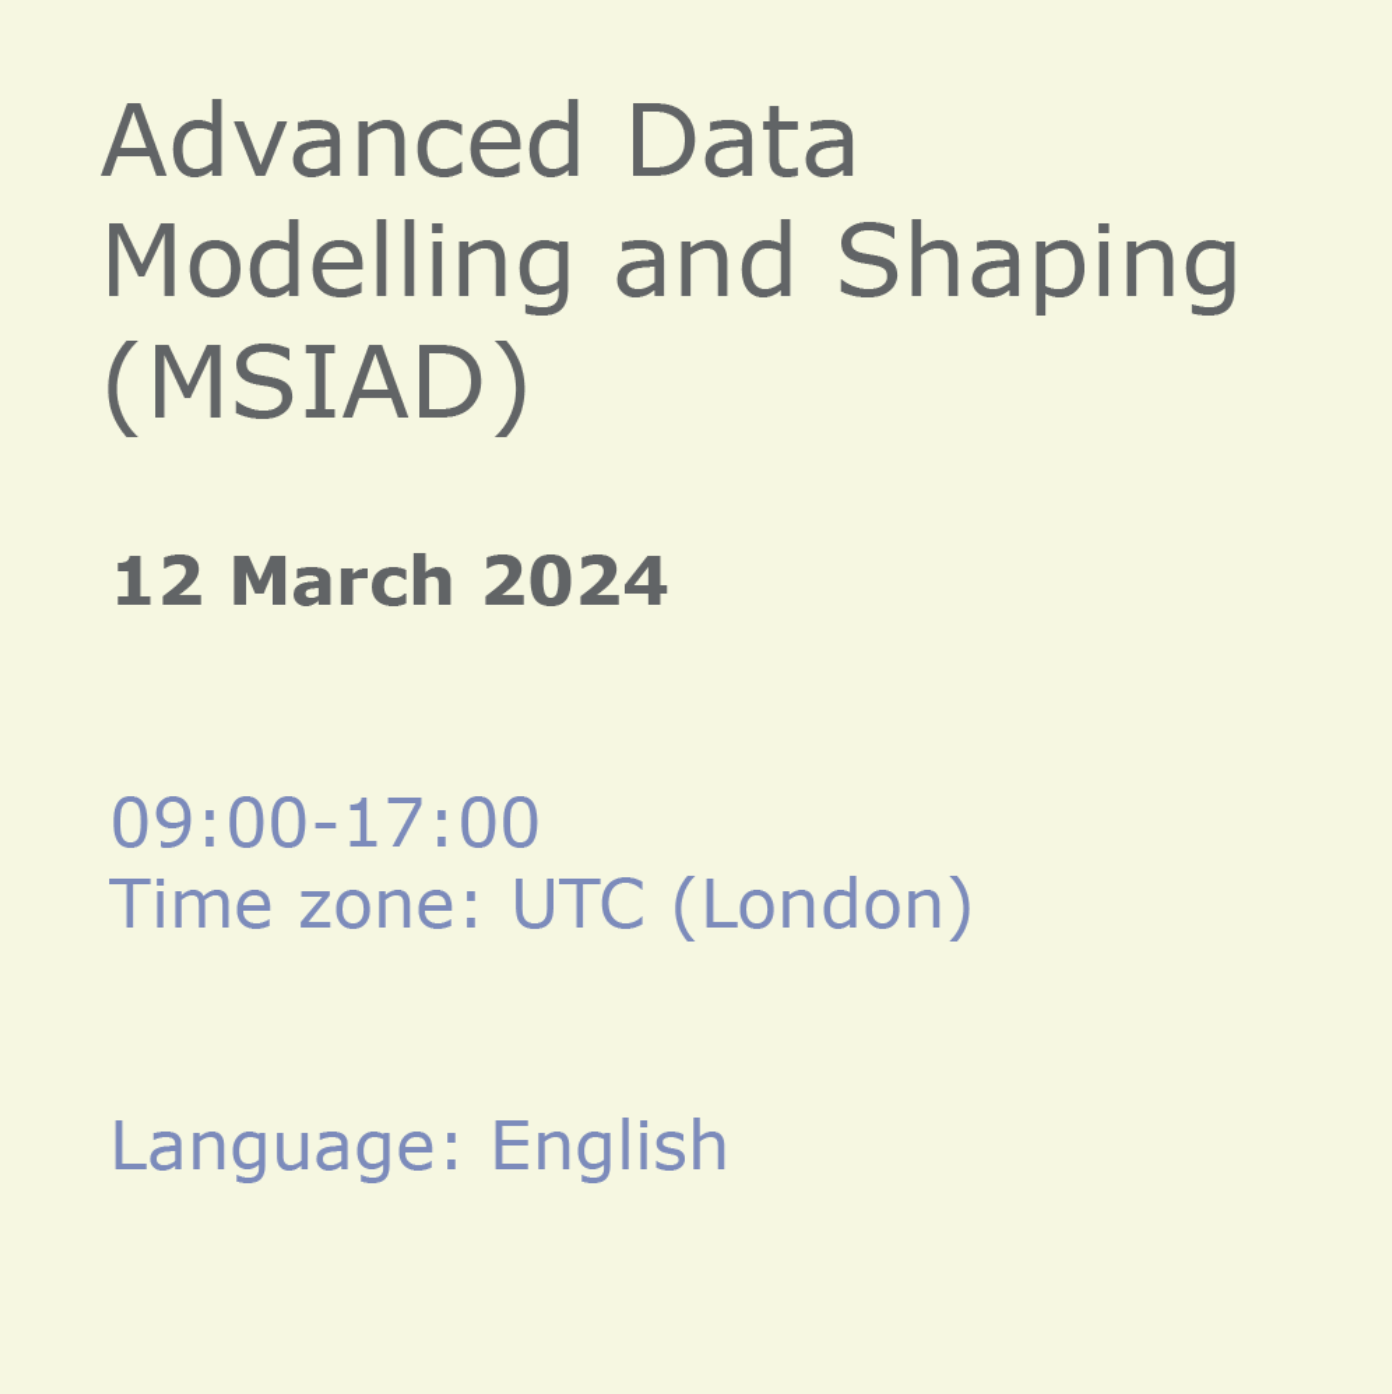
Advanced Data Modelling and Shaping (MSIAD)
By Online Productivity Training
OVERVIEW Prerequisites—DIAD training or equivalent working experience This one-day course will cover using Power BI Desktop to import and shape data from a variety of sources. It will also walk through Power BI capabilities you can use to enhance the data model for your business users. The course covers key aspects of how to create a great data model to meet your business needs, various features in Power BI used to enhance data models so you can build great reports, and an introduction to DAX to create calculations. After completing this training, the attendees should be able to import data from a variety of data sources into Power BI, shape the data, create the data model, and write DAX functions to the Power BI model. COURSE BENEFITS: Understand the Power BI Desktop data model, its components and most effective schemas Describe concepts of calculated columns and measures Create queries using M Create calculations with DAX Understand the use of functions Create and optimize a data model Understand the consequences of data model design decisions WHO IS THE COURSE FOR? Power BI report developers who wish to improve the structure of their data models Power BI report developers who wish to use advanced features like parameters and M coding in Power Query Power BI practitioners who wish to optimise their models more effectively Attendees wishing to prepare thoroughly for the DAX In A Day course COURSE OUTLINE Module 1 Getting And Shaping The Data Understand what is meant by data model in the context of Power BI Understand the consequences of data model design decisions Understand consequences of Power BI’s data type handling Understand data connection options Module 2 Basic Data Modelling Understand basic data modelling Understand basic data model types Explore dimension tables and fact tables Explore data connections Module 3 Getting Started With M (Power Query Language) Get introduced to M Understand key components and syntax Module 4 Understanding Logic Operators Understand Transformations Understand Join operation Module 5 Introduction To DAX Get introduced to DAX and how can it be used Understand working with parameters and DAX (lab combining the previous module) Module 6 Working With Functions - DAX CALCULATE And More Understand working with functions Understand the basics of the CALCULATE formula Module 7 Modelling With Power BI & DAX Best Practice Gain familiarity with basic data modelling for business scenarios Learn some best practices for working with Power BI
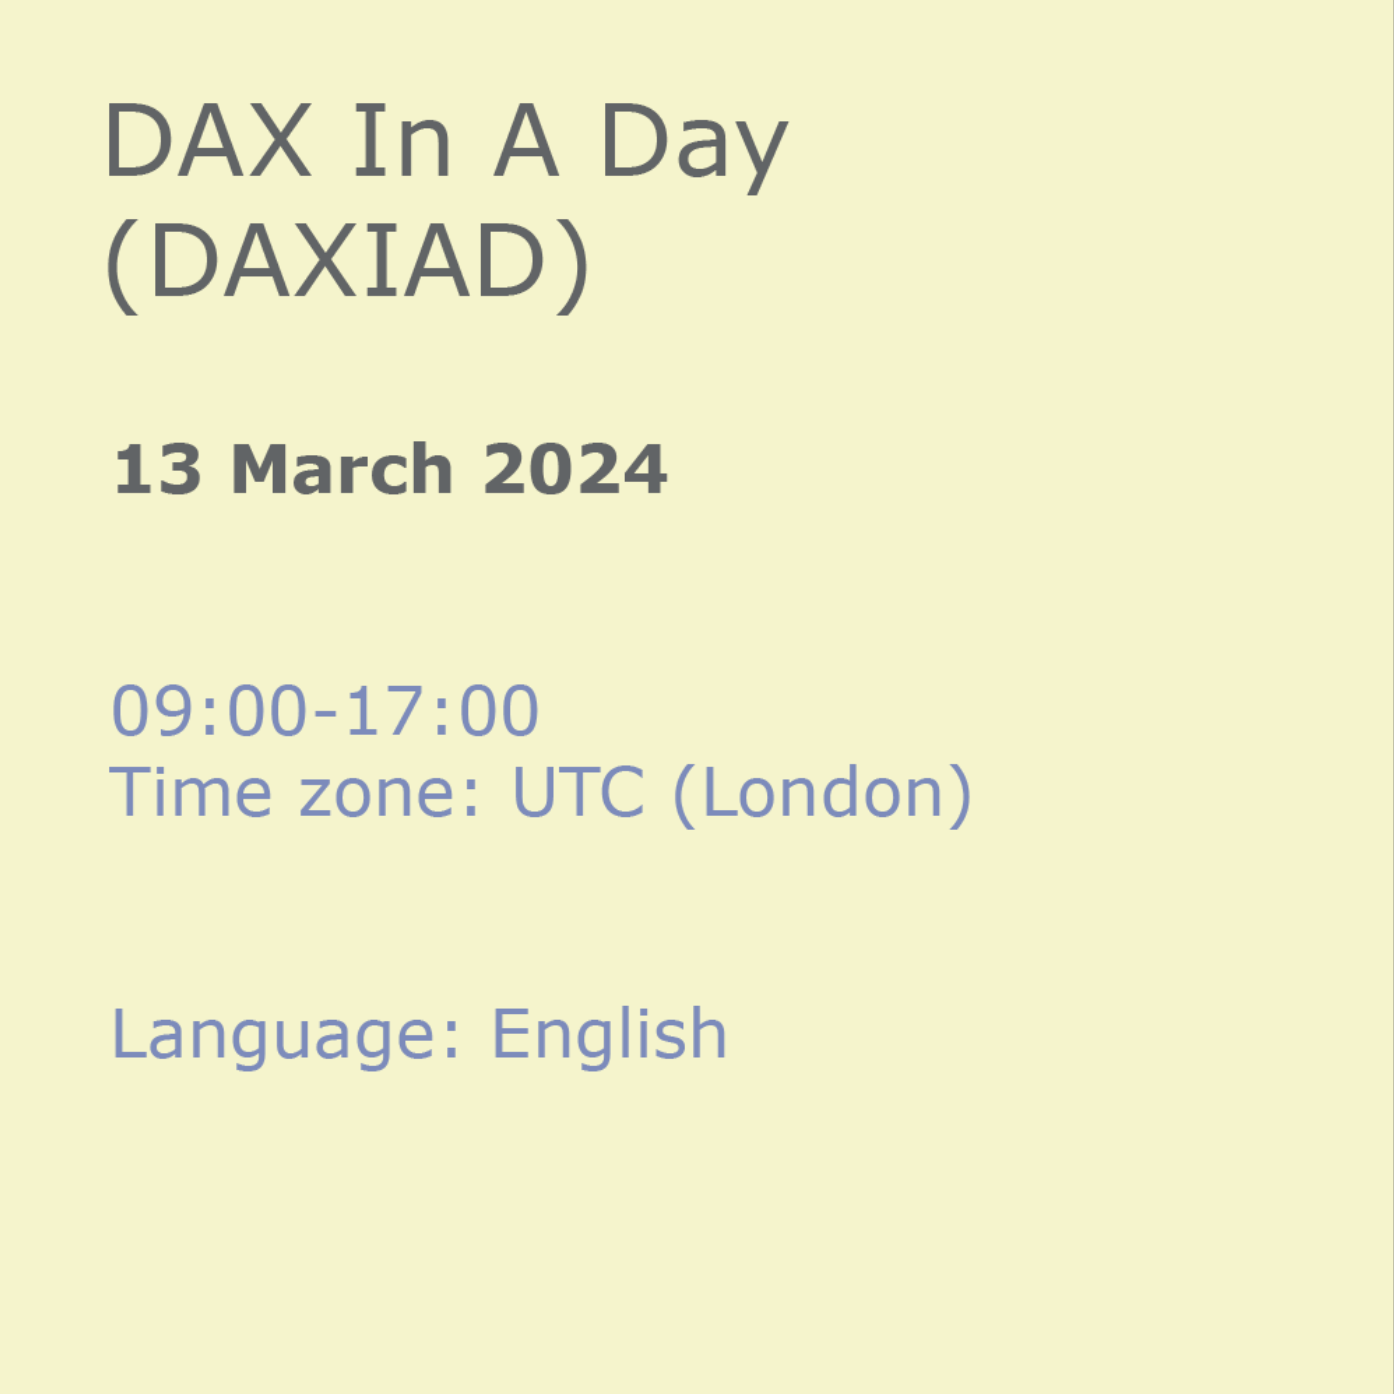
DAX In A Day (DAXIAD)
By Online Productivity Training
OVERVIEW Prerequisites—DIAD training and Advanced Data Modeling and Shaping training or equivalent working experience This course has been designed specifically for experienced model developers and gives a more advanced treatment of DAX formulas than either DIAD or the PL-300 course. We recommend that attendees have prior experience working with Power BI Desktop to create data models. During this course you will review: Writing DAX formulas. Defining calculated tables and columns. Defining measures. Using DAX iterator functions. Modifying filter context. Using DAX time intelligence functions. After completing this training, the attendees should be able to work with Data Analysis Expressions (DAX), perform calculations and define common business calculations for use in reports, address performance and functionality concerns. COURSE BENEFITS: Understand Analytic queries in Power BI Create calculated tables, calculated columns and measures Use DAX functions and operators to build DAX formulas Use DAX iterator functions Create formulas that manipulate the filter context Use DAX time intelligence functions WHO IS THE COURSE FOR? Analysts with experience of Power BI wishing to develop more advanced formulas in DAX Power BI developers who wish to deepen their understanding of the process of calculating formulas so as to make development faster and more reliable LAB OUTLINE Lab 1 Setup Connect to data and understand the objectives of the future labs Lab 2 Write DAX Formulas For Power BI Create a measure Use variables in the measure definition Lab 3 Add Calculated Table And Columns Duplicate a table Create a hierarchy Create a date table Add calculated columns Lab 4 Add Measures To Power BI Desktop Models Add an implicit measure to a report Add an explicit measure Add a compound measure Add a quick measure Lab 5 Use DAX Iterator Functions In A Power BI Desktop Model Complex summarization Higher grain summarization Create ranking measure Lab 6 Modify DAX Filter Context In Power BI Desktop Models Apply Boolean expression filter Remove filters: use ALL Remove filters: use AllSelected Preserve filters: use KeepFilters HASONEVALUE ISINSCOPE Context transition Lab 7 Use DAX Time Intelligence Functions In Power BI Desktop Models TOTALYTD SAMEPERIODLASTYEAR Calculate new occurrences Snapshot calculations

Process Mapping & Supply Chain
By Course Cloud
Course Overview Discover how to ensure that your organisation has the resources and products that it needs to work efficiently with this course on Process Mapping & Supply Chain. Organisations need guaranteed and sustainable access to supplies in order to be able to work effectively. Poor working partnerships can effectively destroy this. By following this training, you will know how to coordinate your inventories and transportation to achieve the best outcome for the customer and the company. This Operations Management tutorial provides you with all the techniques and strategies for creating the perfect working supply chain. You will be shown how to accurate map requirements for your business and your customers, leading to enhanced service delivery and operations. Using these principles, you will become skilled at supply chain management and know how to continually improve it to everyone's benefit. This best selling Process Mapping & Supply Chain has been developed by industry professionals and has already been completed by hundreds of satisfied students. This in-depth Process Mapping & Supply Chain is suitable for anyone who wants to build their professional skill set and improve their expert knowledge. The Process Mapping & Supply Chain is CPD-accredited, so you can be confident you're completing a quality training course will boost your CV and enhance your career potential. The Process Mapping & Supply Chain is made up of several information-packed modules which break down each topic into bite-sized chunks to ensure you understand and retain everything you learn. After successfully completing the Process Mapping & Supply Chain, you will be awarded a certificate of completion as proof of your new skills. If you are looking to pursue a new career and want to build your professional skills to excel in your chosen field, the certificate of completion from the Process Mapping & Supply Chain will help you stand out from the crowd. You can also validate your certification on our website. We know that you are busy and that time is precious, so we have designed the Process Mapping & Supply Chain to be completed at your own pace, whether that's part-time or full-time. Get full course access upon registration and access the course materials from anywhere in the world, at any time, from any internet-enabled device. Our experienced tutors are here to support you through the entire learning process and answer any queries you may have via email.

Complete Data Structures
By Course Cloud
The comprehensive Complete Data Structures has been designed by industry experts to provide learners with everything they need to enhance their skills and knowledge in their chosen area of study. Enrol on the Complete Data Structures today, and learn from the very best the industry has to offer! This best selling Complete Data Structures has been developed by industry professionals and has already been completed by hundreds of satisfied students. This in-depth Complete Data Structures is suitable for anyone who wants to build their professional skill set and improve their expert knowledge. The Complete Data Structures is CPD-accredited, so you can be confident you're completing a quality training course which will boost your CV and enhance your career potential. The Complete Data Structures is made up of several information-packed modules which break down each topic into bite-sized chunks to ensure you understand and retain everything you learn. After successfully completing the Complete Data Structures, you will be awarded a certificate of completion as proof of your new skills. If you are looking to pursue a new career and want to build your professional skills to excel in your chosen field, the certificate of completion from the Complete Data Structures will help you stand out from the crowd. You can also validate your certification on our website. We know that you are busy and that time is precious, so we have designed the Complete Data Structures to be completed at your own pace, whether that's part-time or full-time. Get full course access upon registration and access the course materials from anywhere in the world, at any time, from any internet-enabled device. Our experienced tutors are here to support you through the entire learning process and answer any queries you may have via email.

Clinical Data Analysis with SAS
By Course Cloud
The comprehensive Clinical Data Analysis with SAS has been designed by industry experts to provide learners with everything they need to enhance their skills and knowledge in their chosen area of study. Enrol on the Clinical Data Analysis with SAS today, and learn from the very best the industry has to offer! This best selling Clinical Data Analysis with SAS has been developed by industry professionals and has already been completed by hundreds of satisfied students. This in-depth Clinical Data Analysis with SAS is suitable for anyone who wants to build their professional skill set and improve their expert knowledge. The Clinical Data Analysis with SAS is CPD-accredited, so you can be confident you're completing a quality training course will boost your CV and enhance your career potential. The Clinical Data Analysis with SAS is made up of several information-packed modules which break down each topic into bite-sized chunks to ensure you understand and retain everything you learn. After successfully completing the Clinical Data Analysis with SAS , you will be awarded a certificate of completion as proof of your new skills. If you are looking to pursue a new career and want to build your professional skills to excel in your chosen field, the certificate of completion from the Clinical Data Analysis with SAS will help you stand out from the crowd. You can also validate your certification on our website. We know that you are busy and that time is precious, so we have designed the Clinical Data Analysis with SAS to be completed at your own pace, whether that's part-time or full-time. Get full course access upon registration and access the course materials from anywhere in the world, at any time, from any internet-enabled device. Our experienced tutors are here to support you through the entire learning process and answer any queries you may have via email.

Process Improvement Level 02
By Course Cloud
The innovative Process Improvement Level 02 has been compiled with the assistance and expertise of industry professionals. It has been carefully crafted to meet the business requirements needed for an outstanding contribution to this role and the career path beyond it. By enrolling in this tutorial, a significant advantage can be gained by the student for securing their dream job and building an excellent reputation in this sector. This popular Process Improvement Level 02 has been designed to help dedicated individuals train to become the absolute best in this business field. Many other entrepreneurs and talented students have already completed this course, and others like it, empowering them to move onto satisfying and rewarding careers. This unique Process Improvement Level 02 course is perfectly suited for those dedicated and ambitious individuals who are committed to genuinely becoming the best in the business. The Process Improvement Level 02 is recognised and accredited by CPD standards, so all contents are guaranteed to be accurate and reputable, adding valuable competencies and qualifications to a CV, making anyone stand out from other potential candidates or business rivals. For added convenience, the Process Improvement Level 02 consists of a range of educational modules that allow study sessions to be organised at any time and any place When the final assessment of the Process Improvement Level 02 has been completed, a certificate of completion is supplied to evidence newly acquired skills and knowledge. This will provide a significant boost for job-seeking or entry into a new and exciting career path. The valuable qualification from the Process Improvement Level 02 course can help to make all the difference in a dynamic employment sector and can also be validated on our website. We are aware that a student's lifestyles and work ethics may not allow much time for a dedicated study session, so the Process Improvement Level 02 has been specifically designed to be taken at a personally selected pace, and the hours that are suited to each individual. Full access is immediately available after registration, and this can be achieved via any online device, and at any global location you are sighted at. Our fully-trained tutors are committed to helping you throughout the course, and will instantly respond to any queries that are sent to them via email.

Master IT: Data Analysis, Data Science & Data Protection Career Based Job Focused Program
(27)By Apex Learning
Transform Your Career with Our IT: Data Analysis, Data Science & Data Protection Program - an all-in-one Program Designed for Mastery! Do you know the demand for IT professionals with expertise in data science is skyrocketing? This Ultimate IT: Data Analysis, Data Science & Data Protection Program is your gateway to a thriving career in this dynamic industry. This program is meticulously designed to equip you with the knowledge and skills demanded by hiring managers across various sectors. By enrolling in this IT: Data Analysis, Data Science & Data Protection program, you'll embark on a journey that opens doors to exciting opportunities and empowers you to shape your future in the IT industry. Our IT: Data Analysis, Data Science & Data Protection program will give you a comprehensive understanding of data analysis, from data collection and preparation to data visualisation and communication. You will be equipped with the necessary skills and guidance to uncover insights from data, solve real-world problems, and make informed decisions. Also, you will discover the ethical and legal implications of data handling, how to protect sensitive information & develop a career in this sector. Moreover, we're your dedicated partners on this exciting journey. Our goal isn't just to teach you; it's to support you 24/7 so you can get closer to your dream job. We're so confident with our program that we offer a 100% money-back guarantee, ensuring your complete satisfaction. Learning Outcomes By completing this IT: Data Analysis, Data Science & Data Protection program, you will gain expertise in the following: Data analysis techniques and methodologies. Python programming for data analysis. Business intelligence and data mining. Advanced Excel techniques, including VBA and Power Query. SQL programming and big data technologies. Data Science & Data Protection, Machine Learning with Python and R. Data visualisation with tools like Tableau and Power BI. Statistics and probability for data science. Effective career development and job-seeking skills. Design an engaging resume and excel in the job search. Succeed in interviews, including video interviews. Build a strong LinkedIn profile to connect with professionals and enhance your online visibility in IT: Data Analysis- Data Science & Data Protection field. Courses Included in the Program You get 25 in-demand courses once you enrol in our IT: Data Analysis, Data Science & Data Protection program. => Course 01: Introduction to Data Analysis => Course 02: Data Analytics => Course 03: Python for Data Analysis => Course 04: Basic Google Data Studio => Course 05: Business Intelligence and Data Mining Masterclass => Course 06: Microsoft Excel: Automated Dashboard Using Advanced Formula, VBA, Power Query => Course 07: SQL Programming Masterclass => Course 08: SQL NoSQL Big Data and Hadoop => Course 09: Data Science & Machine Learning with Python => Course 10: Machine Learning with Python => Course 11: Data Science & Machine Learning with R => Course 12: Data Analytics with Tableau => Course 13: Develop Big Data Pipelines with R & Sparklyr & Tableau => Course 14: Complete Introduction to Business Data Analysis Level 3 => Course 15: Data Analysis in Microsoft Excel Complete Training => Course 16: Excel Data Analysis for Beginner => Course 17: GDPR Data Protection Level 5 => Course 18: Master JavaScript with Data Visualization => Course 19: Data Visualization and Reporting with Power BI => Course 20: Statistics & Probability for Data Science & Machine Learning => Course 21: Career Development Plan Fundamentals => Course 22: CV Writing and Job Searching => Course 23: Interview Skills: Ace the Interview => Course 24: Video Job Interview for Job Seekers => Course 25: How to Create a Professional LinkedIn Profile Enrol in our highly regarded IT: Data Analysis, Data Science & Data Protection program, featuring a job-relevant curriculum that ensures your skills align with employer expectations across various sectors. Don't miss this opportunity - your success story starts now! Our IT: Data Analysis, Data Science & Data Protection Program is a comprehensive and industry-relevant journey through data analysis, data science, and IT analytics. With a focus on providing theoretical knowledge and academic depth, this program is your gateway to a promising career in IT: Data Analysis, Data Science & Data Protection sector. Why Choose Us? We take great pride in offering you a great learning experience that stands out. When you consider enrolling in our IT: Data Analysis, Data Science & Data Protection program, you're making a decision that will positively impact your career and knowledge in various aspects related to IT: Data Analysis, Data Science & Data Protection. Here's why choosing us is a smart choice: Updated Materials: We're committed to providing the most up-to-date learning materials. Our dedicated team continuously reviews and updates our content, ensuring you're always learning from the latest sources. When you choose us, you select the most current and relevant information, giving you the edge in your IT career. Flexible Timing: We understand that life can get busy, and you may have existing commitments that can make pursuing further education challenging. That's why we offer flexibility in your study schedule. With our courses, you can learn at your own pace, on your terms. You're in control and can adjust your learning to fit your life. No Hidden Cost: When choosing our program, you won't incur additional expenses. The certification and course materials are all-inclusive within the program's price. You can focus on your studies without worrying about hidden fees. Money-Back Guarantee: Your satisfaction is our top priority. We're so confident in the quality of our courses that we back them up with a 14-day money-back guarantee. We'll refund your investment if you're unsatisfied with your learning experience. Lifetime Access: When you choose to learn with us, you gain access to a course and a lifetime of knowledge. We offer lifetime access to our course materials, allowing you to revisit and refresh your knowledge whenever you need. 24/7 Support: Learning doesn't just happen during traditional working hours; neither should support. Our commitment to your success extends beyond the classroom. We provide 24/7 support, so you can contact us with your questions and concerns anytime. CPD 250 CPD hours / points Accredited by CPD Quality Standards Who is this course for? This IT: Data Analysis, Data Science & Data Protection program is suitable for: Aspiring IT: Data Analysis, Data Science & Data Protection professionals. Students and recent graduates looking to enter the field. Career changers interested in data analytics. Security professionals seeking to upskill in data security. Anyone interested in learning about IT: Data Analysis, Data Science & Data Protection. Requirements No prior experience is required in our IT: Data Analysis, Data Science & Data Protection program. Career path Upon completing the program, you'll get edges in various IT: Data Analysis, data science & data protection-related jobs including: Data Analyst: £25,000 - £45,000 Business Intelligence Analyst: £30,000 - £50,000 Data Scientist: £35,000 - £60,000 Machine Learning Engineer: £40,000 - £70,000 SQL Developer: £30,000 - £55,000 Tableau Developer: £35,000 - £60,000 Power BI Developer: £35,000 - £60,000 Certificates CPD Accredited (e-Certificate) Digital certificate - Included CPD Accredited (Hard Copy Certificate) Hard copy certificate - Included e-Transcript Digital certificate - Included Hard Copy Transcript Hard copy certificate - Included Student ID Card Digital certificate - Included
