- Professional Development
- Medicine & Nursing
- Arts & Crafts
- Health & Wellbeing
- Personal Development
664 Business Analytics & Intelligence courses delivered Online
Visual Analytics Best Practice
By Tableau Training Uk
This course is very much a discussion, so be prepared to present and critically analyse your own and class mates work. You will also need to bring a few examples of work you have done in the past. Learning and applying best practice visualisation principles will improve effective discussions amongst decision makers throughout your organisation. As a result more end-users of your dashboards will be able to make better decisions, more quickly. This 2 Day training course is aimed at analysts with good working knowledge of BI tools (we use Tableau to present, but attendees can use their own software such as Power BI or Qlik Sense). It is a great preparation for taking advanced certifications, such as Tableau Certified Professional. Contact us to discuss the Visual Analytics Best Practice course Email us if you are interested in an on-site course, or would be interested in different dates and locations This Tableau Desktop training intermediate course is designed for the professional who has a solid foundation with Tableau and is looking to take it to the next level. Attendees should have a good understanding of the fundamental concepts of building Tableau worksheets and dashboards typically achieved from having attended our Tableau Desktop Foundation Course. At the end of this course you will be able to communicate insights more effectively, enabling your organisation to make better decisions, quickly. The Tableau Desktop Analyst training course is aimed at people who are used to working with MS Excel or other Business Intelligence tools and who have preferably been using Tableau already for basic reporting. The course includes the following topics: WHAT IS VISUAL ANALYSIS? Visual Analytics Visual Analytics Process Advantages of Visual Analysis Exercise: Interpreting Visualisations HOW DO WE PROCESS VISUAL INFORMATION? Memory and Processing Types Exercise: Identifying Types of Processing Cognitive Load Exercise: Analysing Cognitive Load Focus and Guide the Viewer Remove Visual Distractions Organise Information into Chunks Design for Proximity Exercise: Reducing Cognitive Load SENSORY MEMORY Pre-attentive Attributes Quantitatively-Perceived Attributes Categorically-Perceived Attributes Exercise: Analysing Pre-attentive Attributes Form & Attributes Exercise: Using Form Effectively Colour & Attributes Exercise: Using Colour Effectively Position & Attributes Exercise: Using Position Effectively ENSURING VISUAL INTEGRITY Informing without Misleading Gestalt Principles Visual Area Axis & Scale Colour Detail Exercise: Informing without Misleading CHOOSING THE RIGHT VISUALISATION Comparing and Ranking Categories Comparing Measures Comparing Parts to Whole Viewing Data Over Time Charts Types for Mapping Viewing Correlation Viewing Distributions Viewing Specific Values DASHBOARDS AND STORIES Exercise: Picking the Chart Type Exercise: Brainstorming Visual Best Practice Development Process for Dashboards and Stories Plan the Visualisation Create the Visualisation Test the Visualisation Exercise: Designing Dashboards and Stories This training course includes over 20 hands-on exercises to help participants “learn by doing” and to assist group discussions around real-life use cases. Each attendee receives an extensive training manual which covers the theory, practical applications and use cases, exercises and solutions together with a USB with all the materials required for the training. The course starts at 09:30 on the first day and ends at 17:00. On the second day the course starts at 09:00 and ends at 17:00. Students must bring their own laptop with an active version of Tableau Desktop 10.5 (or later) pre-installed. What People Are Saying About This Course "Steve was willing to address questions arising from his content in a full and understandable way"Lisa L. "Really enjoyed the course and feel the subject and the way it was taught was very close to my needs"James G. "The course tutor Steve was incredibly helpful and taught the information very well while making the two days very enjoyable."Bradd P. "The host and his courses will give you the tools and confidence that you need to be comfortable with Tableau."Jack S. "Steve was fantastic with his knowledge and knowhow about the product. Where possible he made sure you could put demonstrations in to working practice, to give the audience a clear understanding."Tim H. "This was a very interesting and helpful course, which will definitely help me produce smarter, cleaner visualisations that will deliver more data-driven insights within our business."Richard A. "Steve is very open to questions and will go out of his way to answer any query. Thank you"Wasif N. "Steve was willing to address questions arising from his content in a full and understandable way"Lisa L. "Really enjoyed the course and feel the subject and the way it was taught was very close to my needs"James G.

Tableau Desktop Training - Analyst
By Tableau Training Uk
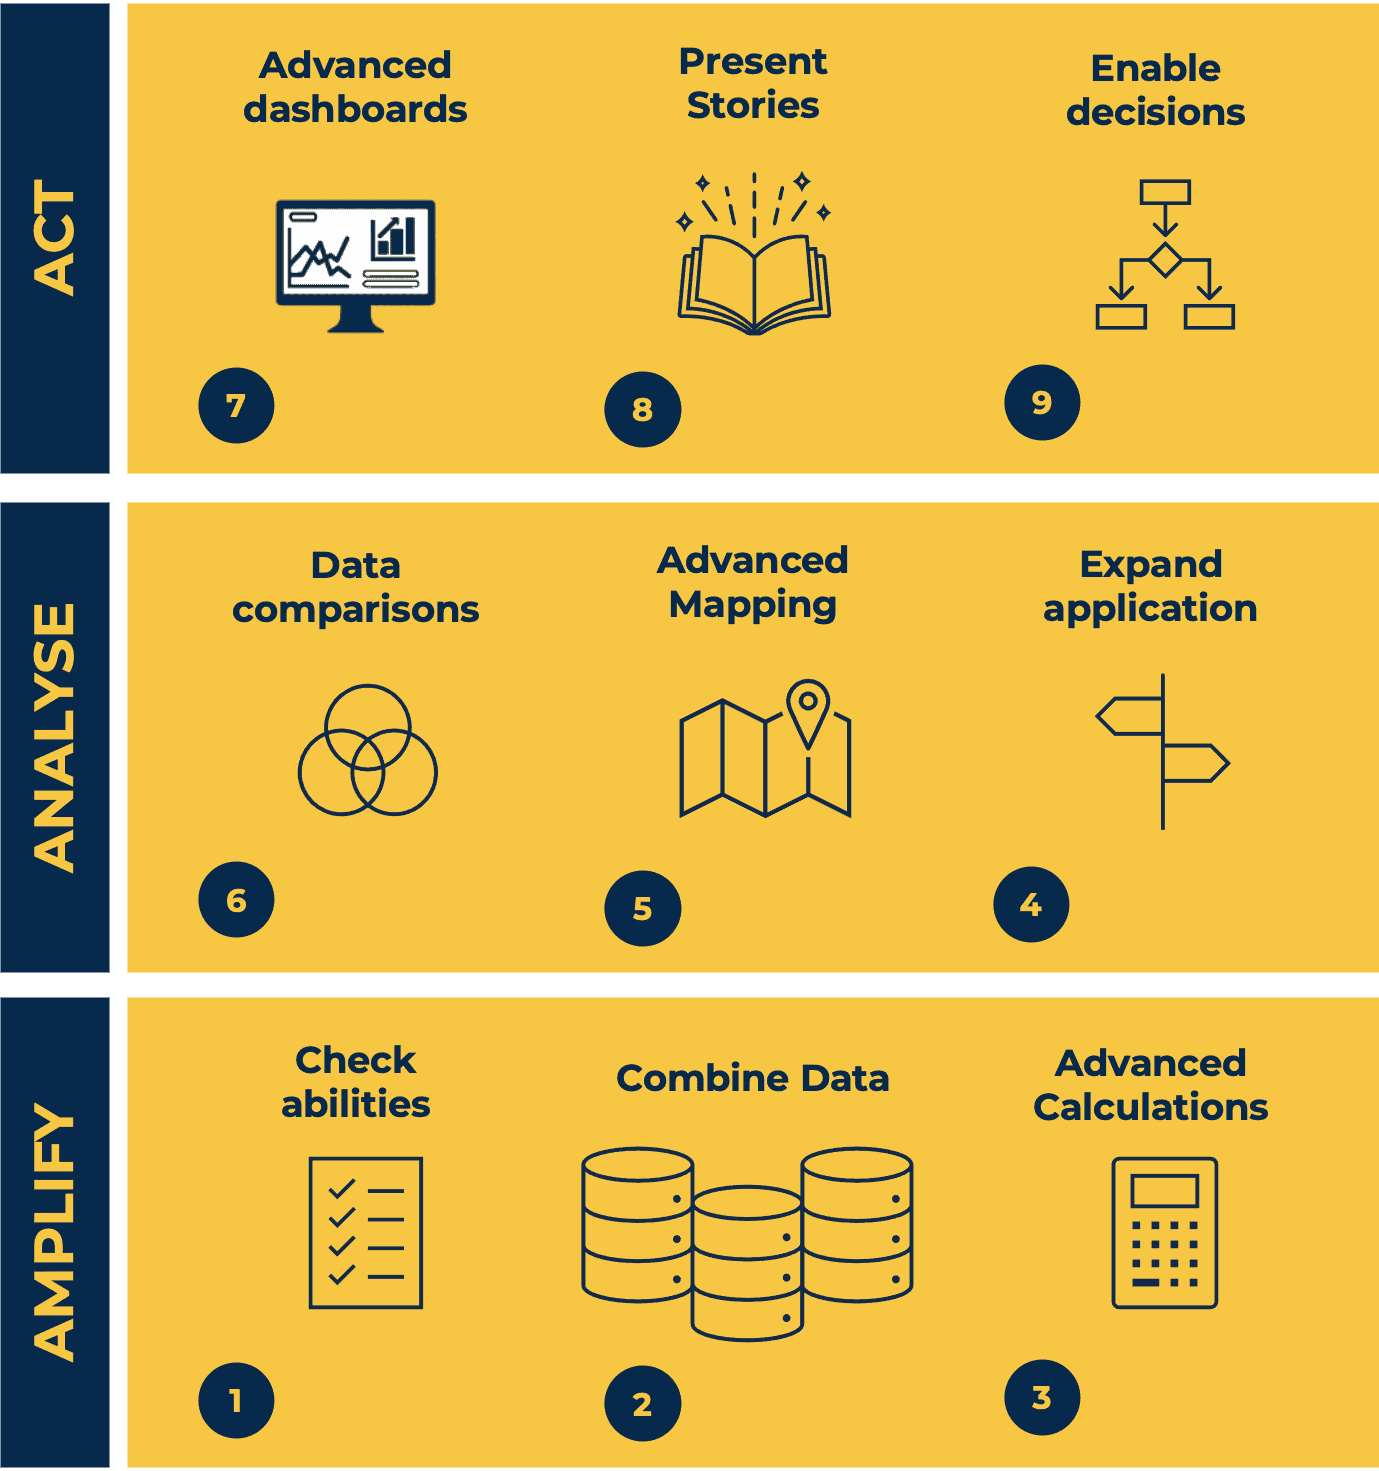
This Tableau Desktop Training intermediate course is designed for the professional who has a solid foundation with Tableau and is looking to take it to the next level. For Private options, online or in-person, please send us details of your requirements: This Tableau Desktop training intermediate course is designed for the professional who has a solid foundation with Tableau and is looking to take it to the next level. Attendees should have a good understanding of the fundamental concepts of building Tableau worksheets and dashboards typically achieved from having attended our Tableau Desktop Foundation Course. At the end of this course you will be able to communicate insights more effectively, enabling your organisation to make better decisions, quickly. The Tableau Desktop Analyst training course is aimed at people who are used to working with MS Excel or other Business Intelligence tools and who have preferably been using Tableau already for basic reporting. The course is split into 3 phases and 9 modules: Phase 1: AMPLIFY MODULE 1: CHECK ABILITIES Revision – What I Should Know What is possibleHow does Tableau deal with dataKnow your way aroundHow do we format chartsHow Tableau deals with datesCharts that compare multiple measuresCreating Tables MODULE 2: COMBINE DATA Relationships Joining Tables – Join Types, Joining tables within the same database, cross database joins, join calculations Blending – How to create a blend with common fields, Custom defined Field relationships and mismatched element names, Calculated fields in blended data sources Unions – Manual Unions and mismatched columns, Wildcard unions Data Extracts – Creating & Editing Data extracts MODULE 3: ADVANCED CALCULATIONS Row Level v Aggregations Aggregating dimensions in calculations Changing the Level of Detail (LOD) of calculations – What, Why, How Adding Table Calculations Phase 2: ANALYSE MODULE 4: EXPAND APPLICATION Making things dynamic with parameters Sets Trend Lines How do we format charts Forecasting MODULE 5: ADVANCED MAPPING Using your own images for spatial analysis Mapping with Spatial files MODULE 6: DATA COMPARISONS Advanced Charts Bar in Bar charts Bullet graphs Creating Bins and Histograms Creating a Box & Whisker plot Phase 3: ACT MODULE 7: ADVANCED DASHBOARDS Using the dashboard interface and Device layout Dashboard Actions and Viz In tooltips Horizontal & Vertical containers Navigate between dashboards MODULE 8: PRESENT STORIES Telling data driven stories MODULE 9: ENABLE DECISIONS What is Tableau Server Publishing & Permissions How can your users engage with content This training course includes over 25 hands-on exercises and quizzes to help participants “learn by doing” and to assist group discussions around real-life use cases. Each attendee receives a login to our extensive training portal which covers the theory, practical applications and use cases, exercises, solutions and quizzes in both written and video format. Students must bring their own laptop with an active version of Tableau Desktop 2018.2 (or later) pre-installed. What People Are Saying About This Course “Course was fantastic, and completely relevant to the work I am doing with Tableau. I particularly liked Steve’s method of teaching and how he applied the course material to ‘real-life’ use-cases.”Richard W., Dashboard Consulting Ltd “This course was extremely useful and excellent value. It helped me formalise my learning and I have taken a lot of useful tips away which will help me in everyday work.” Lauren M., Baillie Gifford “I would definitely recommend taking this course if you have a working knowledge of Tableau. Even the little tips Steve explains will make using Tableau a lot easier. Looking forward to putting what I’ve learned into practice.”Aron F., Grove & Dean “Steve is an excellent teacher and has a vast knowledge of Tableau. I learned a huge amount over the two days that I can immediately apply at work.”John B., Mporium “Steve not only provided a comprehensive explanation of the content of the course, but also allowed time for discussing particular business issues that participants may be facing. That was really useful as part of my learning process.”Juan C., Financial Conduct Authority “Course was fantastic, and completely relevant to the work I am doing with Tableau. I particularly liked Steve’s method of teaching and how he applied the course material to ‘real-life’ use-cases.”Richard W., Dashboard Consulting Ltd “This course was extremely useful and excellent value. It helped me formalise my learning and I have taken a lot of useful tips away which will help me in everyday work.” Lauren M., Baillie Gifford “I would definitely recommend taking this course if you have a working knowledge of Tableau. Even the little tips Steve explains will make using Tableau a lot easier. Looking forward to putting what I’ve learned into practice.”Aron F., Grove & Dean “Steve is an excellent teacher and has a vast knowledge of Tableau. I learned a huge amount over the two days that I can immediately apply at work.”John B., Mporium
Overview This comprehensive course on Interactive Dashboards with Data Studio will deepen your understanding on this topic. After successful completion of this course you can acquire the required skills in this sector. This Interactive Dashboards with Data Studio comes with accredited certification, which will enhance your CV and make you worthy in the job market. So enrol in this course today to fast track your career ladder. How will I get my certificate? You may have to take a quiz or a written test online during or after the course. After successfully completing the course, you will be eligible for the certificate. Who is This course for? There is no experience or previous qualifications required for enrolment on this Interactive Dashboards with Data Studio. It is available to all students, of all academic backgrounds. Requirements Our Interactive Dashboards with Data Studio is fully compatible with PC's, Mac's, Laptop, Tablet and Smartphone devices. This course has been designed to be fully compatible with tablets and smartphones so you can access your course on Wi-Fi, 3G or 4G. There is no time limit for completing this course, it can be studied in your own time at your own pace. Career Path Having these various qualifications will increase the value in your CV and open you up to multiple sectors such as Business & Management, Admin, Accountancy & Finance, Secretarial & PA, Teaching & Mentoring etc. Course Curriculum 2 sections • 5 lectures • 02:41:00 total length •Module 01: Introduction to GDS: 00:36:00 •Module 02: Data Visualization: 01:29:00 •Module 03: Geo-visualization: 00:16:00 •Module 04: A Socio-Economic Case Study: 00:20:00 •Assignment - Interactive Dashboards with Data Studio: 00:00:00

Advanced Analytics with Python
By Nexus Human
Duration 3 Days 18 CPD hours This course is intended for Before taking this course delegates should already be familiar with basic analytics techniques, comfortable with basic data manipulation tools such as spreadsheets and databases and already familiar with at least one programming language Overview This course teaches delegates who are already familiar with analytics techniques and at least one programming language how to effectively use the programming language for three tasks: data manipulation and preparation, statistical analysis and advanced analytics (including predictive modelling and segmentation). Mastery of these techniques will allow delegates to immediately add value in their work place by extracting valuable insight from company data to allow better, data-driven decisions. Outcomes: After completing the course, delegates will be capable of writing production-ready R code to perform advanced analytics tasks enabling their organisations make better, data-driven decisions. Becoming a world class data analytics practitioner requires mastery of the most sophisticated data analytics tools. These programming languages are some of the most powerful and flexible tools in the data analytics toolkit. Topic 1 Intro to our chosen language Topic 2 Basic programming conventions Topic 3 Data structures Topic 4 Accessing data Topic 5 Descriptive statistics Topic 6 Data visualisation Topic 7 Statistical analysis Topic 8 Advanced data manipulation Topic 9 Advanced analytics ? predictive modelling Topic 10 Advanced analytics ? segmentation

Effective Data Visualisation
By Nexus Human
Duration 2 Days 12 CPD hours This course is intended for This course is aimed at anyone currently working with data who is interested in using data visualisation to more effectively communicate their results. Overview At completion, delegates will understand how data visualisations can be best used to communicate actionable insights from data and be competent with the tools required to do it. Visualising data, and analytics results, is one of the most effective ways to achieve this. This course will cover the theory of data visualisation along with practical skills for creating compelling visualisations from data. Course Outline The use of analytics, statistics and data science in business has grown massively in recent years. Harnessing the power of data is opening actionable insights in diverse industries from banking to horse breeding. The companies doing this most successfully understand that using sophisticated analytics approaches to unlock insights from data is only half the job. Communicating these insights to all of the different parts of an organisation is just as important as doing the actual analysis. Visualising data, and analytics results, is one of the most effective ways to achieve this. This course will cover the theory of data visualisation along with practical skills for creating compelling visualisations from data. To attend this course delegates should be competent in the use of data analysis tools such as reporting tools, spreadsheet software or business intelligence tools. The course will explore the following topics through a series of interactive workshop sessions: Fundamentals of data visualisation Data characteristics & dimensions Mapping visual encodings to data dimensions Colour theory Graphical perception & communication Interaction design Visualisation different characteristics of data: trends, comparisons, correlations, maps, networks, hierarchies, text Designing effective dashboards
The Complete Masterclass on PL-900 Certification
By Packt
Prepare for success with the Microsoft PL-900 Certification Course, covering the fundamentals of Power Platform, including Power BI, Power Apps, Power Automate, Power Virtual Agents, and related topics such as Dataverse, AI Builder, Connectors, Dynamics 365, Teams, Security, and Administration. Suitable for beginners with no prerequisites.

Data Analysis Level 3 Diploma
By Compete High
Overview With the ever-increasing demand for Data Analysis Level 3 Diploma in personal & professional settings, this online training aims at educating, nurturing, and upskilling individuals to stay ahead of the curve - whatever their level of expertise in Data Analysis Level 3 Diploma may be. Learning about Data Analysis Level 3 Diploma or keeping up to date on it can be confusing at times, and maybe even daunting! But that's not the case with this course from Compete High. We understand the different requirements coming with a wide variety of demographics looking to get skilled in Data Analysis Level 3 Diploma . That's why we've developed this online training in a way that caters to learners with different goals in mind. The course materials are prepared with consultation from the experts of this field and all the information on Data Analysis Level 3 Diploma is kept up to date on a regular basis so that learners don't get left behind on the current trends/updates. The self-paced online learning methodology by compete high in this Data Analysis Level 3 Diploma course helps you learn whenever or however you wish, keeping in mind the busy schedule or possible inconveniences that come with physical classes. The easy-to-grasp, bite-sized lessons are proven to be most effective in memorising and learning the lessons by heart. On top of that, you have the opportunity to receive a certificate after successfully completing the course! Instead of searching for hours, enrol right away on this Data Analysis Level 3 Diploma course from Compete High and accelerate your career in the right path with expert-outlined lessons and a guarantee of success in the long run. Who is this course for? While we refrain from discouraging anyone wanting to do this Data Analysis Level 3 Diploma course or impose any sort of restrictions on doing this online training, people meeting any of the following criteria will benefit the most from it: Anyone looking for the basics of Data Analysis Level 3 Diploma , Jobseekers in the relevant domains, Anyone with a ground knowledge/intermediate expertise in Data Analysis Level 3 Diploma , Anyone looking for a certificate of completion on doing an online training on this topic, Students of Data Analysis Level 3 Diploma , or anyone with an academic knowledge gap to bridge, Anyone with a general interest/curiosity Career Path This Data Analysis Level 3 Diploma course smoothens the way up your career ladder with all the relevant information, skills, and online certificate of achievements. After successfully completing the course, you can expect to move one significant step closer to achieving your professional goals - whether it's securing that job you desire, getting the promotion you deserve, or setting up that business of your dreams. Course Curriculum Module 1 Introduction to Data Analysis. Introduction to Data Analysis. 00:00 Module 2 Mathematics and Statistics. Mathematics and Statistics. 00:00 Module 3 Data Manipulation. Data Manipulation. 00:00 Module 4 Data Visualisation. Data Visualisation. 00:00 Module 5 Data Wrangling. Data Wrangling. 00:00 Module 6 Data Exploration. Data Exploration. 00:00 Module 7 Machine Learning Fundamentals. Machine Learning Fundamentals. 00:00 Module 8 Machine Learning Algorithms. Machine Learning Algorithms. 00:00 Module 9 Data Analysis with Python and Libraries. Data Analysis with Python and Libraries. 00:00 Module 10 Data Analysis with R and Libraries. Data Analysis with R and Libraries. 00:00

Google Datastudio Training
By Compete High
Overview With the ever-increasing demand for Google Data Studio in personal & professional settings, this online training aims at educating, nurturing, and upskilling individuals to stay ahead of the curve - whatever their level of expertise in Google Data Studio may be. Learning about Google Data Studio or keeping up to date on it can be confusing at times, and maybe even daunting! But that's not the case with this course from Compete High. We understand the different requirements coming with a wide variety of demographics looking to get skilled in Google Data Studio . That's why we've developed this online training in a way that caters to learners with different goals in mind. The course materials are prepared with consultation from the experts of this field and all the information on Google Data Studio is kept up to date on a regular basis so that learners don't get left behind on the current trends/updates. The self-paced online learning methodology by compete high in this Google Data Studio course helps you learn whenever or however you wish, keeping in mind the busy schedule or possible inconveniences that come with physical classes. The easy-to-grasp, bite-sized lessons are proven to be most effective in memorising and learning the lessons by heart. On top of that, you have the opportunity to receive a certificate after successfully completing the course! Instead of searching for hours, enrol right away on this Google Data Studio course from Compete High and accelerate your career in the right path with expert-outlined lessons and a guarantee of success in the long run. Who is this course for? While we refrain from discouraging anyone wanting to do this Google Data Studio course or impose any sort of restrictions on doing this online training, people meeting any of the following criteria will benefit the most from it: Anyone looking for the basics of Google Data Studio , Jobseekers in the relevant domains, Anyone with a ground knowledge/intermediate expertise in Google Data Studio , Anyone looking for a certificate of completion on doing an online training on this topic, Students of Google Data Studio , or anyone with an academic knowledge gap to bridge, Anyone with a general interest/curiosity Career Path This Google Data Studio course smoothens the way up your career ladder with all the relevant information, skills, and online certificate of achievements. After successfully completing the course, you can expect to move one significant step closer to achieving your professional goals - whether it's securing that job you desire, getting the promotion you deserve, or setting up that business of your dreams. Course Curriculum Module 01 Introduction to Google Data Studio Introduction to Google Data Studio 00:00 Module 02 Why Use Google Data Studio Over Others Why Use Google Data Studio Over Others 00:00 Module 03 How to Use Google Data Studio How to Use Google Data Studio 00:00 Module 04 Dashboard In Google Data Studio Dashboard In Google Data Studio 00:00 Module 05 How to Create Report In Google Data Studio How to Create Report In Google Data Studio 00:00 Module 06 Additional Features in Google Data Studio Additional Features in Google Data Studio 00:00 Module 07 Google Data Studio Calculated Formula and Functions Google Data Studio Calculated Formula and Functions 00:00 Module 08 Google Data Studio Data Blending and Sharing Reports Google Data Studio Data Blending and Sharing Reports 00:00 Module 09 Ways to Share Google Data Studio Reports Ways to Share Google Data Studio Reports 00:00

Business Intelligence Analyst Course
By The Teachers Training
Unlock the potential of business intelligence with our specialized Business Intelligence Analyst Course. Learn to analyze data, extract insights, and drive strategic decisions to optimize business performance. Gain practical skills in data visualization, reporting, and predictive analytics using industry-leading tools and techniques. Whether you're a business professional or aspiring analyst, this course equips you with the expertise to excel in leveraging data for business intelligence.

Master Business Analysis skills by enrolling the Business Analysis Advanced Course course. The course covers the essential management and leadership aspects of the analysis role, the analysis of budget and finance, market evaluation, analysing competition and selecting marketing strategies. In spite of these, the course lets you design a business plan and helps you to choose the right staffs for you. Why choose this course Earn an e-certificate upon successful completion. Accessible, informative modules taught by expert instructors Study in your own time, at your own pace, through your computer tablet or mobile device Benefit from instant feedback through mock exams and multiple-choice assessments Get 24/7 help or advice from our email and live chat teams Full Tutor Support on Weekdays Course Design The course is delivered through our online learning platform, accessible through any internet-connected device. There are no formal deadlines or teaching schedules, meaning you are free to study the course at your own pace. You are taught through a combination of Video lessons Online study materials Mock exams Multiple-choice assessment Certificate of Achievement Endorsed Certificate of Achievement from the Quality Licence Scheme Once the course has been completed and the assessment has been passed, all students are entitled to receive an endorsed certificate. This will provide proof that you have completed your training objectives, and each endorsed certificate can be ordered and delivered to your address for only £119. Please note that overseas students may be charged an additional £10 for postage. CPD Certificate of Achievement from Janets Upon successful completion of the course, you will be able to obtain your course completion e-certificate. Print copy by post is also available at an additional cost of £9.99 and PDF Certificate at £4.99. Endorsement This course and/or training programme has been endorsed by the Quality Licence Scheme for its high-quality, non-regulated provision and training programmes. This course and/or training programme is not regulated by Ofqual and is not an accredited qualification. Your training provider will be able to advise you on any further recognition, for example progression routes into further and/or higher education. For further information please visit the Learner FAQs on the Quality Licence Scheme website. Method of Assessment To successfully complete the course, students will have to take an automated multiple-choice exam. This exam will be online and you will need to score 60% or above to pass the course. After successfully passing the exam, you will be able to apply for Quality Licence Scheme endorsed certificate of achievement. To verify your enhanced skills in the subject, we recommend that you also complete the assignment questions. These can be completed at any time which is convenient for yourself and will be assessed by our in-house specialised tutors. Full feedback will then be given on your current performance, along with any further advice or support.