- Professional Development
- Medicine & Nursing
- Arts & Crafts
- Health & Wellbeing
- Personal Development
663 Business Analytics & Intelligence courses delivered Online

Overview This comprehensive course on Business Analystics for Beginners Using SASS will deepen your understanding on this topic. After successful completion of this course you can acquire the required skills in this sector. This Business Analystics for Beginners Using SASS comes with accredited certification from CPD, which will enhance your CV and make you worthy in the job market. So enrol in this course today to fast-track your career ladder. How will I get my certificate? You may have to take a quiz or a written test online during or after the course. After successfully completing the course, you will be eligible for the certificate. Who is This course for? There is no experience or previous qualifications required for enrolment on this Business Analystics for Beginners Using SASS. It is available to all students, of all academic backgrounds. Requirements Our Business Analystics for Beginners Using SASS is fully compatible with PC's, Mac's, Laptop, Tablet and Smartphone devices. This course has been designed to be fully compatible with tablets and smartphones so you can access your course on Wi-Fi, 3G or 4G. There is no time limit for completing this course, it can be studied in your own time at your own pace. Career Path Learning this new skill will help you to advance in your career. It will diversify your job options and help you develop new techniques to keep up with the fast-changing world. This skillset will help you to- Open doors of opportunities Increase your adaptability Keep you relevant Boost confidence And much more! Course Curriculum 13 sections • 73 lectures • 08:10:00 total length •SAS Introduction: 00:07:00 •Introduction to SAS Program: 00:05:00 •Read SAS Dataset: 00:09:00 •Practice Read Dataset: 00:08:00 •Practical Example on Read Dataset: 00:02:00 •Introduction to SAS Dataset: 00:12:00 •SAS Dataset Practical Example: 00:07:00 •SAS Dataset Practical Program: 00:06:00 •DateValue: 00:03:00 •SAS Formats Part 1: 00:13:00 •SAS Formats Part 2: 00:09:00 •Reading Excel Worksheets: 00:05:00 •Reading Excel Worksheet Example: 00:11:00 •Date Format Example: 00:06:00 •Raw Data File Standard Part 1: 00:09:00 •Raw Data File Standard Part 2: 00:08:00 •Raw Data File Standard Example: 00:06:00 •Raw Data File Non Standard: 00:07:00 •Raw Data File Non Standard Example: 00:06:00 •Length Statement: 00:02:00 •Compilation Execution: 00:04:00 •Heading: 00:01:00 •Dataerrors: 00:05:00 •Data Errorsz Example: 00:03:00 •Validate Data Procfreq: 00:05:00 •Validate Data Procpront: 00:07:00 •Validate Data Peocmeans: 00:05:00 •Dat Constant: 00:07:00 •Assignment Statement: 00:09:00 •If Then Statement: 00:09:00 •If Then Do End Statement: 00:09:00 •Diff Where and If Statement: 00:02:00 •Keep Drop: 00:08:00 •Keep Drop Example: 00:04:00 •Append: 00:09:00 •Append Examples part 1: 00:09:00 •Append Examples part 2: 00:07:00 •Concatenate: 00:12:00 •Merge: 00:06:00 •Merge One to One: 00:07:00 •Merge One to Many: 00:04:00 •Merge Non Match: 00:04:00 •Global Statements: 00:09:00 •Global Statements Examples Part 1: 00:08:00 •Global Statements Examples Part 2: 00:06:00 •Title n Foot Note: 00:05:00 •Title n Foot Note Example: 00:08:00 •By Statement: 00:08:00 •Multiple Where Stament: 00:03:00 •ODS: 00:07:00 •ODS Example: 00:04:00 •Sas Date Function: 00:10:00 •Sas Date Function Example: 00:08:00 •Sas Functions Part 1: 00:10:00 •Sas Functions Part 2: 00:08:00 •Sas Functions: 00:07:00 •Sas Functions Example Part 1: 00:07:00 •Sas Functions Example Part 2: 00:09:00 •Multiple SAS Datasets Part 1: 00:05:00 •Multiple SAS Datasets Part 2: 00:02:00 •Multiple SAS Datasets Example: 00:09:00 •Select Group: 00:09:00 •Select Group Example: 00:08:00 •Do Loop Part 1: 00:07:00 •Do Loop Part 2: 00:06:00 •Do Loop Example: 00:07:00 •Array Part 1: 00:05:00 •Array Part 2: 00:08:00 •Array DoLoop: 00:06:00 •ArrayTemp: 00:05:00 •Array Example: 00:10:00 •Sas Statement Part 1: 00:04:00 •Sas Statement Part 2: 00:05:00

Register on the Excel PowerQuery and PowerPivot today and build the experience, skills and knowledge you need to enhance your professional development and work towards your dream job. Study this course through online learning and take the first steps towards a long-term career. The course consists of a number of easy to digest, in-depth modules, designed to provide you with a detailed, expert level of knowledge. Learn through a mixture of instructional video lessons and online study materials. Receive online tutor support as you study the course, to ensure you are supported every step of the way. Get a digital certificate as a proof of your course completion. The Excel PowerQuery and PowerPivot is incredibly great value and allows you to study at your own pace. Access the course modules from any internet-enabled device, including computers, tablet, and smartphones. The course is designed to increase your employability and equip you with everything you need to be a success. Enrol on the now and start learning instantly! What You Get With The Excel PowerQuery and PowerPivot Receive a e-certificate upon successful completion of the course Get taught by experienced, professional instructors Study at a time and pace that suits your learning style Get instant feedback on assessments 24/7 help and advice via email or live chat Get full tutor support on weekdays (Monday to Friday) Course Design The course is delivered through our online learning platform, accessible through any internet-connected device. There are no formal deadlines or teaching schedules, meaning you are free to study the course at your own pace. You are taught through a combination of Video lessons Online study materials Certification After the successful completion of the final assessment, you will receive a CPD-accredited certificate of achievement. The PDF certificate is for £9.99, and it will be sent to you immediately after through e-mail. You can get the hard copy for £15.99, which will reach your doorsteps by post. Who Is This Course For: The course is ideal for those who already work in this sector or are an aspiring professional. This course is designed to enhance your expertise and boost your CV. Learn key skills and gain a professional qualification to prove your newly-acquired knowledge. Requirements: The online training is open to all students and has no formal entry requirements. To study the Excel PowerQuery and PowerPivot, all your need is a passion for learning, a good understanding of English, numeracy, and IT skills. You must also be over the age of 16. Course Content Excel PowerQuery and PowerPivot pivot table power query power pivot - 1 00:09:00 pivot table power query power pivot - 2 00:01:00 pivot table power query power pivot - 3 00:02:00 pivot table power query power pivot - 4 00:03:00 pivot table power query power pivot - 5 00:01:00 pivot table power query power pivot - 6 00:04:00 pivot table power query power pivot - 7 00:08:00 pivot table power query power pivot - 8 00:05:00 pivot table power query power pivot - 9 00:03:00 pivot table power query power pivot - 10 00:04:00 pivot table power query power pivot - 11 00:04:00 pivot table power query power pivot - 12 00:02:00 pivot table power query power pivot - 13 00:03:00 pivot table power query power pivot - 14 00:05:00 pivot table power query power pivot - 15 00:02:00 pivot table power query power pivot - 16 00:03:00 pivot table power query power pivot - 17 00:03:00 pivot table power query power pivot - 18 00:08:00 pivot table power query power pivot - 19 00:02:00 pivot table power query power pivot - 20 00:04:00 pivot table power query power pivot - 21 00:05:00 pivot table power query power pivot - 22 00:09:00 pivot table power query power pivot - 23 00:04:00 pivot table power query power pivot - 24 00:03:00 pivot table power query power pivot - 25 00:04:00 pivot table power query power pivot - 26 00:09:00 Resources Resources - Excel PowerQuery And PowerPivot 00:00:00 Frequently Asked Questions Are there any prerequisites for taking the course? There are no specific prerequisites for this course, nor are there any formal entry requirements. All you need is an internet connection, a good understanding of English and a passion for learning for this course. Can I access the course at any time, or is there a set schedule? You have the flexibility to access the course at any time that suits your schedule. Our courses are self-paced, allowing you to study at your own pace and convenience. How long will I have access to the course? For this course, you will have access to the course materials for 1 year only. This means you can review the content as often as you like within the year, even after you've completed the course. However, if you buy Lifetime Access for the course, you will be able to access the course for a lifetime. Is there a certificate of completion provided after completing the course? Yes, upon successfully completing the course, you will receive a certificate of completion. This certificate can be a valuable addition to your professional portfolio and can be shared on your various social networks. Can I switch courses or get a refund if I'm not satisfied with the course? We want you to have a positive learning experience. If you're not satisfied with the course, you can request a course transfer or refund within 14 days of the initial purchase. How do I track my progress in the course? Our platform provides tracking tools and progress indicators for each course. You can monitor your progress, completed lessons, and assessments through your learner dashboard for the course. What if I have technical issues or difficulties with the course? If you encounter technical issues or content-related difficulties with the course, our support team is available to assist you. You can reach out to them for prompt resolution.

Oracle BI Publisher 12c R1: Fundamentals
By Nexus Human
Duration 3 Days 18 CPD hours This course is intended for Analyst Developer End User Implementer Overview Schedule and Burst Reports Perform Translations Create Reports Integrated With Oracle BI EE Administer BI Publisher Server Describe BI Publisher Technology and Architecture Create reports from OBI EE data sources Create and Modify Data Models Create RTF Templates by Using Template Builder Explore and Use the Form Field Method for Creating RTF Templates Create Layouts by Using the Layout Editor This Oracle BI Publisher 12c training will help you build a foundation of understanding how to best leverage this solution. Through Classroom Training or Live Virtual Class Training, you'll learn the ins and outs of how to use this solution. BI Publisher Technology and Architecture Functional Components Layout Templates Multitier Architecture Enterprise Server Architecture and Performance and Scalability Document Generation Process and Output Formats Supported Data Sources Bursting Overview Internationalization and Language Support Getting Started with BI Publisher Logging In, the Home Page, and Global Header, and Setting Account Preferences Viewing Reports Managing Repository Objects Managing Favorites Using Create Report wizard to Create Reports Selecting Data: Data Model, Spreadsheet, and BI Subject Area Configuring Report Properties Using the Data Model Editor Exploring the Schemas Used in the Course Exploring the Data Model Editor UI and the Supported Data Sources Creating a Private Data Source Creating a Simple Data Model based on a SQL Query Data Set Using Query Builder to Build a Query Viewing Data and Saving Sample Data Sets Adding Parameters and LOVs to the Query Configuring Parameter Settings and Viewing Reports with Parameters Working with Layout Editor Opening the Layout Editor and Navigating the Layout Editor UI Creating a Layout by Using a Basic Template Inserting a Layout Grid Adding a Table, Formatting Columns, Defining Sorts and Groups, and Applying Conditional Formats Inserting and Editing Charts, and Converting Charts to a Pivot Tables Adding Repeating Sections, Text Items, and Images Working with Lists, Gauges and Pivot Tables Creating Boilerplates Using Template Builder to Create RTF Templates Using the BI Publisher Menu Bar Creating an RTF Template from a Sample, Changing Field Properties, and Previewing Table Data Adding a Chart to an RTF Template Designing an RTF Template for a BI Publisher Report Creating a BI Publisher Report by Using Template Builder in Online Mode Exploring the Basic and Form Field Methods Exploring Advanced RTF Template Techniques Including Conditional Formats, Watermarks, Page-Level Calculations, Running Totals, Grouping, and Sorting BI Publisher Server: Administration and Security Describing the Administration Page Creating the JDBC Connections Setting, Viewing, and Updating Data Sources Describing the Security Model for BI Publisher and Oracle Fusion Middleware Describing Groups, Users, Roles, and Permissions Describing Delivery Options Including Print, Fax, Email, WebDav, HTTP Server, FTP, and CUPS Describing and Configuring BI Publisher Scheduler Integrating with Oracle BI Presentation Services and Oracle Endeca Server Scheduling and Bursting Reports Scheduling and Describing a Report Job and Related Options Managing and Viewing a Report Job Viewing Report Job History Scheduling a Report with Trigger Describing Bursting Adding a Bursting Definition to a Data Model Scheduling a Bursting Job Integrating BI Publisher with Oracle BI Enterprise Edition Configuring Presentation Services Integration Navigating Oracle BI EE Creating a Report based on OBI EE Subject Area Creating a Data Model and Report based on a BI Server SQL Query Creating a Data Model and Report based on an Oracle BI Analysis Adding a BI Publisher Report to an Oracle BI EE Dashboard Creating Data Models and BI Publisher Reports Based on Other Data Sources Configuring Presentation Services Integration Describing the Web Services Data Source Describing the HTTP (XML/RSS Feed) Data Source Explaining Proxy Setting for Web Services and HTTP Data Sources Creating a BI Publisher Report based on an External Web Service Creating a BI Publisher Report based on an HTTP Data Set Creating a BI Publisher Report Based on XML File Creating a BI Publisher Report Based on CSV Data source Performing Translations Describing Translation Types Translating by Using the Localized Template Option Translating by Using the XLIFF Option Managing XLIFF Translations on BI Publisher Server Describing the Overall Translation Process Describing Catalog Translation Exporting and Importing the XLIFF for a Catalog Folder Additional course details: Nexus Humans Oracle BI Publisher 12c R1: Fundamentals training program is a workshop that presents an invigorating mix of sessions, lessons, and masterclasses meticulously crafted to propel your learning expedition forward. This immersive bootcamp-style experience boasts interactive lectures, hands-on labs, and collaborative hackathons, all strategically designed to fortify fundamental concepts. Guided by seasoned coaches, each session offers priceless insights and practical skills crucial for honing your expertise. Whether you're stepping into the realm of professional skills or a seasoned professional, this comprehensive course ensures you're equipped with the knowledge and prowess necessary for success. While we feel this is the best course for the Oracle BI Publisher 12c R1: Fundamentals course and one of our Top 10 we encourage you to read the course outline to make sure it is the right content for you. Additionally, private sessions, closed classes or dedicated events are available both live online and at our training centres in Dublin and London, as well as at your offices anywhere in the UK, Ireland or across EMEA.

55125 Quick SQL Server Analysis Services
By Nexus Human
Duration 2 Days 12 CPD hours This course is intended for This course is intended for SQL professionals, Microsoft Analysis Services cube and report developers, and business intelligence professionals. Overview ?Understand common Analysis Services solutions.?Understand version changes of SSAS from 2008-2014.?Understand Analysis Services installation and architecture.?Understand how to choose the right model.?Understand the Analysis Services tools available.?Understand the multidimensional model.?Utilize data sources and data source views.?Create a cube.?Understand and utilize dimensions.?Understand and utilize attributes.?Understand and utilize relationships.?Understand and utilize hierarchies.?Understand and utilize measures and measure groups.?Understand and utilize calculated members.?Understand and utilize perspectives.?Understand and utilize translations.?Browse perspectives and translations.?Understand and utilize deployment options.?Understand and utilize processing strategies.?Understand and utilize security.?Deploy a multidimensional model.?Understand the tabular model.?Create a tabular project.?Analyze the data using Microsoft Excel.?Create and configure calculated measures and calculated fields.?Backup and Restore. This course is intended for IT professionals who are interested in quickly learning how to utilize an Analysis Services multidimensional or tabular solution. Course Overview Introduction Course Materials Facilities Prerequisites What We'll Be Discussing Lab 1: Course Overview Introduction to Microsoft SQL Server Analysis Services Common Analysis Services Solutions Version Changes of SSAS from 2008-2014 Analysis Services Installation and Architecture: One Product, Two Models Choosing the Right Model Analysis Services Tools Lab 1: Introduction to Microsoft SQL Server Analysis Services The Multidimensional Solution Understanding the Multidimensional Model Utilizing Data Sources and Data Source Views Creating a Cube Lab 1: The Multidimensional Solution Dissecting with Dimensions Developing Dimensions Utilizing Attributes Relating with Relationships Handling Hierarchies Lab 1: Dissecting with Dimensions Managing Measures Measures and Measure Groups Calculated Members Lab 1: Managing Measures Configuring Cube Options Understanding Perspectives Utilizing Translations Browsing Perspectives and Translations Lab 1: Configuring Cube Options Deploying Examining Deployment Options Processing Strategies Exploring Security Lab 1: Deploying The Tabular Solution Understanding the Tabular Model Creating a Tabular Project Deploying Browsing the Model Querying the Solution and Understanding DAX Maintaining and Optimizing Lab 1: The Tabular Solution
Preparing for Digital Transformation (On-Demand)
By IIL Europe Ltd
Preparing for Digital Transformation (On-Demand) The goal of this course is to enable you to become knowledgeable about the technologies behind a digital transformation in your organization and the driving forces compelling such a transformation. You will learn how to become engaged in the processes of transforming your organization digitally to meet with the growing demands of customers and clients. Organizations today must keep pace with changing technology to stay abreast of the market demand. Keeping pace means a transformation of the entire organization into the digital age. This workshop presents the challenges, benefits, and pitfalls of digital transformation and how it will affect you, and how you can be better prepared and positioned for the upcoming digital transformation. You will learn how to become engaged in the processes of transforming your organization digitally to meet with the growing demands of customers and clients. What you will Learn Describe the impact that digital is making on the economy and on customer expectations Examine the nature and drivers of the digital transformation Evaluate new technologies such as Blockchain, Big Data, Artificial Intelligence, and other technologies and see how they work to bring about digital transformation Assess the impact of digital technologies on the current roles and positions in the organization Discuss both the demand that customers have for digital technologies and the impact the digital technologies have on the customer and its relationship with the organization Recognize the new technology trends in the digital transformation and what they mean to the future of the organization Identify how digital transformation will affect all roles and how to be prepared for the upcoming and continuing digital transformation Getting Started Foundation Concepts Digital transformation versus automation Driving forces behind the digital transformation Learning from digital transformation successes Digital Transformation and Customer Orientation The Digital Customer Customer touch points and the customer journey Omnichannel concept Transform to the customer Digital Technologies and the Organization Relationship Management Big Data: The Basis for it All The Human Factor in Digital Transformations Risks of Digital Transformation Technology Trends Data and Business Analytics Other Major Trends Preview of Coming Attractions Pathway to Digital Transformation Summary and Next Steps


B6158 IBM Cognos Analytics - Author Reports Fundamentals (v11.0.x)
By Nexus Human
Duration 3 Days 18 CPD hours This course is intended for Report Authors Overview What is IBM Cognos Analytics ? Reporting Examine dimensionally modelled and dimensional data sources Examine personal data sources and data modules Examine List reports Aggregate measure/fact data Use shared dimensions to create multi-fact queries Add repeated information to reports Create crosstab reports Create complex crosstab reports Format, sort, and aggregate data in a crosstab report Create discontinuous crosstab reports Create Visualization reports Add business logic to reports using IBM Cognos Analytics ? Reporting Focus reports using filters Focus reports using prompts Augment reports using calculations Extend report functionality in IBM Cognos Analytics - Reporting Customize reports with conditional formatting Conditionally format one crosstab measure based on another Drill-through definitions Enhance the report layout Use additional report building techniques This offering provides Business and Professional Authors with an introduction to report building techniques using relational data models. Techniques to enhance, customize, and manage professional reports will be explored. Activities will illustrate and reinforce key concepts during this learning opportunity. What is IBM Cognos Analytics - Reporting? Create a simple list report Create a report from a dimensionally modeled relational data source Examine personal data sources and data modules Upload personal data Upload custom images Use navigation paths Create a report from a personal data source Examine list reports Group data in a list Format columns in a list Include headers and footers in a list Enhance a list report Aggregate measure/fact data Identify differences in aggregation Explore data aggregation Use shared dimensions to create multi-fact queries Create a multi-fact query in a list report Add repeated information to reports Create a mailing list report Create crosstab reports Add measures to a crosstab Data sources for a crosstab Create a simple crosstab report Create complex crosstab reports Add items as peers Create crosstab nodes and crosstab members Create a complex crosstab report Format, sort, and aggregate data in a crosstab Sort, format, and aggregate a crosstab report Create discontinuous crosstab reports Present unrelated items using a discontinuous crosstab Create a visualization report Create and format a visualization report Create a report that uses a Map visualization Show the same data graphically and numerically Focus reports using filters Apply filters to a report Apply a detail filter on fact data in a report Apply a summary filter to a report Focus reports using prompts Create a prompt by adding a parameter Add a value prompt to a report Add a Select & search prompt to a report Create a cascading prompt Augment reports using calculations Add calculations to a report Display prompt selections in the report title Customize reports with conditional formatting Create a multilingual report Highlight exceptional data and conditionally render a column Drill-through definitions Let users navigate to related data in IBM Cognos Analytics Enhance report layout Create a report structured on data items Create a condensed list report Use additional report building techniques Section a report and reuse objects within the same report Reuse layout components in a different report Explore options for reports that contain no data Additional course details: Nexus Humans B6158 IBM Cognos Analytics - Author Reports Fundamentals (v11.0.x) training program is a workshop that presents an invigorating mix of sessions, lessons, and masterclasses meticulously crafted to propel your learning expedition forward. This immersive bootcamp-style experience boasts interactive lectures, hands-on labs, and collaborative hackathons, all strategically designed to fortify fundamental concepts. Guided by seasoned coaches, each session offers priceless insights and practical skills crucial for honing your expertise. Whether you're stepping into the realm of professional skills or a seasoned professional, this comprehensive course ensures you're equipped with the knowledge and prowess necessary for success. While we feel this is the best course for the B6158 IBM Cognos Analytics - Author Reports Fundamentals (v11.0.x) course and one of our Top 10 we encourage you to read the course outline to make sure it is the right content for you. Additionally, private sessions, closed classes or dedicated events are available both live online and at our training centres in Dublin and London, as well as at your offices anywhere in the UK, Ireland or across EMEA.
Tableau Desktop Training - Foundation
By Tableau Training Uk
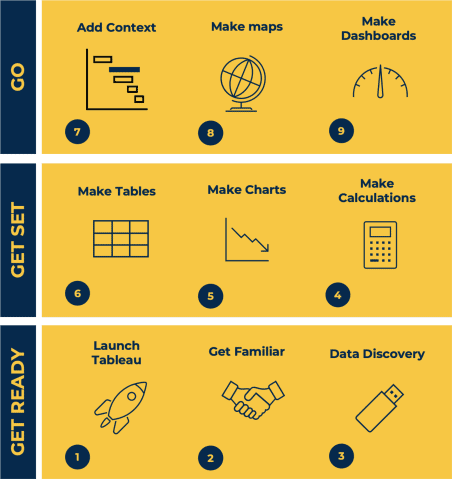
This Tableau Desktop Training course is a jumpstart to getting report writers and analysts with little or no previous knowledge to being productive. It covers everything from connecting to data, through to creating interactive dashboards with a range of visualisations in two days of your time. For Private options, online or in-person, please send us details of your requirements: This Tableau Desktop Training course is a jumpstart to getting report writers and analysts with little or no previous knowledge to being productive. It covers everything from connecting to data, through to creating interactive dashboards with a range of visualisations in two days of your time. Having a quick turnaround from starting to use Tableau, to getting real, actionable insights means that you get a swift return on your investment of time and money. This accelerated approach is key to getting engagement from within your organisation so everyone can immediately see and feel the impact of the data and insights you create. This course is aimed at someone who has not used Tableau in earnest and may be in a functional role, eg. in sales, marketing, finance, operations, business intelligence etc. The course is split into 3 phases and 9 modules: PHASE 1: GET READY MODULE 1: LAUNCH TABLEAU Check Install & Setup Why is Visual Analytics Important MODULE 2: GET FAMILIAR What is possible How does Tableau deal with data Know your way around How do we format charts Dashboard Basics – My First Dashboard MODULE 3: DATA DISCOVERY Connecting to and setting up data in Tableau How Do I Explore my Data – Filters & Sorting How Do I Structure my Data – Groups & Hierarchies, Visual Groups How Tableau Deals with Dates – Using Discrete and Continuous Dates, Custom Dates Phase 2: GET SET MODULE 4: MAKE CALCULATIONS How Do I Create Calculated Fields & Why MODULE 5: MAKE CHARTS Charts that Compare Multiple Measures – Measure Names and Measure Values, Shared Axis Charts, Dual Axis Charts, Scatter Plots Showing Relational & Proportional Data – Pie Charts, Donut Charts, Tree Maps MODULE 6: MAKE TABLES Creating Tables – Creating Tables, Highlight Tables, Heat Maps Phase 3: GO MODULE 7: ADD CONTEXT Reference Lines and Bands MODULE 8: MAKE MAPS Answering Spatial Questions – Mapping, Creating a Choropleth (Filled) Map MODULE 9: MAKE DASHBOARDS Using the Dashboard Interface Dashboard Actions This training course includes over 25 hands-on exercises and quizzes to help participants “learn by doing” and to assist group discussions around real-life use cases. Each attendee receives a login to our extensive training portal which covers the theory, practical applications and use cases, exercises, solutions and quizzes in both written and video format. Students must use their own laptop with an active version of Tableau Desktop 2018.2 (or later) pre-installed. What People Are Saying About This Course “Excellent Trainer – knows his stuff, has done it all in the real world, not just the class room.”Richard L., Intelliflo “Tableau is a complicated and powerful tool. After taking this course, I am confident in what I can do, and how it can help improve my work.”Trevor B., Morrison Utility Services “I would highly recommend this course for Tableau beginners, really easy to follow and keep up with as you are hands on during the course. Trainer really helpful too.”Chelsey H., QVC “He is a natural trainer, patient and very good at explaining in simple terms. He has an excellent knowledge base of the system and an obvious enthusiasm for Tableau, data analysis and the best way to convey results. We had been having difficulties in the business in building financial reports from a data cube and he had solutions for these which have proved to be very useful.”Matthew H., ISS Group
Visual Analytics Best Practice
By Tableau Training Uk
This course is very much a discussion, so be prepared to present and critically analyse your own and class mates work. You will also need to bring a few examples of work you have done in the past. Learning and applying best practice visualisation principles will improve effective discussions amongst decision makers throughout your organisation. As a result more end-users of your dashboards will be able to make better decisions, more quickly. This 2 Day training course is aimed at analysts with good working knowledge of BI tools (we use Tableau to present, but attendees can use their own software such as Power BI or Qlik Sense). It is a great preparation for taking advanced certifications, such as Tableau Certified Professional. Contact us to discuss the Visual Analytics Best Practice course Email us if you are interested in an on-site course, or would be interested in different dates and locations This Tableau Desktop training intermediate course is designed for the professional who has a solid foundation with Tableau and is looking to take it to the next level. Attendees should have a good understanding of the fundamental concepts of building Tableau worksheets and dashboards typically achieved from having attended our Tableau Desktop Foundation Course. At the end of this course you will be able to communicate insights more effectively, enabling your organisation to make better decisions, quickly. The Tableau Desktop Analyst training course is aimed at people who are used to working with MS Excel or other Business Intelligence tools and who have preferably been using Tableau already for basic reporting. The course includes the following topics: WHAT IS VISUAL ANALYSIS? Visual Analytics Visual Analytics Process Advantages of Visual Analysis Exercise: Interpreting Visualisations HOW DO WE PROCESS VISUAL INFORMATION? Memory and Processing Types Exercise: Identifying Types of Processing Cognitive Load Exercise: Analysing Cognitive Load Focus and Guide the Viewer Remove Visual Distractions Organise Information into Chunks Design for Proximity Exercise: Reducing Cognitive Load SENSORY MEMORY Pre-attentive Attributes Quantitatively-Perceived Attributes Categorically-Perceived Attributes Exercise: Analysing Pre-attentive Attributes Form & Attributes Exercise: Using Form Effectively Colour & Attributes Exercise: Using Colour Effectively Position & Attributes Exercise: Using Position Effectively ENSURING VISUAL INTEGRITY Informing without Misleading Gestalt Principles Visual Area Axis & Scale Colour Detail Exercise: Informing without Misleading CHOOSING THE RIGHT VISUALISATION Comparing and Ranking Categories Comparing Measures Comparing Parts to Whole Viewing Data Over Time Charts Types for Mapping Viewing Correlation Viewing Distributions Viewing Specific Values DASHBOARDS AND STORIES Exercise: Picking the Chart Type Exercise: Brainstorming Visual Best Practice Development Process for Dashboards and Stories Plan the Visualisation Create the Visualisation Test the Visualisation Exercise: Designing Dashboards and Stories This training course includes over 20 hands-on exercises to help participants “learn by doing” and to assist group discussions around real-life use cases. Each attendee receives an extensive training manual which covers the theory, practical applications and use cases, exercises and solutions together with a USB with all the materials required for the training. The course starts at 09:30 on the first day and ends at 17:00. On the second day the course starts at 09:00 and ends at 17:00. Students must bring their own laptop with an active version of Tableau Desktop 10.5 (or later) pre-installed. What People Are Saying About This Course "Steve was willing to address questions arising from his content in a full and understandable way"Lisa L. "Really enjoyed the course and feel the subject and the way it was taught was very close to my needs"James G. "The course tutor Steve was incredibly helpful and taught the information very well while making the two days very enjoyable."Bradd P. "The host and his courses will give you the tools and confidence that you need to be comfortable with Tableau."Jack S. "Steve was fantastic with his knowledge and knowhow about the product. Where possible he made sure you could put demonstrations in to working practice, to give the audience a clear understanding."Tim H. "This was a very interesting and helpful course, which will definitely help me produce smarter, cleaner visualisations that will deliver more data-driven insights within our business."Richard A. "Steve is very open to questions and will go out of his way to answer any query. Thank you"Wasif N. "Steve was willing to address questions arising from his content in a full and understandable way"Lisa L. "Really enjoyed the course and feel the subject and the way it was taught was very close to my needs"James G.