- Professional Development
- Medicine & Nursing
- Arts & Crafts
- Health & Wellbeing
- Personal Development
169 Business Analytics & Intelligence courses in Whetstone delivered Live Online
Business Process Modeling: In-House Training
By IIL Europe Ltd
Business Process Modeling: In-House Training This course is part of IIL's Business Analysis Certificate Program (BACP), a program designed to help prepare individuals pass the IIBA® Certification exam to become a Certified Business Analysis Professional (CBAP®). Learn more at www.iil.com/bacp A process model is a description of a process in terms of its steps or actions, the data flowing between them and participants in the process, machines, systems, and organizations involved. Modeling is a critical business analysis skill. It applies graphical and text communication techniques to describe the actions, objects, and relationships acted upon in the process and the steps that act upon them. This course teaches the technique of process modeling and ties together the core methods of process, behavior, and data modeling to enable business analysts to fully describe business processes in levels of detail from multiple perspectives. What you will Learn Upon completion, participants will be able to: Identify business processes and their components Work with UML diagrams Use process modeling in business diagramming Diagram and model business processes Foundation Concepts The role of the business analyst The IIBA® BABOK® Knowledge Areas Business Process Modeling (BPM) and the business analyst A practical approach to business process modeling The Context for Modeling Business Processes Overview of context for business process modeling Analyzing stakeholder information Modeling best practices Critical inputs for BPM: Business Rules Critical inputs for BPM: Context Diagrams Data Models Overview of data modeling Entity relationship diagrams Object-oriented approach Class diagrams Other data models Process Models - Part I (Non-UML) Overview of process modeling Data flow diagrams Workflow diagrams Flowcharts Process Models - Part II (UML) Overview of UML Process Models UML Activity Diagrams UML Sequence Diagrams Usage Models - Part I (Non-UML) Overview of usage modeling Prototyping options Static prototyping and storyboards Dynamic prototyping User Interface Design and user stories Usage Models - Part II (UML Use Cases) Overview of Use Cases Use Case diagrams Use Case descriptions Use Cases and the product life cycle Integrating the Models Overview of integrating the models General analysis best practices Specific analysis techniques summary Best practices for transition to design Summary and Next Steps What did we learn and how can we implement this in our work environments?

55123 Writing Reports with Report Builder and SSRS Level 1
By Nexus Human
Duration 2 Days 12 CPD hours This course is intended for The primary audience for this course are persons who are new to reporting with Microsoft© SQL Server© Report Builder and SSRS, persons who are transitioning from another reporting software application, and persons who are existing Report Builder and SSRS report authors. Overview Navigate the Report Builder Environment. - Create table reports. - Format reports. - Create basic and complex expressions. - Group report data. - Create matrix reports. - Sort and filter data. - Summarize data with charts. - Print and export reports. In this course, students will continue their learning on the foundations of report writing with Microsoft© SQL Server© Report Builder and SSRS. Prerequisites ?Familiarity with Windows. ?Creating and navigating folders. ?Opening programs. ?Manipulating windows. ?Copying and pasting objects. ?Formatting text. ?Saving files. 1 - Exploring the Report Builder Environment Introducing the Report Builder Environment Working with Existing Reports Lab 1: Exploring the Report Builder Application 2 - Adding Data to Table Reports Create Report Data Sources Create Report Datasets Work with the Tablix Data Region Create a Table Report Lab 1: Creating Table Reports 3 - Formatting Data and Creating Expressions in Reports Formatting Reports Sorting and Filtering Report Data Adding Data to a Dataset Creating Simple Expressions Creating Complex Expressions Lab 1: Formatting Reports 4 - Grouping Report Data Group Data in Reports Group Data Using an Expression Creating Subgroups and Group Aggregates Lab 1: Creating Reports with Groups and Aggregates 5 - Matrix Reports Creating and Modifying Matrix Data Regions Creating and Modifying Column Groups Lab 1: Creating Matrix Reports 6 - Charts Create and Modify Chart Wizard Reports Add Charts to Existing Reports Modify Charts in Reports Lab 1: Creating Charts and Chart Reports 7 - Printing and Exporting Reports Print Features and Print Options Export Reports Lab 1: Printing and Exporting Reports

Advanced Visualization with Power BI (AVIAD)
By Online Productivity Training
OVERVIEW Prerequisites—DIAD training or equivalent working experience This one-day course will cover Power BI report layouts and structure the agile process to creating Power BI data visualizations. It will help attendees to understand the art behind visualizations, the implications behind choosing the right charts, the impact of color, shape, and size, and finally the use of Power BI custom visuals. The course includes various design patterns of dashboards and reports, as well as best practices for authoring great reports and dashboards for business users. The course content is managed by the Power BI engineering team at Microsoft. There is no exam associated with the course. COURSE BENEFITS: Understand the need for storytelling with data Understand the agile process to creating Power BI data visualizations Understand the art behind visualizations Gain familiarity with Power BI report layouts and structure Understand implications behind choosing the right charts Gain familiarity with using Power BI custom visuals WHO IS THE COURSE FOR? Power BI report developers who wish to improve the aesthetic quality of their reports Power BI and other BI practitioners who would like to understand more about the theory of data visualization BI practitioners who wish to create reports that communicate the meaning behind the data more clearly Power BI users who would like to explore the types of chart and visual available that answer different types of business question COURSE OUTLINE Module 1 What Is Storytelling With Data? Volume, Velocity and Variety The importance of business questions What is a story in this context? Module 2 The Science Behind Data Visualization Basic problems to avoid Memory and visualization Ways to spark iconic, short-term and long-term memory Module 3 The Process Behind Data Visualization Using an agile approach to report development Data structure and data grain Converting the story to a data model Module 4 Dashboards And Reports Terminology and definitions Dashboard layout and structure Report layout and structure Storyboarding Drill-through, bookmarks, toggles and tooltips Module 5 Chart Selection Charts for comparison Time series Proportions Constructing effective tables, cards and slicers Scatterplots Module 6 Accessibility And Custom Visuals Report accessibility checklists Custom visuals Creating a custom R visual Charticulator Module 7 Publishing And Formatting Colour schemes Making a Power BI theme Use of fonts, icons and symbols Sizing dashboard and report tiles Sparklines, hyperlinks and images Module 8 Report Authoring - Best Practices Design thought process The audience Defining the platform environment The user experience Visualization Implementation and testing Optimization Module 9 Dashboard And Goals Design Tips and tricks Best practices for dashboard design Tracking business metrics with goals

Writing and Managing Requirements Documents: Virtual In-House Training
By IIL Europe Ltd
Writing and Managing Requirements Documents: Virtual In-House Training This course is part of IIL's Business Analysis Certificate Program (BACP), a program designed to help prepare individuals pass the IIBA™ Certification exam to become a Certified Business Analysis Professional (CBAP™). Learn more at www.iil.com/bacp. Once a business analyst has completed the information gathering and analysis to produce the solution to a business problem, the results must be documented for all stakeholders to see and understand. This course will enhance the skill set needed for writing and managing the complex readership that business analysts interact with on a day-to-day basis. What you will Learn Upon completion, participants will be able to: Write an understood requirements document that is approvable and acceptable Validate a requirements document Manage the changes to requirements documents through the SDLC Foundation Concepts The role of the business analyst An introduction to the BABOK® Guide The business analyst and the product/project life cycle The requirements documentation process Planning for Effective Requirements Documentation Overview of requirements planning Planning for validation Planning for verification: well-formed criteria Planning for verification: understood and usable criteria Writing Effective Requirements Documents Overview of writing requirements documents Using a standard structure / template Applying formatting techniques Meeting the challenge of writing non-functional requirements Baselining Requirements Documents Overview of the requirements baseline process Validation Verification Approval Managing Requirements Change through the Product Life Cycle Overview of requirements change management Establishing a formal change management process Tracing requirements through design and development (build, test, and implementation) Following through to post-implementation (transition and early production)
Business Process Modeling: Virtual In-House Training
By IIL Europe Ltd
Business Process Modeling: Virtual In-House Training This course is part of IIL's Business Analysis Certificate Program (BACP), a program designed to help prepare individuals pass the IIBA® Certification exam to become a Certified Business Analysis Professional (CBAP®). Learn more at www.iil.com/bacp A process model is a description of a process in terms of its steps or actions, the data flowing between them and participants in the process, machines, systems, and organizations involved. Modeling is a critical business analysis skill. It applies graphical and text communication techniques to describe the actions, objects, and relationships acted upon in the process and the steps that act upon them. This course teaches the technique of process modeling and ties together the core methods of process, behavior, and data modeling to enable business analysts to fully describe business processes in levels of detail from multiple perspectives. What you will Learn Upon completion, participants will be able to: Identify business processes and their components Work with UML diagrams Use process modeling in business diagramming Diagram and model business processes Foundation Concepts The role of the business analyst The IIBA® BABOK® Knowledge Areas Business Process Modeling (BPM) and the business analyst A practical approach to business process modeling The Context for Modeling Business Processes Overview of context for business process modeling Analyzing stakeholder information Modeling best practices Critical inputs for BPM: Business Rules Critical inputs for BPM: Context Diagrams Data Models Overview of data modeling Entity relationship diagrams Object-oriented approach Class diagrams Other data models Process Models - Part I (Non-UML) Overview of process modeling Data flow diagrams Workflow diagrams Flowcharts Process Models - Part II (UML) Overview of UML Process Models UML Activity Diagrams UML Sequence Diagrams Usage Models - Part I (Non-UML) Overview of usage modeling Prototyping options Static prototyping and storyboards Dynamic prototyping User Interface Design and user stories Usage Models - Part II (UML Use Cases) Overview of Use Cases Use Case diagrams Use Case descriptions Use Cases and the product life cycle Integrating the Models Overview of integrating the models General analysis best practices Specific analysis techniques summary Best practices for transition to design Summary and Next Steps What did we learn and how can we implement this in our work environments?


Commercial Awareness - Tools and Analysis
By Mpi Learning - Professional Learning And Development Provider
In today's fast-changing competitive environment, people in all roles need to have more commercial awareness and responsibility.


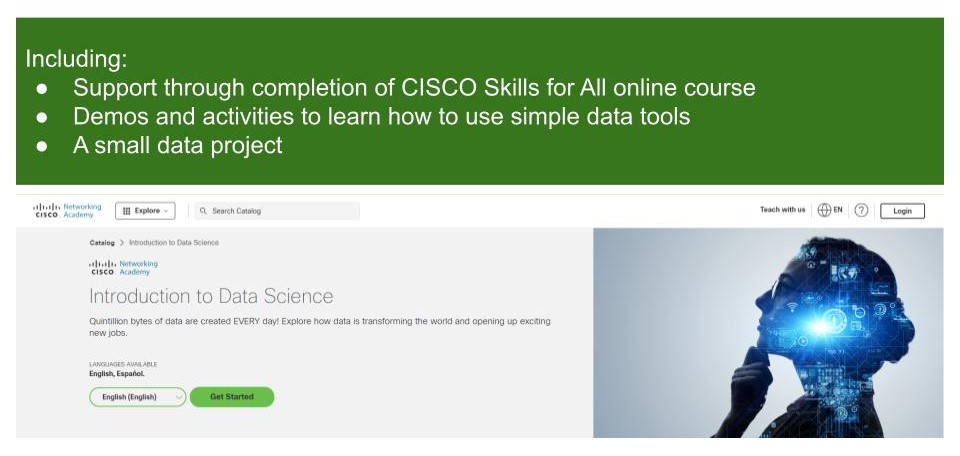
Introduction to Data Science
By futureCoders SE
Learn the basics of Data Science, combining a supported #CISCO Skills for All online course with practical learning and a project to help consolidate the learning.