- Professional Development
- Medicine & Nursing
- Arts & Crafts
- Health & Wellbeing
- Personal Development
1355 Business Analysis courses
Level 3 Diploma in Skills for Business: Finance: 8-in-1 Premium Online Courses Bundle
By Compete High
🧠 Build real employability with the Level 3 Diploma in Skills for Business: Finance — 8-in-1 Premium Online Courses Bundle, your launchpad into careers in taxation, business analytics, corporate finance, and data-driven strategy. With must-have skills in GDPR, Tableau, Sage, and tax regulations, this qualification equips you to thrive in entry-level finance, data analytics, business support, and finance management roles. 💼 Whether you want to work in SMEs, corporates, finance teams, or tech start-ups, this diploma covers the right keywords and competencies. 🏆 And yes — Compete High earns 4.8 on Reviews.io and 4.3 on Trustpilot. 📝 Description Companies are hiring now — and they’re looking for well-rounded candidates who know how to use data, interpret financial trends, and work within legal and GDPR frameworks. This bundle prepares you for: Business analysis Tax roles Sage implementation Stress-managed work environments You’ll stand out for roles in: Financial administration Business support Regulatory compliance Tax and accounts management ❓ FAQ Q: What roles will this help me get? A: Business analyst, tax assistant, Sage technician, GDPR consultant, and business developer are all ideal paths. Q: Can I take this as a beginner? A: Yes — it's perfect for those looking to enter the business-finance world with a solid foundation. Q: Do employers trust this provider? A: Yes — with 4.8 on Reviews.io and 4.3 on Trustpilot, Compete High is a leader in career-ready education.

Assuring Quality Through Acceptance Testing: In-House Training
By IIL Europe Ltd
Assuring Quality Through Acceptance Testing: In-House Training It is also the business analyst's responsibility to confirm that the resulting solution developed by IT does, in fact, solve the defined problem. This is done first through testing, especially acceptance testing, and then through monitoring of the installed solution in the user community. It is the business analyst's job to define the business problem to be solved by IT. It is also the business analyst's responsibility to confirm that the resulting solution developed by IT does, in fact, solve the defined problem. This is done first through testing, especially acceptance testing, and then through monitoring of the installed solution in the user community. The business analyst is not only concerned with the testing itself, but also with the management and monitoring of the users doing the acceptance testing, and recording, analyzing, and evaluating the results. What you will Learn Upon completion, participants will be able to: Create a set of acceptance test cases Manage and monitor an acceptance test stage where users perform the testing Work with the development team in the systems testing stage Assess the solution once it is in the business environment Foundation Concepts The role of the business analyst An introduction to the BABOK® Guide BA roles and relationships through the project life cycle Introduction to assuring software quality through acceptance testing The Scope of IT Testing Overview of testing stages The testing process Testing documentation Pre-Acceptance Testing The BA's role in testing Early development testing stages (unit and integration) Late development testing stage (system) The Acceptance Test Stage - Part I (Planning, Design, and Development) Overview of user acceptance testing Acceptance test planning Designing user acceptance tests Developing individual user acceptance test cases Building effective user acceptance test scenarios The Acceptance Test Stage - Part II (Execution and Reporting) Operating guidelines Execution Reporting Post-Acceptance Testing Overview Project implementation Project transition (project closure) Production through retirement Testing Commercial Off-the-Shelf (COTS) Software Overview Selecting the software Implementing the software Summary What did we learn and how can we implement this in our work environments?

Assuring Quality Through Acceptance Testing
By IIL Europe Ltd
Assuring Quality Through Acceptance Testing It is also the business analyst's responsibility to confirm that the resulting solution developed by IT does, in fact, solve the defined problem. This is done first through testing, especially acceptance testing, and then through monitoring of the installed solution in the user community. It is the business analyst's job to define the business problem to be solved by IT. It is also the business analyst's responsibility to confirm that the resulting solution developed by IT does, in fact, solve the defined problem. This is done first through testing, especially acceptance testing, and then through monitoring of the installed solution in the user community. The business analyst is not only concerned with the testing itself, but also with the management and monitoring of the users doing the acceptance testing, and recording, analyzing, and evaluating the results. What you will Learn Upon completion, participants will be able to: Create a set of acceptance test cases Manage and monitor an acceptance test stage where users perform the testing Work with the development team in the systems testing stage Assess the solution once it is in the business environment Foundation Concepts The role of the business analyst An introduction to the BABOK® Guide BA roles and relationships through the project life cycle Introduction to assuring software quality through acceptance testing The Scope of IT Testing Overview of testing stages The testing process Testing documentation Pre-Acceptance Testing The BA's role in testing Early development testing stages (unit and integration) Late development testing stage (system) The Acceptance Test Stage - Part I (Planning, Design, and Development) Overview of user acceptance testing Acceptance test planning Designing user acceptance tests Developing individual user acceptance test cases Building effective user acceptance test scenarios The Acceptance Test Stage - Part II (Execution and Reporting) Operating guidelines Execution Reporting Post-Acceptance Testing Overview Project implementation Project transition (project closure) Production through retirement Testing Commercial Off-the-Shelf (COTS) Software Overview Selecting the software Implementing the software Summary What did we learn and how can we implement this in our work environments?
Unlock the power of data with our 'Data Analytics with Tableau' course, a gateway to visualising and understanding your business's most crucial insights. Whether you're analysing sales, human resources, or stock prices, our expertly curated projects will equip you with the prowess to transform raw data into actionable strategies. With Tableau at your fingertips, you'll navigate diverse datasets from Discount Mart's profits to Tesla's stock prices, and more. This course isn't just about data; it's about weaving compelling stories that drive decision-making, all while delving into the foundations of database concepts. Learning Outcomes Understand the core functionalities of Tableau for data visualisation. Analyse and interpret datasets from various business domains such as sales, HR, and stock markets. Craft Tableau stories that effectively communicate insights and drive decisions. Acquire foundational knowledge of database concepts pertinent to data analytics. Gain proficiency in executing projects and transforming business questions into analytical solutions. Why choose this Certificate in Data Analytics with Tableau at QLS Level 3 course? Unlimited access to the course for a lifetime. Opportunity to earn a certificate accredited by the CPD Quality Standards after completing this course. Structured lesson planning in line with industry standards. Immerse yourself in innovative and captivating course materials and activities. Assessments are designed to evaluate advanced cognitive abilities and skill proficiency. Flexibility to complete the course at your own pace, on your own schedule. Receive full tutor support throughout the week, from Monday to Friday, to enhance your learning experience. Who is this Certificate in Data Analytics with Tableau at QLS Level 3 for? Individuals seeking to elevate their data visualisation skills using Tableau. Business analysts and consultants aiming to harness the power of data-driven storytelling. Marketing professionals keen on deriving actionable insights from data. Finance and HR professionals looking to analyse datasets effectively. Entrepreneurs aiming to make data-driven decisions for their enterprises. Career path Data Analyst: £25,000 - £40,000 Tableau Developer: £30,000 - £55,000 Business Intelligence Analyst: £28,000 - £50,000 Data Visualisation Expert: £32,000 - £57,000 HR Analytics Specialist: £29,000 - £52,000 Stock Market Data Analyst: £27,000 - £48,000 Prerequisites This Certificate in Data Analytics with Tableau at QLS Level 3 does not require you to have any prior qualifications or experience. You can just enrol and start learning. This course was made by professionals and it is compatible with all PC's, Mac's, tablets and smartphones. You will be able to access the course from anywhere at any time as long as you have a good enough internet connection. Certification After studying the course materials, there will be a written assignment test which you can take at the end of the course. After successfully passing the test you will be able to claim the pdf certificate for £4.99 Original Hard Copy certificates need to be ordered at an additional cost of £8. Endorsed Certificate of Achievement from the Quality Licence Scheme Learners will be able to achieve an endorsed certificate after completing the course as proof of their achievement. You can order the endorsed certificate for only £85 to be delivered to your home by post. For international students, there is an additional postage charge of £10. Endorsement The Quality Licence Scheme (QLS) has endorsed this course for its high-quality, non-regulated provision and training programmes. The QLS is a UK-based organisation that sets standards for non-regulated training and learning. This endorsement means that the course has been reviewed and approved by the QLS and meets the highest quality standards. Please Note: Studyhub is a Compliance Central approved resale partner for Quality Licence Scheme Endorsed courses. Course Curriculum Module 01: Introduction to the Course Introduction to the Course 00:02:00 What is Tableau?An Introduction to Tableau 00:03:00 How this course is Structured 00:01:00 Installing the Free Full Version of Tableau 00:02:00 Module 02: Project 1: Discount Mart (Sales and Profit Analytics) Project Brief for Discount Mart 00:03:00 Connecting and Preparing Data for Discount Mart 00:15:00 Building Charts on Tableau for Discount Mart (Part 1) 00:33:00 Building Charts on Tableau for Discount Mart (Part 2) 00:16:00 Creating Headline Cards on Tableau for Discount Mart 00:10:00 Building and Publishing Dashboards on Tableau 00:15:00 Module 03: Project 2: Green Destinations (HR Analytics) Project Brief for Green Destinations 00:02:00 Connecting and Preparing Data for Green Destinations 00:09:00 Building Charts on Tableau (Part 1) for Green Destinations 00:28:00 Building Charts on Tableau (Part 2) for Green Destinations 00:08:00 Creating Headline Cards on Tableau 00:12:00 Building a Dashboard for Green Destinations 00:12:00 Publish your Dashboard to Tableau Public 00:03:00 Module 04: Project 3: Superstore (Sales Agent Tracker) Project Brief for Super Store 00:02:00 Connecting and Preparing Data for Super Store 00:17:00 Building Charts on Tableau (Part 1) for Super Store 00:34:00 Building Charts on Tableau (Part 2) for Super Store 00:23:00 Building a Dashboard 00:18:00 Publish your Dashboard to Tableau Public 00:03:00 Module 05: Northwind Trade (Shipping Analytics) Project Brief for Northwind Trade 00:03:00 Connecting and Preparing Data for Northwind Trade 00:14:00 Building Charts on Tableau for Northwind Trade 00:37:00 Building and Publishing Dashboards for Northwind Trade 00:10:00 Module 06: Project 5: Tesla (Stock Price Analytics) Project Brief for Tesla 00:02:00 Creating a Data Source through Google Sheet Functions 00:05:00 Connect to the Data for Tesla 00:04:00 Building Charts on Tableau for Tesla 00:22:00 Building Headline Cards 00:09:00 Building a Tesla Dashboard 00:08:00 Publish your Dashboard to Tableau Public 00:03:00 Module 07: Bonus: Introduction to Database Concepts Introduction to Database Concepts 00:01:00 Understanding Relational Databases 00:04:00 Relationships of Database Entities 00:02:00 Primary and Foreign Keys 00:01:00 Data types and Naming Conventions 00:04:00 Module 08: Tableau Stories Creating Stories on Tableau 00:05:00 Resources Resources - Certificate in Data Analytics with Tableau at QLS Level 3 00:00:00 Assignment Assignment - Certificate in Data Analytics with Tableau at QLS Level 3 04:00:00 Order your QLS Endorsed Certificate Order your QLS Endorsed Certificate 00:00:00

Business Management: 8 in 1 Premium Courses Bundle
By Compete High
Business doesn’t run on spreadsheets alone—although they do help. This 8-in-1 bundle brings together core topics for managing people, projects, problems, and plans. Whether you’re sharpening your operations knowledge or figuring out why a project keeps going sideways, this bundle provides structured learning you can put to work online. Courses include business management, analysis, law, project oversight, operations, and crisis handling. You’ll also explore key communication techniques and how to spot development opportunities without second-guessing every email. Designed to cut through clutter and focus on decision-ready concepts, this training is ideal for future and current business leaders who like things clear and purposeful. 🎯 Learning Outcomes: Understand key components of modern business operations. Learn structured steps for project planning and execution. Apply communication skills in business and team settings. Gain business law awareness to support professional decisions. Learn business analysis for evaluating current performance. Explore how to manage through business crisis situations. 👤 Who is this Course For: Aspiring managers looking to understand business basics. Team leads aiming to grow business responsibility knowledge. Entrepreneurs structuring their growing business operations. Admin staff involved in planning or team coordination. Analysts seeking better understanding of business structures. Office managers supporting decision-making roles. Supervisors responsible for handling projects or teams. Professionals preparing for leadership and planning roles. 💼 Career Path (UK Average Salaries): Business Manager – £45,000 per year Operations Analyst – £37,000 per year Project Manager – £42,000 per year Business Development Officer – £40,000 per year Crisis Response Planner – £38,000 per year Business Analyst – £44,000 per year
Operations Management Mini Bundle
By Compete High
The Operations Management Mini Bundle keeps business flow from turning into business chaos. This isn’t about theory—it’s about structure. From supply chains to procurement strategies and all the spreadsheets in between, this bundle aims to help you connect dots in any operational setup (and maybe untangle a few while you're at it). Covering people management and data-driven business analysis, the content remains grounded in process rather than waffle. If you’ve ever wondered what keeps warehouses ticking, teams motivated, and orders arriving on time—this course bundle has a clue. Or five. ✅ Learning Outcomes Understand operations processes across supply and business functions. Manage people with clear objectives and task allocation frameworks. Break down business data to support key operational decisions. Develop insight into procurement planning and vendor coordination. Track supply chains using logistics principles and inventory control. Align team and process objectives with operational expectations. ✅ Who is this Course For Office managers involved in supply or operations decision-making. Procurement staff looking to refine purchasing strategies. Supervisors aiming to manage teams with structured objectives. Analysts seeking basics of operational or supply metrics. Admins supporting purchasing, delivery or logistics departments. Coordinators managing supplier relations or internal order flow. HR personnel assisting with team planning and people oversight. Business owners improving internal operational efficiency. ✅ Career Path Operations Coordinator – £32,000 average UK salary Procurement Assistant – £29,000 average UK salary Supply Chain Administrator – £31,000 average UK salary Business Analyst (Junior) – £35,000 average UK salary Team Supervisor – £28,500 average UK salary Purchasing Officer – £30,000 average UK salary

Mortgage Advisor Mini Bundle
By Compete High
The Mortgage Advisor Mini Bundle brings together the pillars of the property world: law, management, estate agency, analysis, and the necessary rules. Whether you're drawn to bricks and mortar or the calculations that sit behind them, this bundle takes a no-frills look at the theory of managing, advising, and evaluating within the property sector. It’s suitable for those interested in the structural backbone of finance, legislation, and business insight. If you’ve ever stared at a mortgage quote wondering what it all meant—this bundle gives you the academic footing to understand the finer points without reaching for the aspirin. Learning Outcomes: Understand property law and legal aspects of estate transactions. Learn core estate agency principles and property presentation ideas. Study property management and development in structured modules. Examine risk-related policies and financial frameworks in housing. Explore business analysis approaches for evaluating housing markets. Identify key documentation and legal considerations in property. Who is this Course For: Aspiring mortgage advisers with a taste for housing concepts. Property professionals needing structured insight into legal theory. Estate agents seeking to expand theoretical service knowledge. Individuals preparing for roles in housing or lettings advice. Business-focused learners analysing housing and property sectors. Students with an interest in property development and finance. Analysts exploring property metrics and sales strategies. Learners wanting clarity on legal rules in estate matters. Career Path: Mortgage Adviser – £35,000/year Property Manager – £33,000/year Estate Agent – £30,000/year Lettings Consultant – £28,500/year Business Analyst (Property) – £40,000/year Housing Officer – £31,000/year


55128 Writing Reports with Report Builder and SSRS Level 2
By Nexus Human
Duration 2 Days 12 CPD hours This course is intended for The primary audience for this course are persons who are new to reporting with Microsoft© SQL Server© Report Builder and SSRS, persons who are transitioning from another reporting software application, and persons who are existing Report Builder and SSRS report authors. The secondary audience for this course are persons who are using Report Designer (SSRS). Course participants may be business analysts, programmer analysts, data analysts, database administrators, or IT professionals and may or may not have experience with Microsoft© SQL Server© Report Builder and SSRS, programming (Visual Basic), and/or Transact-Structured Query Language (T-SQL) experience. Overview After completing this course, students will be able to: Create parameter reports. Create list reports. Format reports with complex expressions. Add images and subreports. Add drilldown and drillthrough functionality. Add sparklines, data bars, and indicators. In this course, students will continue their learning on the foundations of report writing with Microsoft© SQL Server© Report Builder and SSRS. The focus will be on report creation by connecting to a database and manipulating the data. 1 - Parameter Reports Parameterized Reporting Create Report Parameters Modify Report Parameters Provide Default Parameter Values Provide Available Values for Parameters Lab: Creating Parameterized Reports 2 - List Data Regions Introducing the List Data Region Create Reports Using List Data Regions Modify Reports Which Use List Data Regions Lab: Creating List Reports 3 - Enhancing Reports with Complex Expressions Formatting Reports Top N Reports Running Values Lab: Enhancing Reports with Complex Expressions 4 - Enhance Reports with Images and Subreports Add Images to Reports Retrieve Images from a Database Introducing SSRS (SQL Server Reporting Services) Report Server Add Subreports to Reports Lab: Working With Images and Subreports 5 - Drilldown and Drillthrough Reports Add and Configure Drilldown Reporting Add and Configure Drillthrough Reporting Lab: Add Drilldown and Drillthrough Functionality to Reports 6 - Sparklines, Data Bars, and Indicators Sparklines Data Bars Indicators Lab: Adding Sparklines, Data Bars, and Indicators to Reports Additional course details: Nexus Humans 55128 Writing Reports with Report Builder and SSRS Level 2 training program is a workshop that presents an invigorating mix of sessions, lessons, and masterclasses meticulously crafted to propel your learning expedition forward. This immersive bootcamp-style experience boasts interactive lectures, hands-on labs, and collaborative hackathons, all strategically designed to fortify fundamental concepts. Guided by seasoned coaches, each session offers priceless insights and practical skills crucial for honing your expertise. Whether you're stepping into the realm of professional skills or a seasoned professional, this comprehensive course ensures you're equipped with the knowledge and prowess necessary for success. While we feel this is the best course for the 55128 Writing Reports with Report Builder and SSRS Level 2 course and one of our Top 10 we encourage you to read the course outline to make sure it is the right content for you. Additionally, private sessions, closed classes or dedicated events are available both live online and at our training centres in Dublin and London, as well as at your offices anywhere in the UK, Ireland or across EMEA.

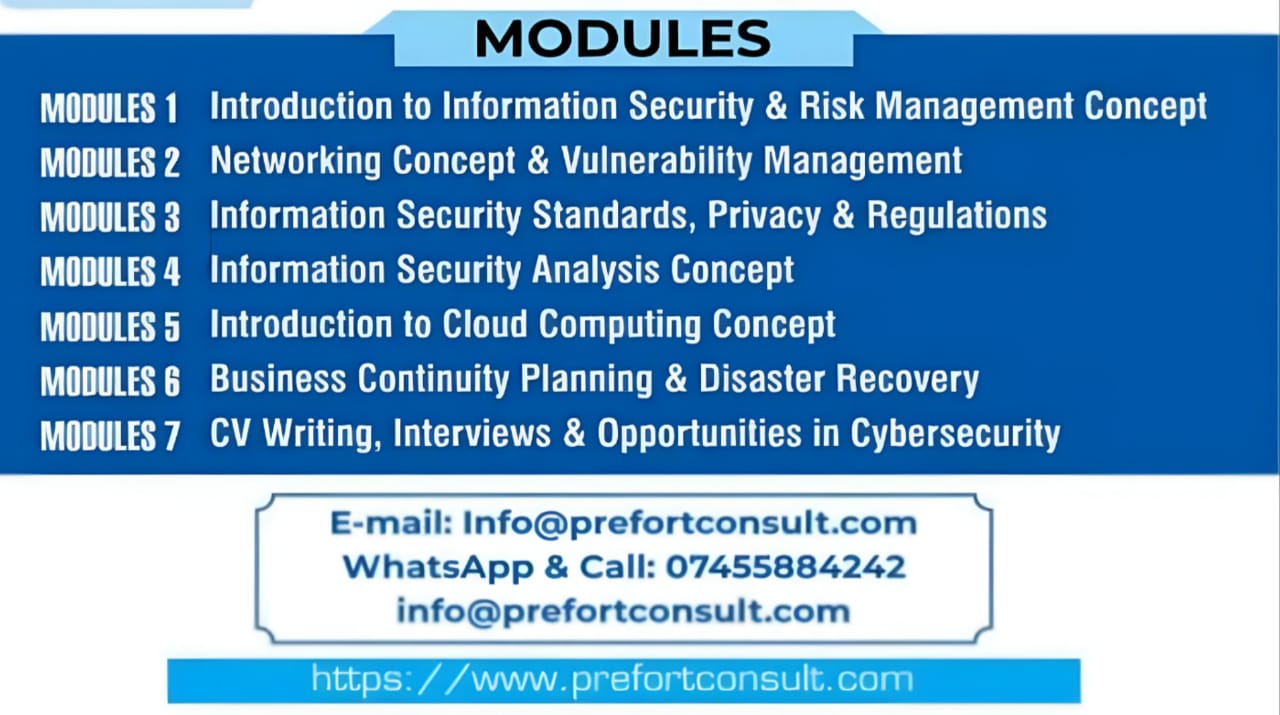
An information security manager takes responsibility for overseeing and controlling all aspects of computer security in a business. The job entails planning and carrying out security measures that will protect a business’s data and information from deliberate attack, unauthorized access, corruption and theft.” Randstad.co.uk Learning outcomes: How to ensure essential guidelines are in place for adhering to industry rules and regulations. How to conduct internal audits and reviews to ensure compliance (SOX, etc). How to carry-out gap analysis using ISO27001, ISO27002, ISO27005, NIST CSF etc. How to review companies’ policies, procedures, and guidelines. How to carry-out risk assessment and ensuring the right treatment is selected. How to identify vulnerabilities and patch the weaknesses How to compliance to regulatory requirements (UK Data Privacy, GDPR, HIPAA, etc). How to ensure employees are thoroughly updated about the organization’s policies, regulations, and processes. How to ensure employees are guided and made aware of information security risks the legal implication. Who is the course for? Managers Accountant Engineers Business Analysts Healthcare Professionals. Teachers and Academics. Students and professions with transferable skills. E-mail: info@prefortconsult.com Website: www.prefortconsult.com Mobile: +447455884242 Attending this will enable you to access some paid courses and training for free. HURRY NOW and book your place before the opportunity closes. Note: All sessions/classes will take place online via Zoom. You are also required to attend group discussions to improve your skills like presentation, communication, analysis, etc.