- Professional Development
- Medicine & Nursing
- Arts & Crafts
- Health & Wellbeing
- Personal Development
174 SV courses
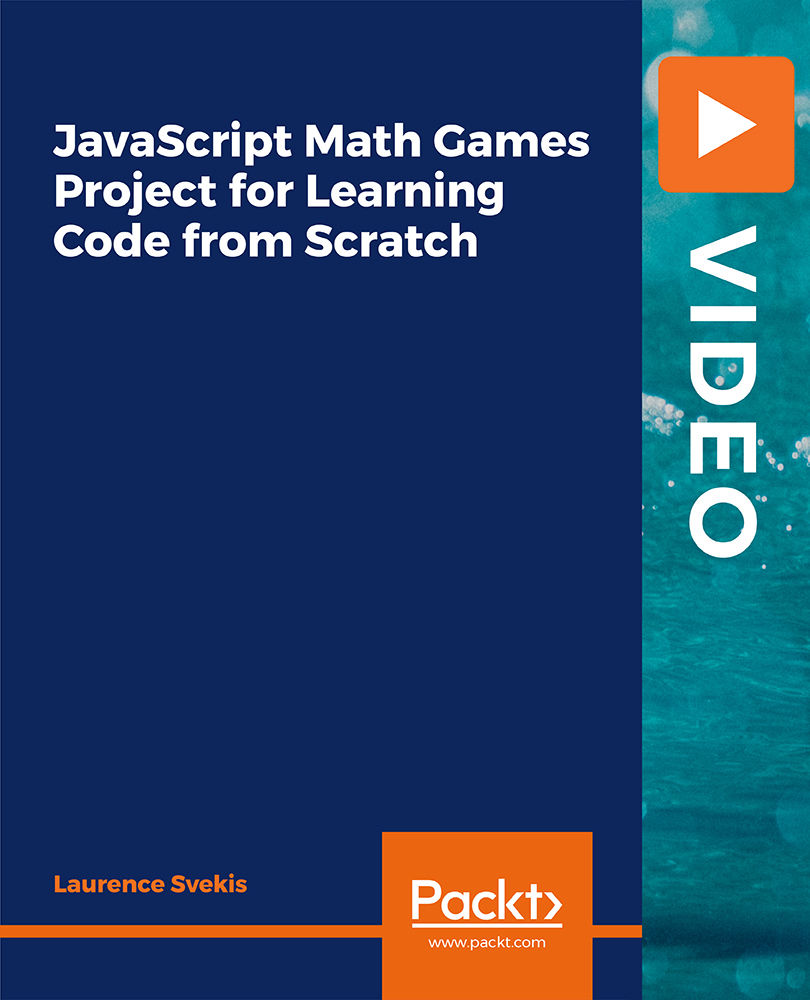
JavaScript Math Games Project for Learning Code from Scratch
By Packt
With the help of step-by-step explanation, this course shows you how to create a real-world, fully functional math quiz game from start to finish using JavaScript.
>> 12-Hour Knowledge Knockdown! Prices Reduced Like Never Before << In the era of big data, the demand for skilled data science professionals has skyrocketed in the UK. According to a recent report, the data science job market in the UK is expected to grow by over 25% by 2026. Aside from that, Candidates with data science skills have a 96% employment rate and can earn on average £40,000 per year. Our Complete Data Science bundle is about to take you on a tour starting from the beginning. This CCTV Operator Training Bundle Contains 4 of Our Premium Courses for One Discounted Price: Course 01: Complete Data Science Course 02: Data Science with Python Course 03: Information Management Course 04: GDPR Data Protection Take our Complete Data Science Bundle to learn how to maximise your potential and climb your chosen professional ladder. By participating in these popular courses, you can learn the fundamentals of Python. Discover Python data types. Loops, list comprehension, functions, lambda expressions, maps, and filters should all be taught. Learn about the numpy. Indexing, slicing, broadcasting, and boolean masking are all covered in our Complete Data Science course. Recognise arithmetic and universal functions. Discover everything there is to know about pandas. Learn how to use Python to become an expert in data analysis and visualisation. Learning Outcomes of Data Science Develop a comprehensive understanding of the data science lifecycle. Master data analysis techniques and Python programming for data manipulation. Gain proficiency in information management and data organization strategies. Understand data protection regulations, including GDPR, and their implications. Learn to build robust data-driven applications and predictive models. Enhance data visualization skills for effective communication of insights. Invest in your future by enrolling today and gain a competitive edge in the rapidly evolving field of data science. Why Choose Our Data Science bund;e? Get a Free CPD Accredited Certificate upon completion of Data Science Get a free student ID card with Data Science Training The Data Science is affordable and simple to understand Lifetime access to the Data Science course materials The Data Science comes with 24/7 tutor support Start your learning journey straightaway! *** Course Curriculum *** Course 01: Complete Data Science Welcome, Course Introduction & overview, and Environment set-up Python Essentials Python for Data Analysis using NumPy Python for Data Analysis using Pandas Python for Data Visualization using matplotlib Python for Data Visualization using Seaborn Python for Data Visualization using pandas Python for interactive & geographical plotting using Plotly and Cufflinks Capstone Project - Python for Data Analysis & Visualization Python for Machine Learning (ML) - scikit-learn - Linear Regression Model Python for Machine Learning - scikit-learn - Logistic Regression Model Python for Machine Learning - scikit-learn - K Nearest Neighbors Python for Machine Learning - scikit-learn - Decision Tree and Random Forests Python for Machine Learning - scikit-learn - Support Vector Machines (SVMs) Python for Machine Learning - scikit-learn - K Means Clustering Python for Machine Learning - scikit-learn - Principal Component Analysis (PCA) Recommender Systems - (Additional Topic) Natural Language Processing (NLP) - NLTK - (Additional Topic) Course 02: Data Science with Python Unit 01: Introduction To Python Data Science Unit 02: Data Cleaning Packages Unit 03: Data Visualization Packages Course 03: Information Management Module 01: Introduction To Information Management Module 02: Information Management Strategy Module 03: Databases And Information Management Module 04: Management Information Systems (MIS) Module 05: Auditing Information Systems Module 06: Ethical And Social Issues And Data Protection Course 04: GDPR Data Protection Module 01: Basics Of GDPR Module 02: Principles Of GDPR Module 03: Legal Foundation For Processing Module 04: Rights Of Individuals Module 05: Accountability And Governance Module 06: Data Protection Officer Module 07: Security Of Data Module 08: Personal Data Breaches Module 09: International Data Transfers After The Brexit Module 10: Exemptions - Part One and much more... How will I get my Certificate? After successfully completing the course, you will be able to order your Certificates as proof of your achievement. PDF Certificate: Free (Previously it was £12.99*4 = £51) CPD Hard Copy Certificate: £29.99 (Each) CPD 40 CPD hours / points Accredited by CPD Quality Standards Who is this course for? This Data Science bundle is suitable for everyone. This bundle is ideal for: Data scientist Data analyst-statistician CSE Students Interns App Developer Coders' Requirements You will not need any prior background or expertise to enrol in this Data Science bundle. Career path This Data Science Training bundle will allow you to kickstart or take your career in the related sector to the next stage. Data Analyst Data Scientist Business Analyst Marketing Analyst Data Engineer Certificates CPD Accredited Digital Certificate Digital certificate - Included Upon passing the Course, you need to order a Digital Certificate for each of the courses inside this bundle as proof of your new skills that are accredited by CPD QS for Free. CPD Accredited Hard Copy Certificate Hard copy certificate - £29 Please note that International students have to pay an additional £10 as a shipment fee.

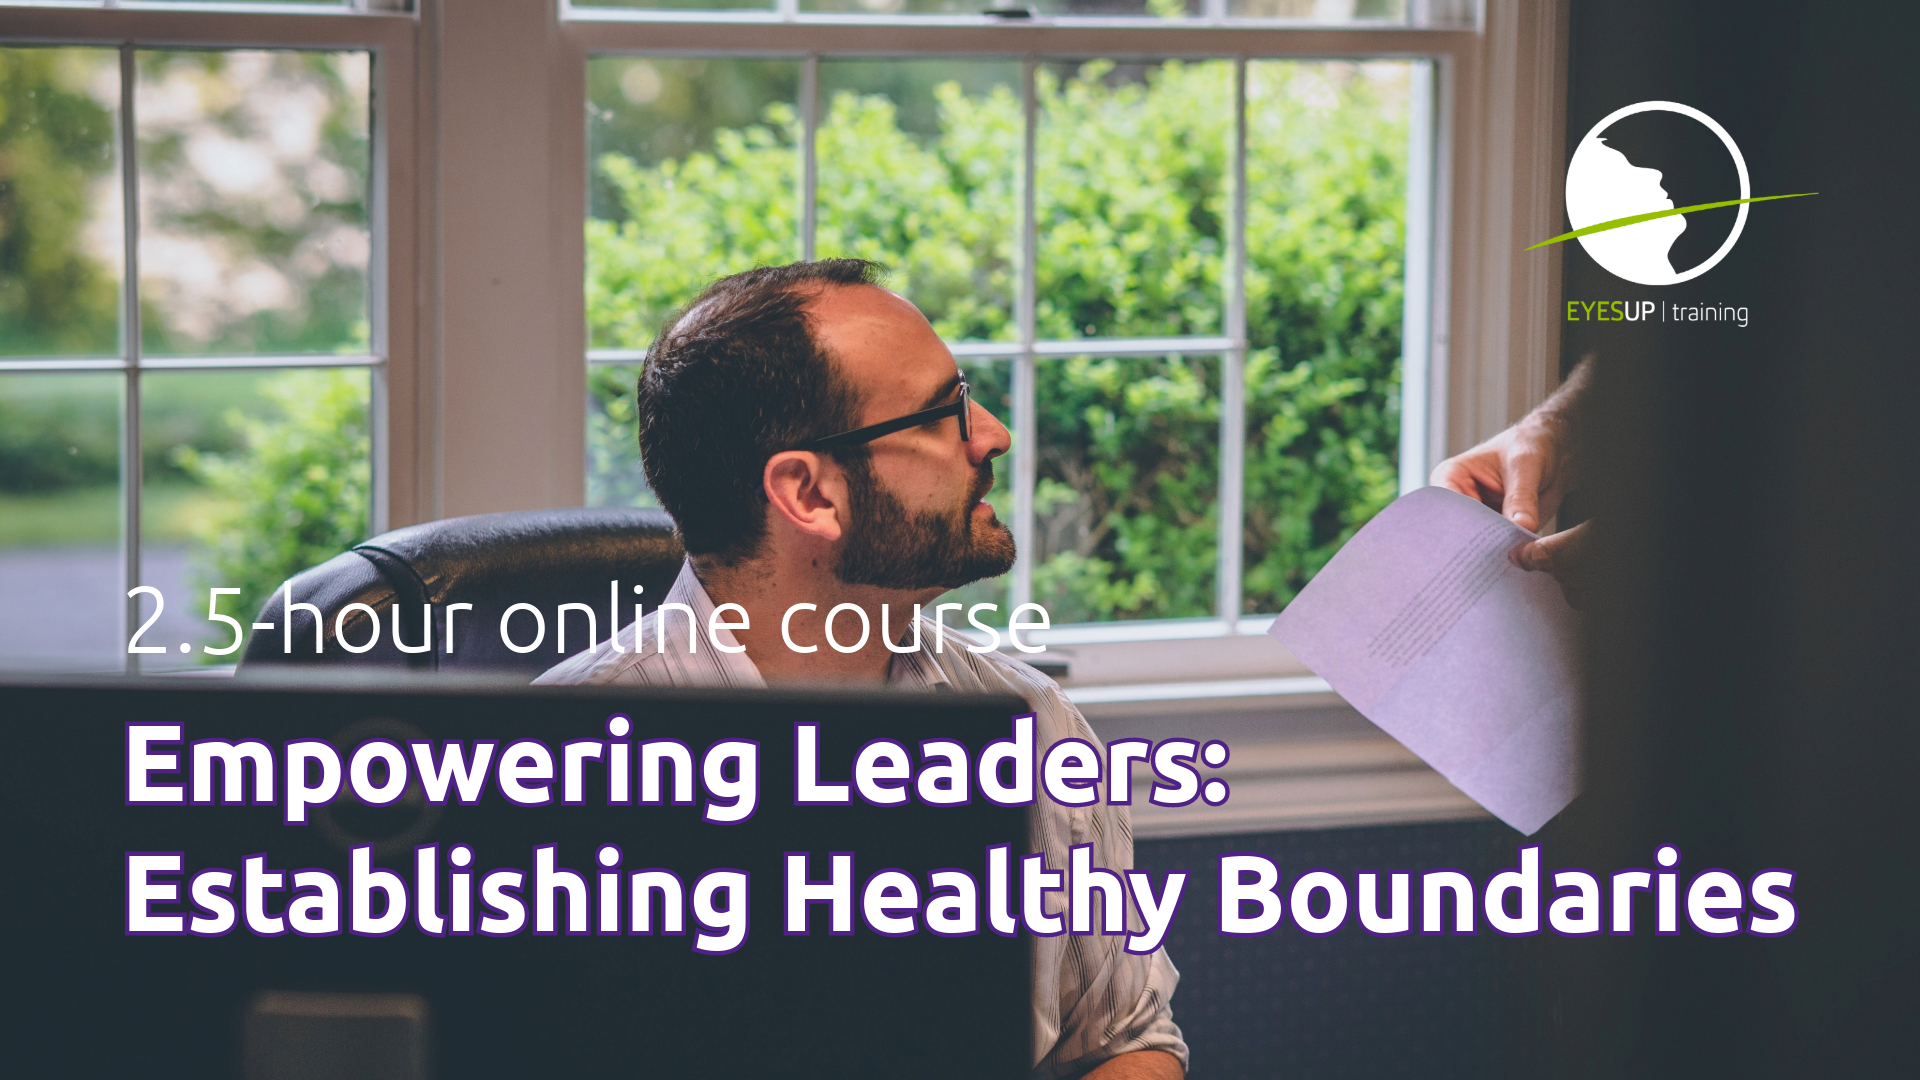
Setting Healthy Boundaries
By Eyes Up Training Limited
Learn to identify and communicate your boundaries with this practical framework for leaders and managers.
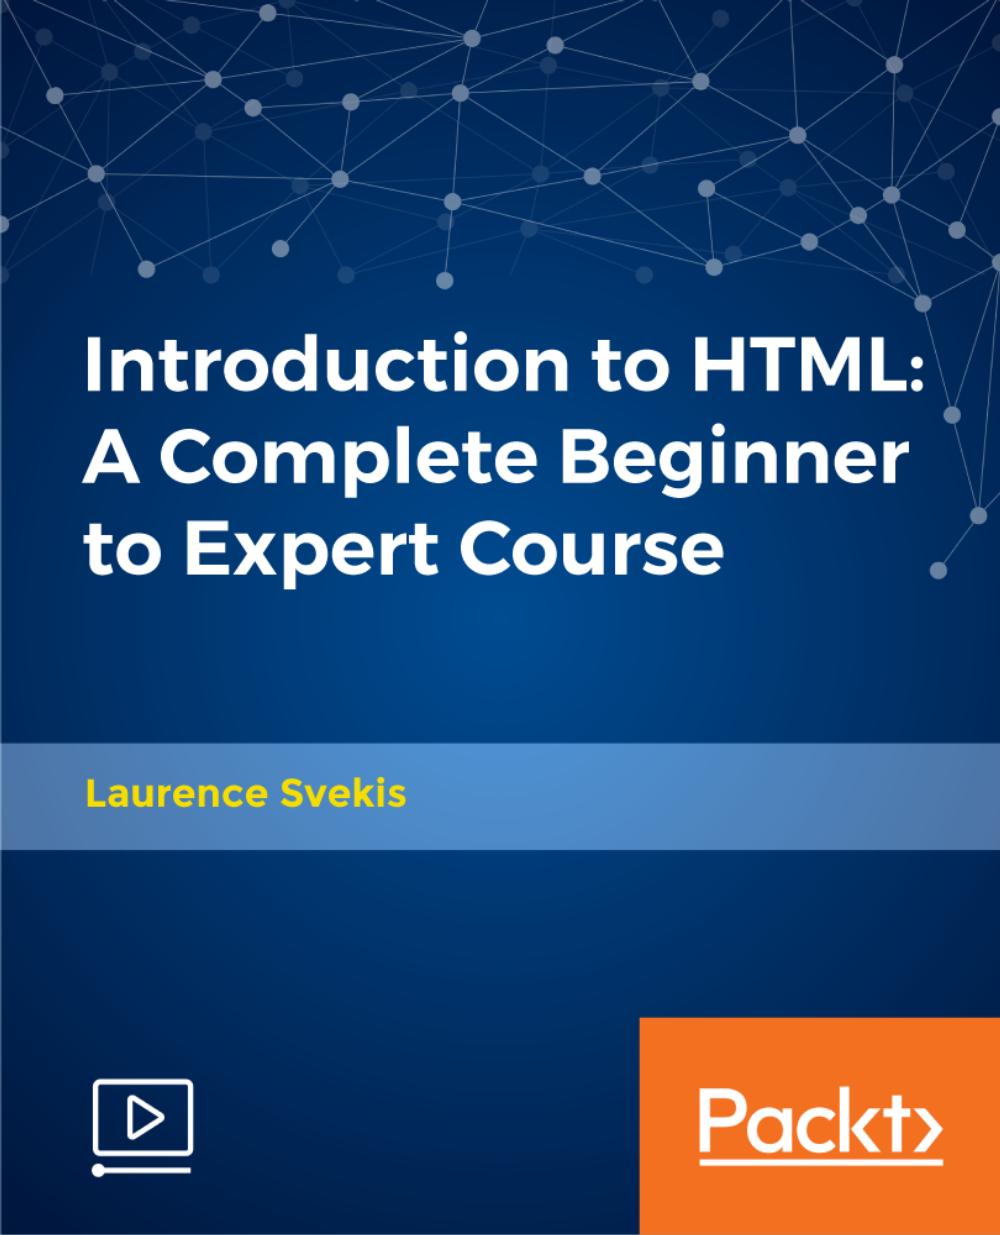
Introduction to HTML: A Complete Beginner to Expert Course
By Packt
Learn how to code in HTML from scratch. Perfect for beginners and anyone who wants to learn HTML
API for Beginners: JavaScript and Getting Started with APIs and AJAX
By Packt
Explore using JavaScript XHR and fetch to connect to multiple web API endpoints retrieve JSON data and update HTML
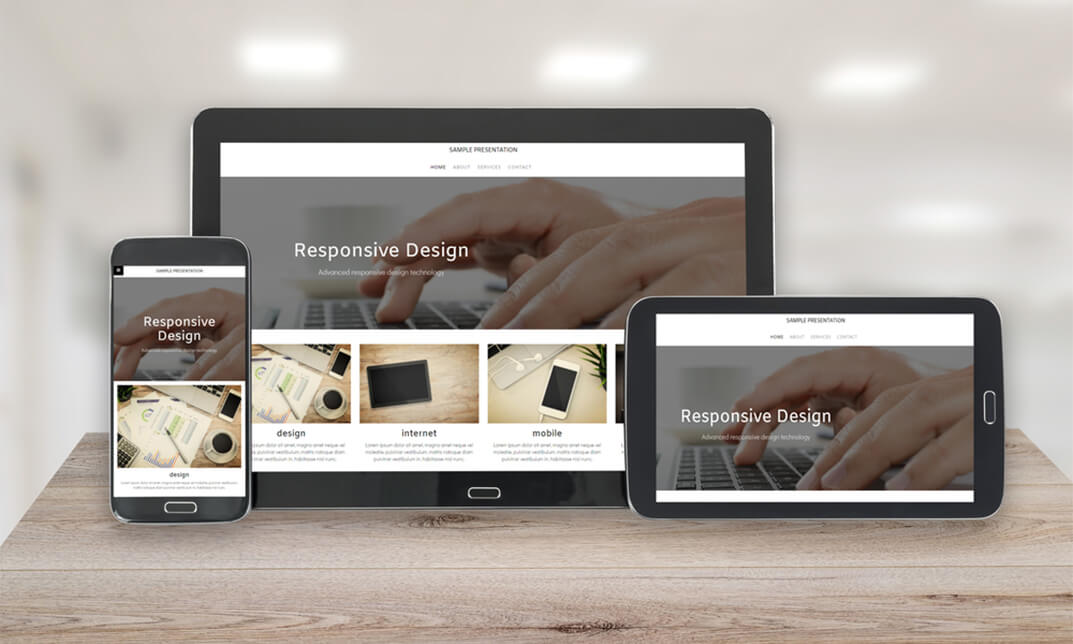
The modern web based on responsive websites that adapt to the web user and their requirements. Today websites reach far, extended from computers, TVs, and e-books to mobile devices. Surprisingly, the traditional way of building websites doesn't work anymore. Through this Modern Web Design course, you will learn to design responsive web design, including powerful strategies to keep up with the changing world. Why choose this course Earn an e-certificate upon successful completion. Accessible, informative modules taught by expert instructors Study in your own time, at your own pace, through your computer tablet or mobile device Benefit from instant feedback through mock exams and multiple-choice assessments Get 24/7 help or advice from our email and live chat teams Full Tutor Support on Weekdays Course Design The course is delivered through our online learning platform, accessible through any internet-connected device. There are no formal deadlines or teaching schedules, meaning you are free to study the course at your own pace. You are taught through a combination of Video lessons Online study materials Mock exams Multiple-choice assessment Certification After the successful completion of the final assessment, you will receive a CPD-accredited certificate of achievement. The PDF certificate is for £9.99, and it will be sent to you immediately after through e-mail. You can get the hard copy for £15.99, which will reach your doorsteps by post. Course Content Introduction 0.1 promo-workflow 00:03:00 0.2 what we will cover in this course 00:03:00 Requirements to take this course 1.1 skills-and-apps-you-need-to-take-this-courseautogenerated 00:02:00 1.2. Photoshop extensions We Need 00:07:00 Organizing your Web Design Project 2.1.how To Organize A Design Project 00:05:00 2.2 client's Sketches 00:04:00 2.2 naming psd layers and groups 00:06:00 2.3.naming Conventions To Help Developers 00:03:00 Gathering project information from client 3.1.design Briefs 00:10:00 3.3 getting More Info On Project 00:05:00 3.4.content_template for gathering information 00:03:00 Sketching, Wireframing, Atomic Design & 8point Grid system 4.1.moodboards 00:06:00 4.2.ideation Phase 00:05:00 4.3.introduction To Balsamiq 00:10:00 4.4desining Wireframes Part 1 00:08:00 4.5.desining Wireframes Part 2 00:14:00 4.6.atomic Design 00:08:00 4.7.8pt Grid 00:09:00 Style Guides, colors and typographics scales 5.1.typeface And Color Combinations 00:04:00 5.2.ui Style Guides 00:08:00 5.3.examples Of Ui Style Guides 00:03:00 5.4.how I Created My Style Guide 00:07:00 5.5.styleguide-typescale Explained 00:03:00 5.6.Styleguide-assignment 00:01:00 Designing for Desktop/Large View (Wstudio Web Design Project) 6.1.online tools for grid calcuations 00:13:00 6.2.planning your grid 00:05:00 6.3.whitespace-plan 00:06:00 6.4.setting Up Artboard For Desktop Design 00:07:00 6.5.designing Header And Hero Part 1 00:12:00 6.6 designing Header And Hero Part 2 00:09:00 6.7.designing Steps Area Part 1 00:10:00 6.8.designing Step Area Part 2 00:09:00 6.9.userreviews Area Design 00:09:00 6.10.adjusting White Space And Vertical Rhythem 00:06:00 6.11.desining Team Part1 00:11:00 6.12.desining Team Part2 00:07:00 6.13.footer Design Part1 00:08:00 6.14.footer Design Part2 00:11:00 Planning Responsive Web Design 7.1.Responsive Design Considerations Part 1 00:07:00 7.2.Responsive Design Considerations Part 2 00:06:00 Designing for Tablet/Medium View (Wstudio Web Design Project) 7.3.Establishing Grid For Tablets 00:07:00 7.4.Header Area For Tablet View 00:11:00 7.5.Section how it work - steps 00:10:00 7.6.Section team Tablet View 00:09:00 7.7 footer Design 00:09:00 Designing for Mobile/Small View (Wstudio Web Design Project) 8.1.mobile Artboard And Grids 00:04:00 8.2.header Mobile View 00:11:00 8.3.steps Section-mobile 00:09:00 8.4.section 2 Team Members For Mobile 00:09:00 8.5.footer And Final Adjustments 00:08:00 Designing for Developers 9.1.what Developes Needs To Know 00:05:00 9.2.Red Line Document with Ink 1 00:10:00 9.3.Red Line Document with Ink 2 00:06:00 9.4.which layer styles you can use photoshop 00:08:00 9.5.installing Using Zeplin 00:10:00 9.6.style Guides With Zeplin 00:14:00 9.7.tools-zeplin-avocode-1 00:04:00 9.8.avocode And Sympli 00:06:00 Prototyping with Invision app 10.1. What Are Prototypes 00:04:00 10.2.getting Familiar With Invision App For Prototyping 00:07:00 10.3.creating First Prototype With Invision App 00:06:00 SVGs and Icon Fonts in Web Design 11.1 using iconmoon app to create custom icon fonts set 00:08:00 11.2 Using SVG in Web design 00:10:00 Order your Certificates & Transcripts Order your Certificates & Transcripts 00:00:00 Frequently Asked Questions Are there any prerequisites for taking the course? There are no specific prerequisites for this course, nor are there any formal entry requirements. All you need is an internet connection, a good understanding of English and a passion for learning for this course. Can I access the course at any time, or is there a set schedule? You have the flexibility to access the course at any time that suits your schedule. Our courses are self-paced, allowing you to study at your own pace and convenience. How long will I have access to the course? For this course, you will have access to the course materials for 1 year only. This means you can review the content as often as you like within the year, even after you've completed the course. However, if you buy Lifetime Access for the course, you will be able to access the course for a lifetime. Is there a certificate of completion provided after completing the course? Yes, upon successfully completing the course, you will receive a certificate of completion. This certificate can be a valuable addition to your professional portfolio and can be shared on your various social networks. Can I switch courses or get a refund if I'm not satisfied with the course? We want you to have a positive learning experience. If you're not satisfied with the course, you can request a course transfer or refund within 14 days of the initial purchase. How do I track my progress in the course? Our platform provides tracking tools and progress indicators for each course. You can monitor your progress, completed lessons, and assessments through your learner dashboard for the course. What if I have technical issues or difficulties with the course? If you encounter technical issues or content-related difficulties with the course, our support team is available to assist you. You can reach out to them for prompt resolution.


Register on the Develop Vector Game Art With Inkscape today and build the experience, skills and knowledge you need to enhance your professional development and work towards your dream job. Study this course through online learning and take the first steps towards a long-term career. The course consists of a number of easy to digest, in-depth modules, designed to provide you with a detailed, expert level of knowledge. Learn through a mixture of instructional video lessons and online study materials. Receive online tutor support as you study the course, to ensure you are supported every step of the way. Get a digital certificate as a proof of your course completion. The Develop Vector Game Art With Inkscape is incredibly great value and allows you to study at your own pace. Access the course modules from any internet-enabled device, including computers, tablet, and smartphones. The course is designed to increase your employability and equip you with everything you need to be a success. Enrol on the now and start learning instantly! What You Get With The Develop Vector Game Art With Inkscape Receive a e-certificate upon successful completion of the course Get taught by experienced, professional instructors Study at a time and pace that suits your learning style Get instant feedback on assessments 24/7 help and advice via email or live chat Get full tutor support on weekdays (Monday to Friday) Course Design The course is delivered through our online learning platform, accessible through any internet-connected device. There are no formal deadlines or teaching schedules, meaning you are free to study the course at your own pace. You are taught through a combination of Video lessons Online study materials Certification After the successful completion of the final assessment, you will receive a CPD-accredited certificate of achievement. The PDF certificate is for £9.99, and it will be sent to you immediately after through e-mail. You can get the hard copy for £15.99, which will reach your doorsteps by post. Who Is This Course For: The course is ideal for those who already work in this sector or are an aspiring professional. This course is designed to enhance your expertise and boost your CV. Learn key skills and gain a professional qualification to prove your newly-acquired knowledge. Requirements: The online training is open to all students and has no formal entry requirements. To study the Develop Vector Game Art With Inkscape, all your need is a passion for learning, a good understanding of English, numeracy, and IT skills. You must also be over the age of 16. Course Content Welcome to Inkscape Introduction 00:02:00 The user interface 00:03:00 Drawing in Inkscape Drawing your first object 00:07:00 Working with multiple objects 00:07:00 Colors in Inkscape 00:06:00 Path operations - creating simple shapes 00:09:00 Gradients and groups 00:11:00 Modify path - the best way refine your objects 00:09:00 Use what you learned draw a bomb in Inkscape 00:09:00 Exporting Export bitmap image 00:07:00 How and why to save to SVG 00:03:00 GUI elements - Creating buttons First step - learn the text tool 00:06:00 Align and distribute 00:05:00 Button states 00:05:00 Buton variations 00:17:00 Creating Platforms Design a basic platform 00:08:00 Tiling platforms 00:09:00 Platform mutations 00:08:00 Design and animate game characters Draw and move a character or a top down shooter 00:09:00 Design a game hero! 00:11:00 Character poses 00:11:00 Practice animation The blob! 00:14:00 Set up and understand a more complex walk cycle 00:14:00 Finish the walk cycle 00:09:00 Backgrounds for your game Understanding backgrounds 00:05:00 Tiling backgrounds 00:14:00 Add foreground elements 00:20:00 Bacground variations 00:17:00 More tips and tricks Modularity - be more creative and efficient 00:11:00 Bonus lecture 00:01:00 Frequently Asked Questions Are there any prerequisites for taking the course? There are no specific prerequisites for this course, nor are there any formal entry requirements. All you need is an internet connection, a good understanding of English and a passion for learning for this course. Can I access the course at any time, or is there a set schedule? You have the flexibility to access the course at any time that suits your schedule. Our courses are self-paced, allowing you to study at your own pace and convenience. How long will I have access to the course? For this course, you will have access to the course materials for 1 year only. This means you can review the content as often as you like within the year, even after you've completed the course. However, if you buy Lifetime Access for the course, you will be able to access the course for a lifetime. Is there a certificate of completion provided after completing the course? Yes, upon successfully completing the course, you will receive a certificate of completion. This certificate can be a valuable addition to your professional portfolio and can be shared on your various social networks. Can I switch courses or get a refund if I'm not satisfied with the course? We want you to have a positive learning experience. If you're not satisfied with the course, you can request a course transfer or refund within 14 days of the initial purchase. How do I track my progress in the course? Our platform provides tracking tools and progress indicators for each course. You can monitor your progress, completed lessons, and assessments through your learner dashboard for the course. What if I have technical issues or difficulties with the course? If you encounter technical issues or content-related difficulties with the course, our support team is available to assist you. You can reach out to them for prompt resolution.