- Professional Development
- Medicine & Nursing
- Arts & Crafts
- Health & Wellbeing
- Personal Development
35 Publishing courses in Hurstpierpoint
Power BI - introduction to intermediate (2 days) (In-House)
By The In House Training Company
This course starts with the basics then moves seamlessly to an intermediate level. It includes a comprehensive yet balanced look at the four main components that make up Power BI Desktop: Report view, Data view, Model view, and the Power Query Editor. It also demonstrates how to use the online Power BI service. It looks at authoring tools that enables you to connect to and transform data from a variety of sources, allowing you to produce dynamic reports using a library of visualisations. Once you have those reports, the course looks at the seamless process of sharing those with your colleagues by publishing to the online Power BI service. The aim of this course is to provide a strong understanding of the Power BI analysis process, by working with real-world examples that will equip you with the necessary skills to start applying your knowledge straight away. 1 Getting started The Power BI process Launching Power BI Desktop The four views of Power BI Dashboard visuals 2 Connecting to files Connect to data sources Connect to an Excel file Connect to a CSV file Connect to a database Import vs. DirectQuery Connect to a web source Create a data table 3 Transforming data The process of cleaning data Column data types Remove rows with filters Add a custom column Append data to a table Fix error issues Basic maths operations 4 Build a data model Table relationships Manage table relationships 5 Merge queries Table join kinds Merging tables 6 Create report visualisations Creating map visuals Formatting maps Creating chart visuals Formatting chart Tables, matrixes, and cards Control formatting with themes Filter reports with slicers Reports for mobile devices Custom online visuals Export report data to Excel 7 The power query editor Fill data up and down Split columns by delimiter Add conditional columns Merging columns 8 The M formula Creating M functions Create an IF function Create a query group 9 Pivot and unpivot tables Pivot tables in the query editor Pivot and append tables Pivot but don't summarise Unpivot tables Append mismatched headers 10 Data modelling revisited Data model relationships Mark a calendar as a date table 11 Introduction to calculated columns New columns vs. measures Creating a new column calculation The SWITCH function 12 Introduction to DAX measures Common measure categories The SUM measure Adding measures to visuals COUNTROWS and DISINCTCOUNT functions DAX rules 13 The CALCULATE measure The syntax of CALCULATE Things of note about CALCULATE 14 The SUMX measure The SUMX measure X iterator functions Anatomy of SUMX 15 Introduction to time intelligence Importance of a calendar table A special lookup table The TOTALYTD measure Change year end in TOTALYTD 16 Hierarchy, groups and formatting Create a hierarchy to drill data Compare data in groups Add conditional formatting 17 Share reports on the web Publish to the BI online service Get quick insights Upload reports from BI service Exporting report data What is Q&A? Sharing your reports 18 Apply your learning Post training recap lesson

Power BI - introduction (2 day) (In-House)
By The In House Training Company
There is a lot to learn in Power BI, this course takes a comprehensive look at the fundamentals of analysing data and includes a balanced look at the four main components that make up Power BI Desktop: Report view, Data view, Model view, and the Power Query Editor. It also demonstrates how to utilise the online Power BI service. It looks at authoring tools that enable you to connect to and transform data from a variety of sources, allowing you to produce detailed reports through a range of visualisations, in an interactive and dynamic way. It also includes a detailed look at formulas by writing both M functions in Power Query, and DAX functions in Desktop view. This knowledge will allow you to take your reports to the next level. The aim of this course is to provide a complete introduction to understanding the Power BI analysis process, by working hands-on with examples that will equip you with the necessary skills to start applying your learning straight away. 1 Getting Started The Power BI ecosystem Opening Power BI Desktop Power BI's four views Introduction to Dashboards 2 Importing Files Importing data sources Importing an Excel file Importing a CSV file Importing a database Connect to an SQL Server Database Import vs. Direct Query Importing from the web Importing a folder of files Managing file connections 3 Shape Data in the Query Editor The process of shaping data Managing data types Keeping and removing rows Add a custom column Appending tables together Hiding queries in reports Fixing error issues Basic maths operations 4 The Data Model Table relationships Relationship properties 5 Merge Queries Table join kinds Merging tables 6 Inserting Dashboard Visuals Things to keep in mind Inserting maps Formatting Maps Inserting charts Formatting Charts Inserting a tree map Inserting a table, matrix, and card Controlling number formats About report themes Highlighting key points Filter reports with slicers Sync slicers across dashboards Custom web visuals 7 Publish and share Reports Publishing to Power BI service Editing online reports Pinning visuals to a dashboard What is Q&A? Sharing dashboards Exporting reports to PowerPoint Exporting reports as PDF files 8 The Power Query Editor Fill data up and down Split column by delimiter Add a conditional column More custom columns Merging columns 9 The M Functions Inserting text functions Insert an IF function Create a query group 10 Pivoting Tables Pivot a table Pivot and append tables Pivot but don't aggregate Unpivot tables Append mismatched headers 11 Data Modelling Expanded Understanding relationships Mark a date table 12 DAX New Columns New columns and measures New column calculations Insert a SWITCH function 13 Introduction to DAX Measures Common measure functions Insert a SUM function Insert a COUNTROWS function Insert a DISTINCTCOUNT function Insert a DIVIDE function DAX rules 14 The CALCULATE Measure The syntax of CALCULATE Insert a CALCULATE function Control field summarisation Things of note 15 The SUMX measure X iterator functions Anatomy of SUMX Insert a SUMX function When to use X functions 16 Time Intelligence Measures Importance of a calendar table Insert a TOTALYTD function Change financial year end date Comparing historical data Insert a DATEADD function 17 Hierarchies and Groups Mine data using hierarchies Compare data in groups
Project planning and risk management (In-House)
By The In House Training Company
Many organisations find that project teams struggle to create and maintain effective plans. Estimates are often overly optimistic and risks go unmanaged until the inevitable happens. Resource managers also find it hard to forecast the likely loading on their departments and requests for support are not provided in a consistent format. This programme has been developed to address these needs in a very practical, hands-on format. Case study work can be based on simulations or on the organisation's current projects for maximum benefit to participants. The aim of this training is to develop and enhance participants' planning and risk management skills in order to maximise the success of project work undertaken by the organisation. The principal training objectives for this programme are to: Provide a structured, integrated approach to planning and risk management Demonstrate practical tools and techniques for each stage of planning Show how to organise and involve relevant people in the planning process Explain how to use the plan for forecasting and pro-active project control Identify ways to improve planning, both individually and corporately The course will emphasise the importance of participative planning techniques that improve the quality of plans whilst reducing overall time and cost of planning. The course will encourage discussion of internal procedures and practices and may be customised to include them if required. DAY ONE 1 Introduction (Course sponsor) Why this programme has been developed Review of participants' needs and objectives 2 Projects and planning Why plan? The benefits of good planning / penalties of poor planning Planning in the project lifecycle; the need for a 'living' plan The interaction between target setting and the planning process Team exercise: planning the project 3 Planning the plan Defining the application and structure of the plan Impact of planning decisions during the project lifecycle Using available time to create an effective plan 4 Defining deliverables Assessing the context; reviewing the goals and stakeholders Developing the scope and defining deliverables; scope mapping Understanding customer priorities; delivering value for money Case study: defining the project deliverables 5 Creating the work breakdown Building the work breakdown structure Detailing the tasks and sub-tasks; structured brainstorming Defining task ownership; the task responsibility matrix 6 Creating and using a logical network Developing the logical network; task boarding Determining the critical path and calculating float Accelerating the plan; concurrent programming and risk Individual and group exercises DAY TWO 7 Developing resource schedules Deriving the Gantt chart from the network Developing the detailed resource schedules Calculating the expenditure profile ('S' curve) 8 Estimating task durations and costs Understanding estimates: effort, availability and duration Estimating tools and techniques Application of estimating techniques during the project lifecycle 9 Case study Developing the project plan Refining the project plan Team presentations and discussion 10 Managing risks and refining the plan Awareness of contractual issues associated with risk Identifying and evaluating risks; deciding ownership Managing risks: determining levels of provision and contingency Controlling risks: maintaining an up-to date risk register 11 Planning for pro-active control The earned value analysis (EVA) concept and its predictive value Deriving the measures needed for cost and delivery performance Practical issues associated with implementing EVA 12 Using and maintaining the plan Tracking progress and updating the plan Publishing and controlling the plan 13 Course review and transfer planning (Course sponsor present) Identify ways of implementing the techniques learnt Sponsor-led review and discussion of proposals Conclusion
Visio Flowcharts and Diagrams
By Underscore Group
Ensure you can fully utilize this powerful tool to create a range of flowcharts and diagrams. Course overview Duration: 1 day (6.5 hours) Microsoft Visio is a powerful tool designed to simplify complex information through the creation of simple, professional-looking diagrams. While Visio is capable of producing almost any type of drawing this training concentrates on flowcharts, swim lane process diagrams and organisation charts. You will also discover the real power of Visio by adding essential data to the content of your diagrams and producing reports in Excel using this data. This course is designed for either new users of Visio or those who have dabbled and can create basic diagrams. Our course will give you the skills and knowledge you need to navigate your way around this powerful program and produce different types of diagram. Objectives By the end of the course you will be able to: Create and amend flowcharts Create cross functional (Swim Lane) process flows Produce organisation charts by importing data Add essential data to shapes Export diagram data reports to Excel Present, publish and print Visio diagrams Content Visio essentials Finding your way around Visio Using the ribbon and Quick Access toolbar Keyboard shortcuts Shapes and stencils explained What Visio can do for you Creating basic flowcharts Working with shapes Adding and deleting shapes Joining, aligning and sizing shapes Using Auto-Connect Labelling shapes and connectors Editing and improvinC flowcharts Amending shape and connector labels Using colours to emphasise Changing line styles Moving and copying objects Grouping diagram elements Quick ways of working Cross functional flowcharts Creating Cross-Functional Flowcharts Manipulating functional bands Creating off-page references within diagrams and hyperlinks to other documentation Organising charts and shape data Using the wizard to create an organisation Chart Importing existing Data into to create an organisation chart Modifying an organisation chart Shape Data Adding shape data to a shape Creating shape data sets Diagram reports Exporting data to a report in Excel Exporting to HTML Creating and customizing reports Presenting, publishing and printing Using Page Setup Print previewing Embedding backgrounds Adding headers and footers Converting your final documentation to PDF Saving as HTML Visio with PowerPoint
Tableau Desktop Training - Analyst
By Tableau Training Uk
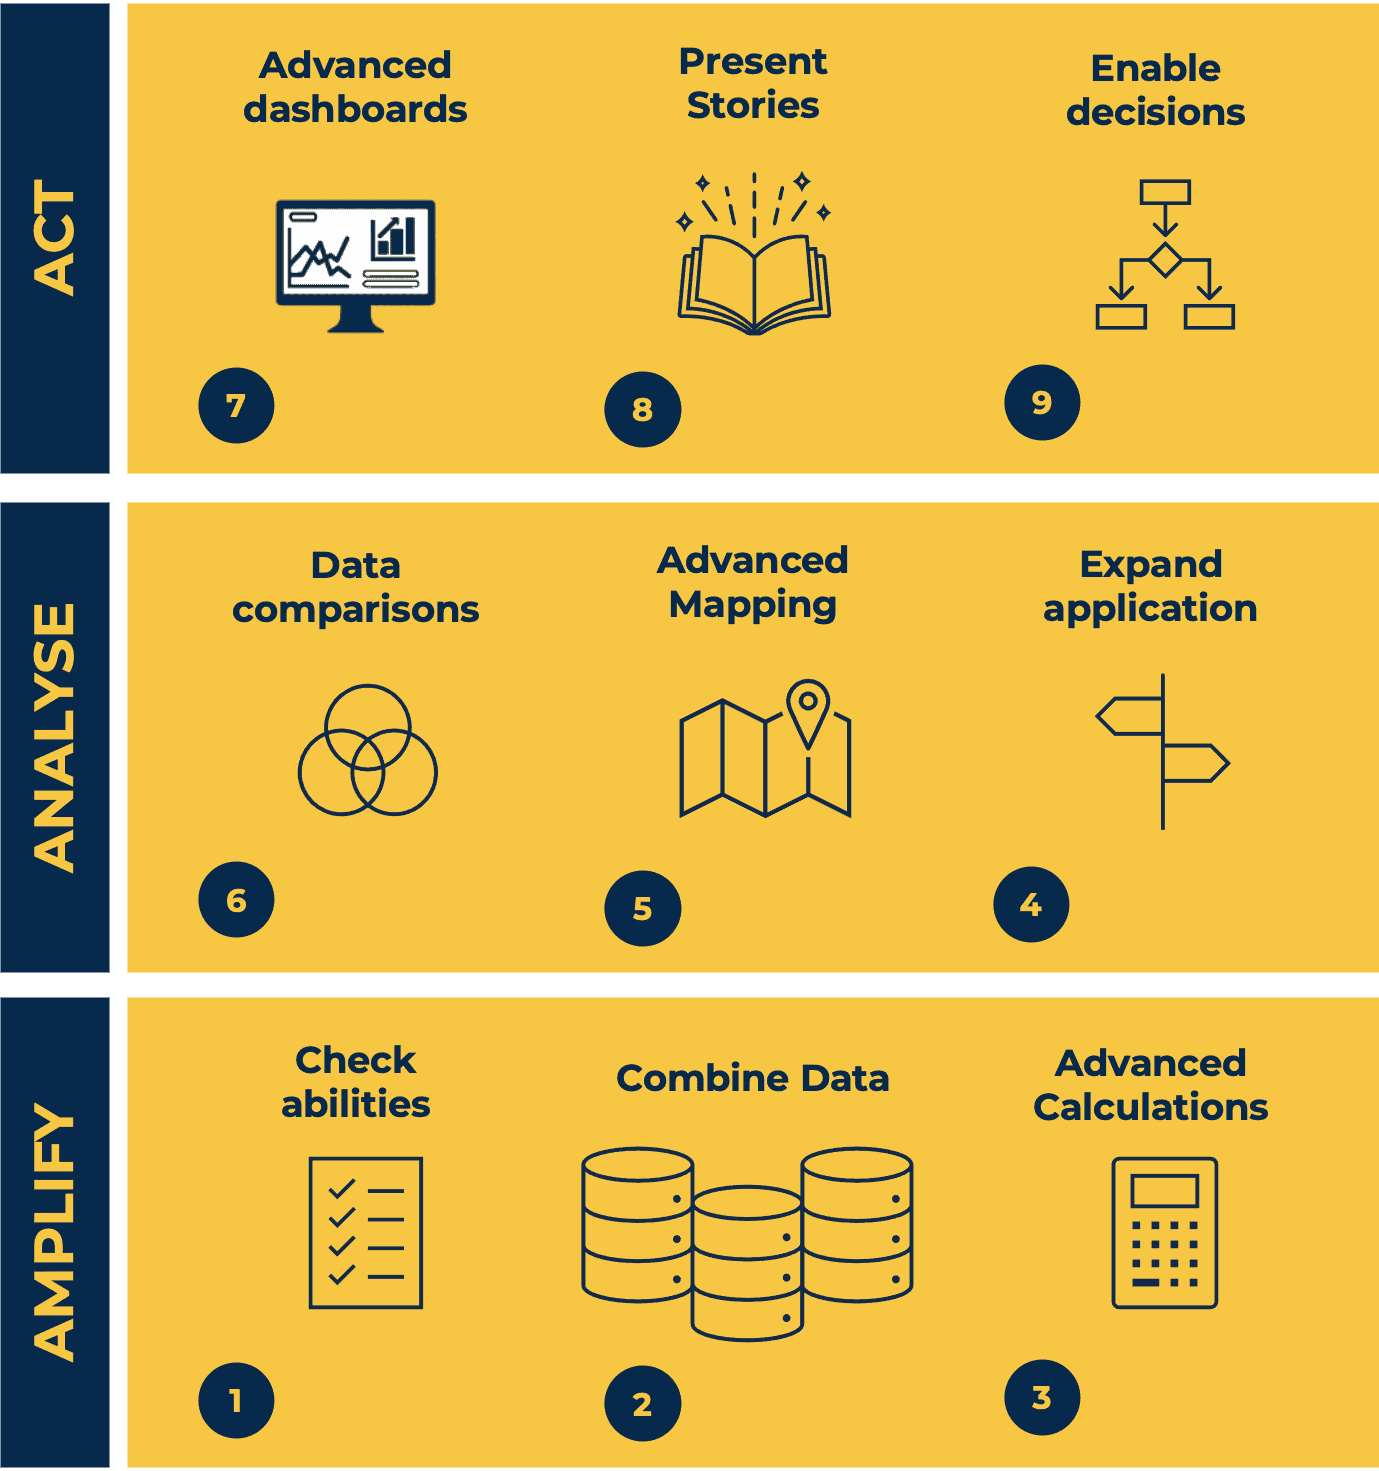
This Tableau Desktop Training intermediate course is designed for the professional who has a solid foundation with Tableau and is looking to take it to the next level. For Private options, online or in-person, please send us details of your requirements: This Tableau Desktop training intermediate course is designed for the professional who has a solid foundation with Tableau and is looking to take it to the next level. Attendees should have a good understanding of the fundamental concepts of building Tableau worksheets and dashboards typically achieved from having attended our Tableau Desktop Foundation Course. At the end of this course you will be able to communicate insights more effectively, enabling your organisation to make better decisions, quickly. The Tableau Desktop Analyst training course is aimed at people who are used to working with MS Excel or other Business Intelligence tools and who have preferably been using Tableau already for basic reporting. The course is split into 3 phases and 9 modules: Phase 1: AMPLIFY MODULE 1: CHECK ABILITIES Revision – What I Should Know What is possibleHow does Tableau deal with dataKnow your way aroundHow do we format chartsHow Tableau deals with datesCharts that compare multiple measuresCreating Tables MODULE 2: COMBINE DATA Relationships Joining Tables – Join Types, Joining tables within the same database, cross database joins, join calculations Blending – How to create a blend with common fields, Custom defined Field relationships and mismatched element names, Calculated fields in blended data sources Unions – Manual Unions and mismatched columns, Wildcard unions Data Extracts – Creating & Editing Data extracts MODULE 3: ADVANCED CALCULATIONS Row Level v Aggregations Aggregating dimensions in calculations Changing the Level of Detail (LOD) of calculations – What, Why, How Adding Table Calculations Phase 2: ANALYSE MODULE 4: EXPAND APPLICATION Making things dynamic with parameters Sets Trend Lines How do we format charts Forecasting MODULE 5: ADVANCED MAPPING Using your own images for spatial analysis Mapping with Spatial files MODULE 6: DATA COMPARISONS Advanced Charts Bar in Bar charts Bullet graphs Creating Bins and Histograms Creating a Box & Whisker plot Phase 3: ACT MODULE 7: ADVANCED DASHBOARDS Using the dashboard interface and Device layout Dashboard Actions and Viz In tooltips Horizontal & Vertical containers Navigate between dashboards MODULE 8: PRESENT STORIES Telling data driven stories MODULE 9: ENABLE DECISIONS What is Tableau Server Publishing & Permissions How can your users engage with content This training course includes over 25 hands-on exercises and quizzes to help participants “learn by doing” and to assist group discussions around real-life use cases. Each attendee receives a login to our extensive training portal which covers the theory, practical applications and use cases, exercises, solutions and quizzes in both written and video format. Students must bring their own laptop with an active version of Tableau Desktop 2018.2 (or later) pre-installed. What People Are Saying About This Course “Course was fantastic, and completely relevant to the work I am doing with Tableau. I particularly liked Steve’s method of teaching and how he applied the course material to ‘real-life’ use-cases.”Richard W., Dashboard Consulting Ltd “This course was extremely useful and excellent value. It helped me formalise my learning and I have taken a lot of useful tips away which will help me in everyday work.” Lauren M., Baillie Gifford “I would definitely recommend taking this course if you have a working knowledge of Tableau. Even the little tips Steve explains will make using Tableau a lot easier. Looking forward to putting what I’ve learned into practice.”Aron F., Grove & Dean “Steve is an excellent teacher and has a vast knowledge of Tableau. I learned a huge amount over the two days that I can immediately apply at work.”John B., Mporium “Steve not only provided a comprehensive explanation of the content of the course, but also allowed time for discussing particular business issues that participants may be facing. That was really useful as part of my learning process.”Juan C., Financial Conduct Authority “Course was fantastic, and completely relevant to the work I am doing with Tableau. I particularly liked Steve’s method of teaching and how he applied the course material to ‘real-life’ use-cases.”Richard W., Dashboard Consulting Ltd “This course was extremely useful and excellent value. It helped me formalise my learning and I have taken a lot of useful tips away which will help me in everyday work.” Lauren M., Baillie Gifford “I would definitely recommend taking this course if you have a working knowledge of Tableau. Even the little tips Steve explains will make using Tableau a lot easier. Looking forward to putting what I’ve learned into practice.”Aron F., Grove & Dean “Steve is an excellent teacher and has a vast knowledge of Tableau. I learned a huge amount over the two days that I can immediately apply at work.”John B., Mporium