- Professional Development
- Medicine & Nursing
- Arts & Crafts
- Health & Wellbeing
- Personal Development
1626 Management courses in Banstead
Microsoft Excel Training
By FourSquare Innovations Ltd
FourSquare Training specialise in private, corporate Microsoft Excel courses delivered at your premises and tailored to your needs.
Enscape Rendering Training Course
By ATL Autocad Training London
Who is this course for? Enscape Rendering Training Course. The Enscape Rendering Training Course is tailored for architects, interior designers, and design students aiming to learn realistic visualizations using Enscape. Whether you prefer 1-on-1 in-person or online courses, this training is best for you. Click here for more info: Website Training duration: 5 hrs Method: 1-on-1 and Tailored content Schedule: Customize your training. Choose any hour from Mon to Sat, 9 am to 7 pm Call 02077202581 or WhatsApp at 07970325184 to book. Course Outline: Enscape Rendering Software Training (5 hours) Course 1: Enscape for Revit Hour 1: 1. Introduction to Enscape: Overview of Enscape rendering software, its features, and benefits. 2. Installing and Setting up Enscape: Step-by-step guidance on installing and configuring Enscape for Revit. 3. Enscape Interface: Familiarizing with the Enscape user interface and navigation controls within Revit. Hour 2: 4. Enscape Materials: Exploring material creation, application, and customization within Enscape for Revit. 5. Lighting in Enscape: Understanding different lighting options, adjusting light settings, and creating realistic lighting effects. Hour 3: 6. Enscape Camera Settings: Manipulating camera angles, perspectives, and settings for optimal visualization. 7. Enscape Rendering Settings: Exploring various rendering settings and techniques to enhance the quality of the final output. Hour 4: 8. Enscape Rendering Workflow: Demonstrating a step-by-step workflow for generating renderings and walkthroughs using Enscape in Revit. 9. Advanced Features: Introduction to advanced features such as creating panoramas, virtual reality (VR) walkthroughs, and creating animations in Enscape. Hour 5: 10. Tips and Tricks: Sharing tips and techniques for maximizing efficiency and achieving high-quality results in Enscape for Revit. 11. Q&A and Troubleshooting: Addressing participant questions, providing troubleshooting guidance, and discussing common challenges and solutions. OR Course Outline: Enscape Rendering Software Training (5 hours) Course 1: Enscape for Sketchup Hour 1: 1. Introduction to Enscape: Overview of Enscape rendering software, its features, and benefits for SketchUp users. 2. Installing and Setting up Enscape: Step-by-step guidance on installing and configuring Enscape for SketchUp. 3. Enscape Interface: Familiarizing with the Enscape user interface and navigation controls within SketchUp. Hour 2: 4. Enscape Materials: Exploring material creation, application, and customization within Enscape for SketchUp. 5. Lighting in Enscape: Understanding different lighting options, adjusting light settings, and creating realistic lighting effects. Hour 3: 6. Enscape Camera Settings: Manipulating camera angles, perspectives, and settings for optimal visualization in SketchUp. 7. Enscape Rendering Settings: Exploring various rendering settings and techniques to enhance the quality of the final output. Hour 4: 8. Enscape Rendering Workflow: Demonstrating a step-by-step workflow for generating renderings and walkthroughs using Enscape in SketchUp. 9. Advanced Features: Introduction to advanced features such as creating panoramas, virtual reality (VR) walkthroughs, and creating animations in Enscape. Hour 5: 10. Tips and Tricks: Sharing tips and techniques for maximizing efficiency and achieving high-quality results in Enscape for SketchUp. 11. Q&A and Troubleshooting: Addressing participant questions, providing troubleshooting guidance, and discussing common challenges and solutions. Learning Outcome: After completing the Enscape (VR) Training and Interactive Workshop, participants will master real-time walkthroughs, set up VR applications, efficiently migrate models, navigate designs dynamically, update objects in real-time, control visual styles, adjust day-time settings, export and share designs, utilize the asset library, and gain a comprehensive overview of Enscape. These skills will enable them to confidently visualize and display 3D designs without cloud uploads or external software, enhancing communication and collaboration in architectural projects. What does the Enscape Training & Interactive Workshop offer? The Enscape Training & Interactive Workshop is designed to help you get up and running with Virtual Reality (VR) in a cost-effective manner. It covers hardware and software setup, navigation techniques, real-time updates, material settings, and more. The workshop also allows participants to experience VR firsthand. What are the benefits of attending the Enscape (VR) Training and Interactive Workshop? By attending this workshop, you will gain the ability to perform real-time walkthroughs of your designs in 3D. You can view your projects in VR without the need for cloud uploads or exporting to other 3D software. The workshop offers extensive asset libraries, collaboration, and annotation sharing, enhancing your design visualization capabilities. What are the prerequisites for attending the Enscape (VR) Training and Interactive Workshop? No prior knowledge of Enscape is required. However, assistance from IT management may be necessary for hardware and software installation. Logistics, such as room suitability and technical requirements, will be discussed before the workshop. What will I learn in the Enscape (VR) Training and Interactive Workshop? The workshop covers hardware setup, software installation, and configuration. You will learn how to migrate models from Revit and SketchUp into VR, navigate through designs, update objects and materials in real-time, and utilize various visual styles and settings. The course also includes interactive workshops with support from our expert tutors. Enscape rendering courses offer valuable benefits: Real-time Visualization: Instantly visualize designs for quick iterations and informed decisions. Seamless Integration: Streamline rendering by integrating with popular design software. High-Quality Visuals: Create photorealistic presentations and walkthroughs. Efficient Design Communication: Enhance collaboration and communication during presentations. Enhanced Design Iteration: Explore options and make informed decisions in real-time. Time and Cost Savings: Reduce rendering time and deliver projects more efficiently. Portfolio Enhancement: Elevate your portfolio with visually striking renderings, opening new opportunities.

This English Exam Preparation course is specifically designed for adult learners who are preparing to take an English language proficiency exam, such as IELTS, TOEFL, or Cambridge exams. Participants will focus on developing the necessary skills and strategies to achieve a successful outcome in their chosen exam. Through targeted practice, exam-specific tasks, and personalised feedback, learners will gain confidence and proficiency in all sections of the exam. Course Duration: 12 weeks (48 sessions) Course Objectives: By the end of this course, participants will: 1. Understand the format and requirements of the chosen English language proficiency exam. 2. Develop effective strategies for each section of the exam. 3. Enhance reading, writing, listening, and speaking skills within the context of the exam. 4. Expand vocabulary and improve language accuracy for exam-specific tasks. 5. Practice time management techniques to complete tasks within the allocated time. Course Outline: Week 1: Introduction to the Exam - Introduction to the chosen English language proficiency exam - Overview of the exam format, sections, and scoring criteria - Assessment of participants' current language proficiency and individual learning goals Week 2: Reading Skills and Strategies - Understanding different question types in the reading section - Developing reading skills for comprehension, skimming, and scanning - Practice exercises and strategies to improve speed and accuracy Week 3: Writing Skills and Strategies - Analyzing the writing tasks and requirements of the exam - Developing skills for organising ideas, structuring paragraphs, and coherence - Practice exercises for different writing tasks (essays, reports, letters, etc.) Week 4: Listening Skills and Strategies - Identifying question types and understanding the listening section format - Developing listening skills for main ideas, details, and inference - Practice exercises and strategies for improving listening accuracy and note-taking Week 5: Speaking Skills and Strategies - Understanding the speaking section requirements and assessment criteria - Developing skills for fluency, coherence, and pronunciation - Practice exercises for different speaking tasks (interviews, presentations, etc.) Week 6: Vocabulary Expansion for Exam Tasks - Expanding vocabulary in specific topics and themes relevant to the exam - Practice exercises to reinforce and use new vocabulary effectively - Techniques for deducing meaning from context and using appropriate vocabulary Week 7: Grammar and Language Accuracy - Reviewing and reinforcing essential grammar rules and structures - Identification and correction of common grammar errors in exam tasks - Exercises and activities to improve language accuracy in writing and speaking Week 8: Time Management and Exam Strategies - Strategies for time management and prioritizing tasks during the exam - Practice exercises to improve speed and efficiency in completing tasks - Tips and techniques for maximizing scores in each section Week 9: Mock Exam: Reading and Writing - Simulating a complete reading and writing section of the exam - Timed practice sessions to replicate exam conditions - Detailed feedback and analysis of strengths and areas for improvement Week 10: Mock Exam: Listening and Speaking - Simulating a complete listening and speaking section of the exam - Timed practice sessions to replicate exam conditions - Detailed feedback and analysis of strengths and areas for improvement Week 11: Exam Strategies Review and Practice - Reviewing and reinforcing exam strategies for each section - Targeted practice exercises to address specific challenges and areas of improvement - Individualised feedback and guidance based on participants' performance Week 12: Final Evaluation and Exam Tips - Comprehensive review of all exam sections and strategies - Final evaluation to assess participants' progress and readiness for the exam - Tips for managing test anxiety and mental preparation for the exam Note: This syllabus is a guideline and can be customised based on the specific exam requirements and the needs, interests, and proficiency levels of the participants. The course may also include additional topics or activities to cater to learners' specific goals or areas of focus.


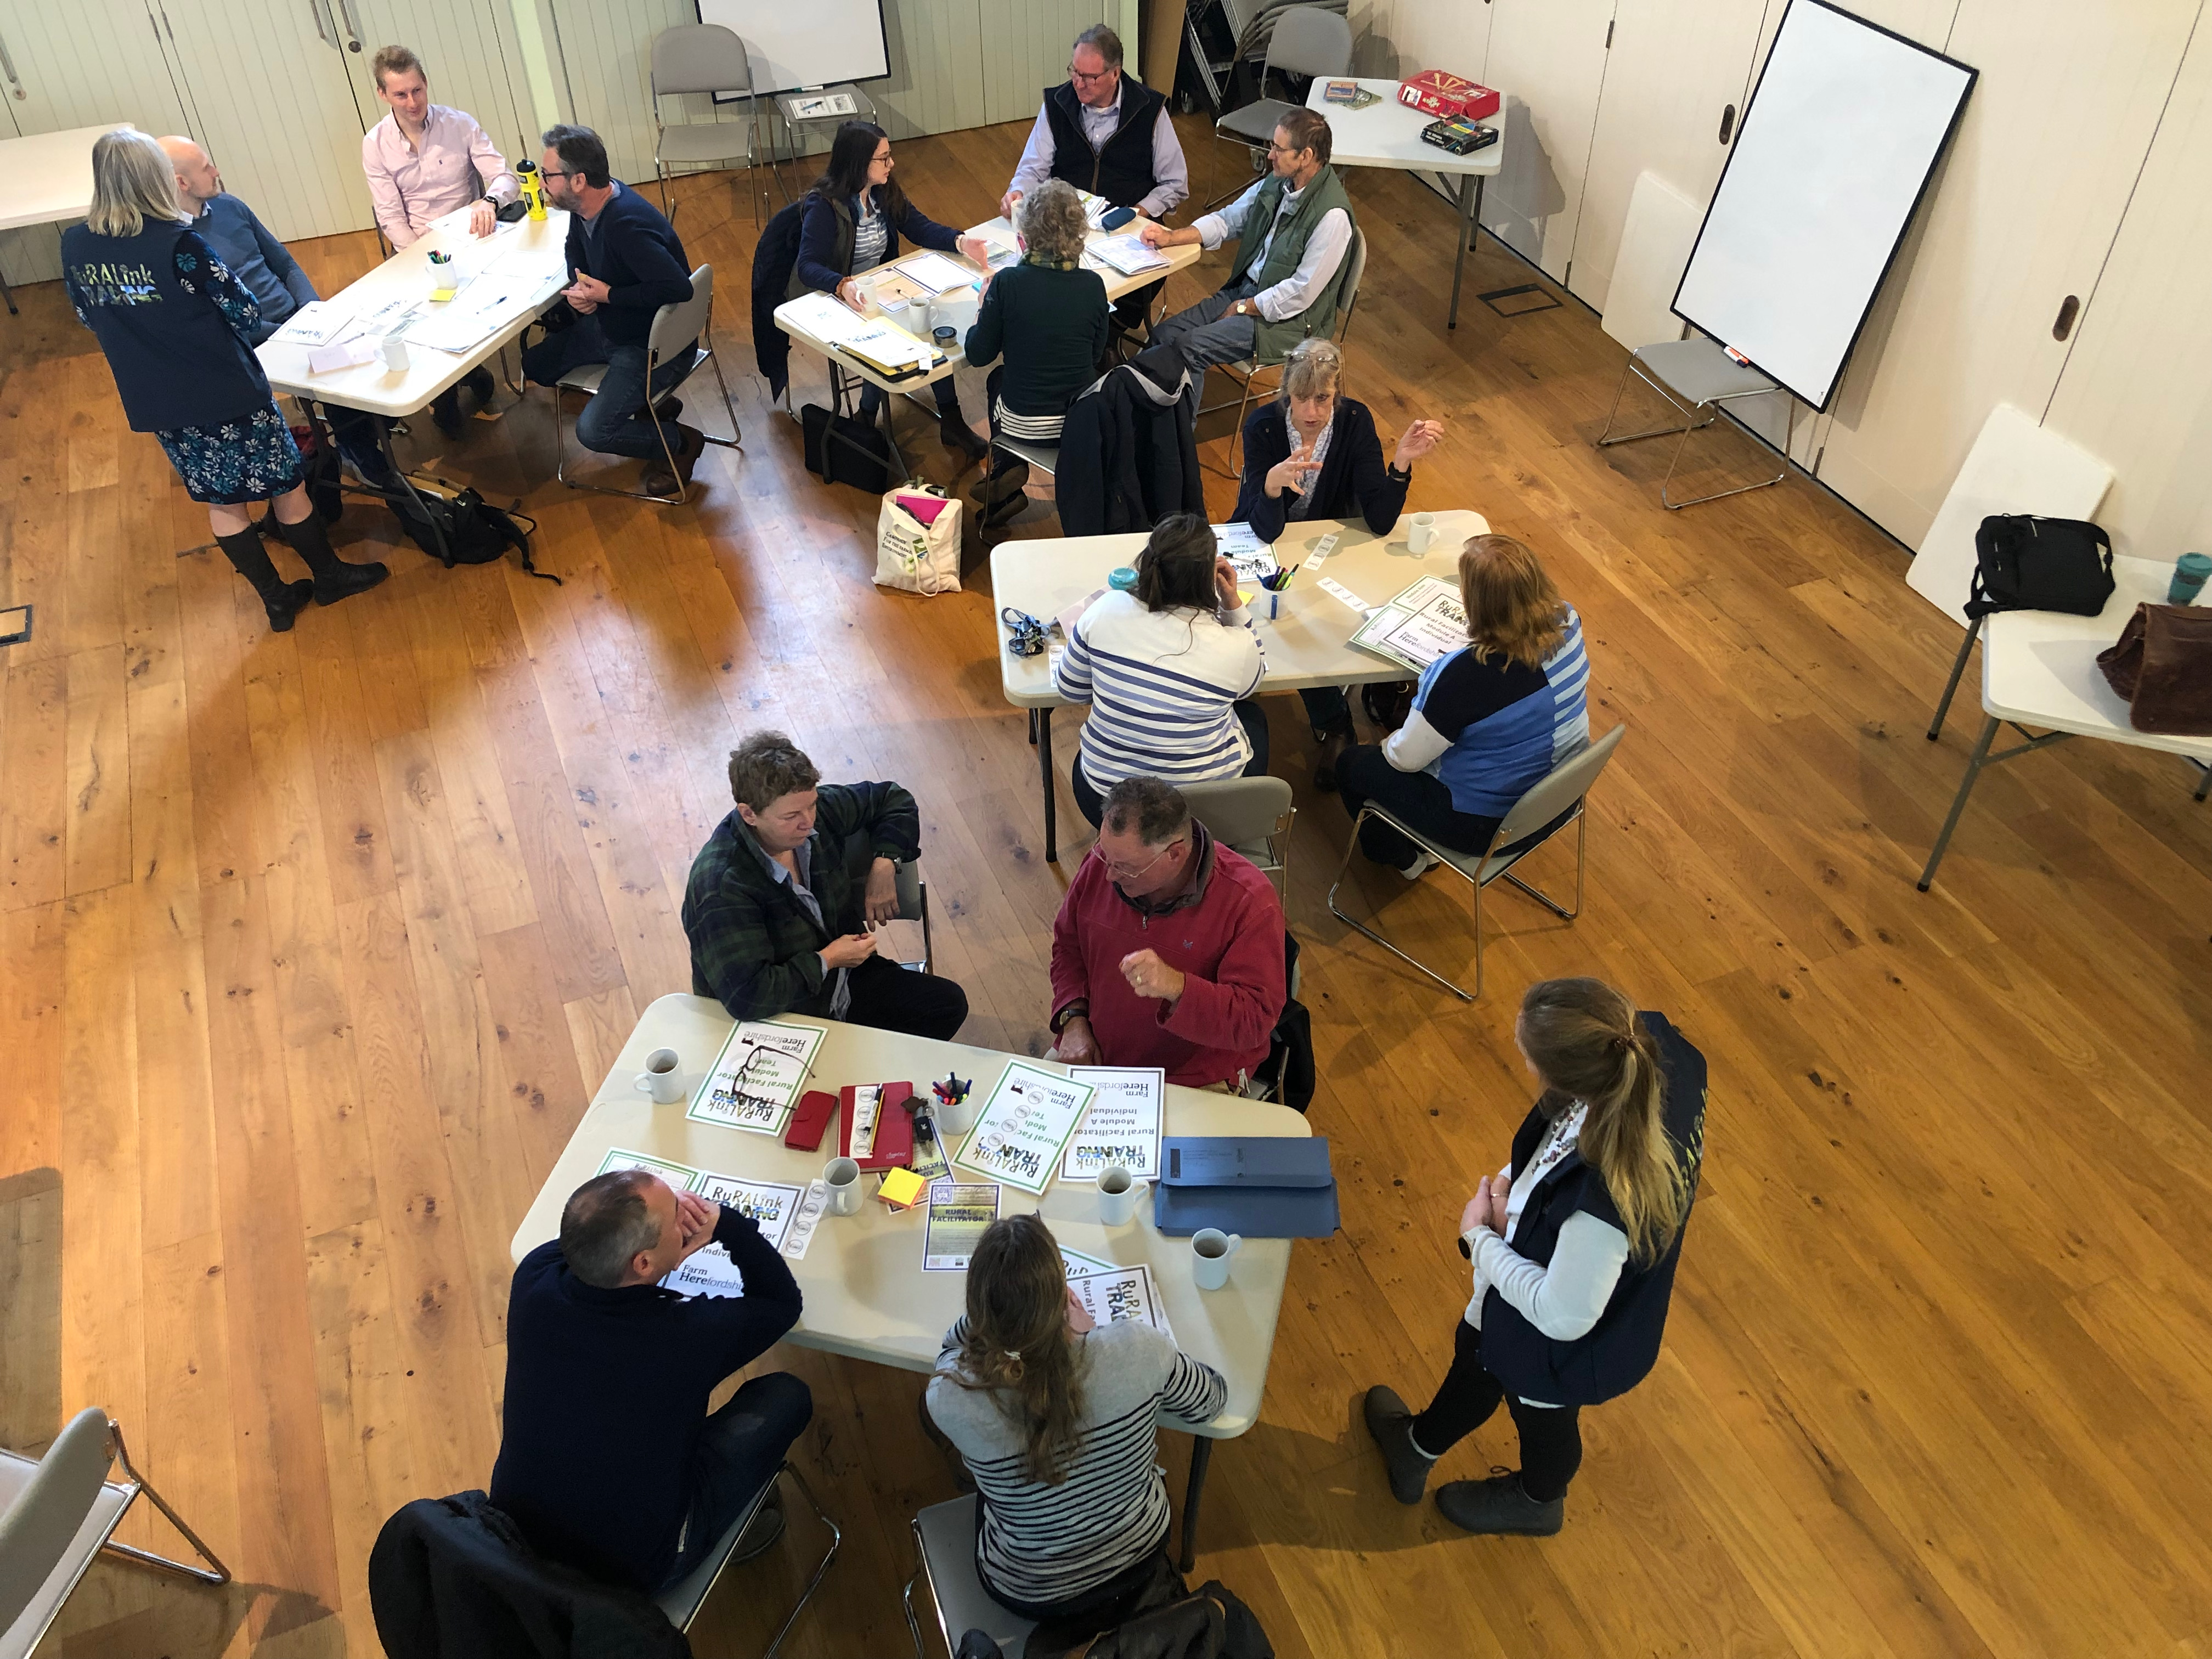
Rural Facilitator (bespoke)
By Ruralink Training
Ruralink Training the home of The Rural Facilitator and the only source of professional learning for Integrated Local Delivery (ILD) practitioners.
Values Based Recruitment
By Mpi Learning - Professional Learning And Development Provider
Recruiting great people to our organisations is the key to high performance and sustainable business success.

Introduction to Agile for Executives
By IIL Europe Ltd
Introduction to Agile for Executives This session provides executives with an overview of Agile values and principles, the key benefits of an Agile approach, and its differences with the traditional Waterfall method. During the session, we compare and contrast the major Agile methods, with an emphasis on Scrum, as the most popular in the market. And most importantly, we present some criteria for Agile Transformation, possible certifications to pursue, and what is needed at the senior leadership level to achieve the best business results. What you will Learn At the end of this program, you will be able to: Explain the basics and benefits of using an Agile approach Describe the Scrum framework, its events, artifacts, and roles and responsibilities Illustrate an Agile approach outside of Software Development Define Scaled Agile Determine how to support an Agile transformation for your organization Getting Started Introduction Course structure Course goals and objectives Agile Introduction What is Agile? Agile benefits Agile myths and realities Overview of Agile Methods Overview of Agile methods Scrum method Lean and Kanban methods Criteria and certifications What Executives Need to Know About Agile Agile is not just for IT Agile can be scaled Agile transformation needs your support Summary and Next Steps Review Personal Action Plan

Introduction to Agile for Executives: In-House Training
By IIL Europe Ltd
Introduction to Agile for Executives: In-House Training This session provides executives with an overview of Agile values and principles, the key benefits of an Agile approach, and its differences with the traditional Waterfall method. During the session, we compare and contrast the major Agile methods, with an emphasis on Scrum, as the most popular in the market. And most importantly, we present some criteria for Agile Transformation, possible certifications to pursue, and what is needed at the senior leadership level to achieve the best business results. What you will Learn At the end of this program, you will be able to: Explain the basics and benefits of using an Agile approach Describe the Scrum framework, its events, artifacts, and roles and responsibilities Illustrate an Agile approach outside of Software Development Define Scaled Agile Determine how to support an Agile transformation for your organization Getting Started Introduction Course structure Course goals and objectives Agile Introduction What is Agile? Agile benefits Agile myths and realities Overview of Agile Methods Overview of Agile methods Scrum method Lean and Kanban methods Criteria and certifications What Executives Need to Know About Agile Agile is not just for IT Agile can be scaled Agile transformation needs your support Summary and Next Steps Review Personal Action Plan
Emergency First Aid at Work 6 hours (VTQ) Level 3 - EFAW - Group booking up to 12 participants
(27)By PETM
Embark on a journey to become a workplace hero with our comprehensive one-day First Aid course. This dynamic and engaging training program is designed to equip you with the essential skills and knowledge needed to handle emergency situations confidently and effectively.

Successfully managing smaller projects (In-House)
By The In House Training Company
The aim of this course is to provide an overview of the principles and practice for leading and managing a portfolio of smaller projects in a multi-project / multi-task environment. It presents a range of practical methods and techniques relevant to the smaller project scenario, using exercises and case studies to show how these can be applied. The scope of the programme includes: The course also emphasises the importance of the leadership and team-working skills needed by project managers and team members in carrying out their roles. The principal training objectives for this programme are to: Explain and demonstrate the key principles of successful project management Demonstrate a range of useful project management tools and techniques Define the role, and help participants understand the skills required by, the project leader Provide a structured framework to help participants manage multiple projects Identify opportunities to improve project management within the organisation DAY ONE 1 Introduction (Course sponsor) Why this programme has been developed Review of participants' needs and objectives 2 Managing smaller projects Projects and project management Lessons from past projects; the essential requirements for success Differences between projects; characteristic project life cycles Key issues and challenges of smaller projects The multi-project world; project portfolio management 3 Project exercise Syndicate teams plan and manage a small project Review of the project exercise: What are the keys to successful management of small projects? 4 Setting up the project Getting organised Managing the definition process Identifying and managing project stakeholders Working with the customer to define the scope and agree deliverables 5 Case study 1 Defining the project scope and deliverables Syndicate teams define the scope and deliverables for a typical project 6 Project planning The importance and cost benefit of effective planning Planning the plan; deciding how detailed a plan to create Packaging the work and estimating timescales and costs Developing project / resource schedules; setting milestones for control v Identifying and managing critical path activities 7 Case study 2 Creating the project plan Syndicate teams develop and analyse the project plan DAY TWO 8 Managing project risks Identifying risks to the project outcome, timescale and cost Evaluating risks and adopting an appropriate risk strategy Defining risk ownership; keeping a simple risk log Keeping risk management up to date; staying pro-active Integrating planning and risk management 9 Project control Managing change, minimising scope creep Selecting the data needed to provide early warning of problems Monitoring performance easily with 'S' curves and slip charts Using trend forecasting to assess true project status Running project review meetings 10 Managing a multi-project portfolio Understanding the world of multiple projects Establishing ownership of project / programme management Classifying projects and creating the 'master schedule' Defining and applying project lifecycle management Resource management: essential pre-requisites and mechanisms Project prioritisation criteria and techniques; pain / gain analysis 11 Managing the multi-project team Characteristics of small project teams / part-time team membership Clarifying line and project management responsibilities Implementing effective manpower planning Establishing professional working practices in the team Developing project management competences in the team Establishing team roles and integrating team members 12 Course review and transfer planning (Course sponsor present) Identify actions to be implemented individually Identify corporate opportunities for improving project management Sponsor-led review and discussion of proposals Conclusion
