- Professional Development
- Medicine & Nursing
- Arts & Crafts
- Health & Wellbeing
- Personal Development
522 Intelligence courses in London delivered Live Online
Data visualization and infographics
By Fire Plus Algebra
The insights gained from data analysis are only truly valuable when you can be clearly expressed to other people – bosses, colleagues, clients, customers, or other stakeholders. In this workshop you’ll learn how to turn raw qualitative or quantitative data into a clear visual story through infographics and data visualization. We'll discuss the key principles for planning an effective visual, look at examples of best (and worst) practice, and learn repeatable and practical design techniques for enhancing the story. We'll also give you an overview of useful tools that will help you turn your idea into a finished infographic or data visualization. You could be conjuring up eye-catching slide decks, building effective reports and dashboards, pitching to investors, or presenting persuasive data to your most important customers. This is a fully interactive online workshop, so be prepared to join discussions and get hands on with building your own visualisations. Takeaways Be able to evaluate the elements that make an infographic or visualization effective. Learn quick and repeatable visual tricks for ensuring infographics convey a clear message. Understand how to tailor your approach to different audiences and context. Discover a bunch of free tools and resources to help you build your own visualizations. Understand how online, interactive visualizations work and how to create them. Delivery We deliver our courses over Zoom, to maximise flexibility. The training can be delivered in a single day, or across multiple sessions. All of our courses are live and interactive – every session includes a mix of formal tuition and hands-on exercises. To ensure this is possible, the number of attendees is capped at 16 people. Tutor Alan Rutter is the founder of Fire Plus Algebra. He is a specialist in communicating complex subjects through data visualisation, writing and design. He teaches for General Assembly and runs in-house training for public sector clients including the Home Office, the Department of Transport, the Biotechnology and Biological Sciences Research Council, the Health Foundation, and numerous local government and emergency services teams. He previously worked with Guardian Masterclasses on curating and delivering new course strands, including developing and teaching their B2B data visualisation courses. He oversaw the iPad edition launches of Wired, GQ, Vanity Fair and Vogue in the UK, and has worked with Condé Nast International as product owner on a bespoke digital asset management system for their 11 global markets. Testimonials "Just to say what a great course this was. I have made my first report employing some of the ideas and tools you showed us – to rapturous responses! The next actions are clear for all and they all understood it! Thank you for helping me to organise my data and thoughts, showing how to present the key message up front, and how to keep it simple and focused. Gearing up for another report now!" Kay Anderson | Head of Finance | Mima "We have been using Tableau to display data for some time but knew we could do more to engage our end users. Alan’s training gave us a framework to start thinking about what we wanted to achieve with our visualisations and analysis, and some great tips on how to display information for maximum impact. Alan was an engaging trainer and we found the workshops very energising." Ellen Austin | Senior Data Analyst | London School of Economics
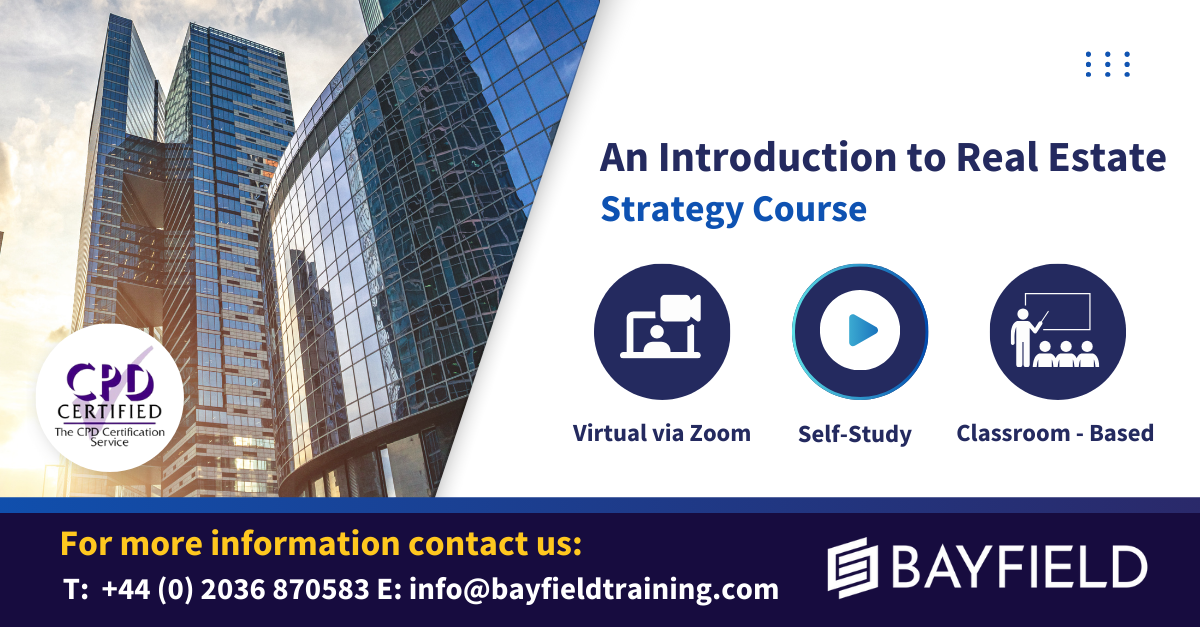
Are you looking to enter the dynamic world of real estate? Our course is designed to equip you with the knowledge and tools you need to communicate effectively with real estate professionals and develop key skills in real estate investment strategy and analytics. At the end of the course, you'll be able to read and interpret real estate market reports, and have a firm grasp of how iconic buildings, cities, and companies fit into the overall picture of the real estate sector. On this course, you will… Become familiar with the players, structure, general terminology and overall needs of Real Estate. Learn what is Real Estate and why it is different from other asset classes Get to grips with the overall size and structure of the UK Real Estate Market Learn and analyse the links between the different parts of the property market Understand who works in the Real Estate Market, their qualifications and their job descriptions Recognise how and when to use basic real estate concepts: Rent, Value, Yield, Risk and Return, etc… Learn how to read a real estate market report Understand how current affairs, politics and economics affects Real Estate Investment Use household names and iconic companies, cities and buildings to help consolidate your appreciation of this exciting sector Who will benefit from this course: Graduates or undergraduates studying economics, finance. Professionals working in Marketing or Accounting teams within Real Estate firms. APC students. Anyone interested in Real Estate. School leavers/A-Level Students looking to gain an understanding of Real Estate. Non cognate students who wish to transfer into Real Estate/Finance careers. Course Outline Module 1: What is and why buy Real Estate? The property Market The Size and Structure of the UK property market The impact of Real Estate in the Economy Module 2: The Real Estate Market System The Space Market The Asset Market The Development Market Module 3: How to value Real Estate An Introduction to Financial Mathematics The difference between Price, Value and Worth Property Yield Conventional Valuation Methods Module 4: How to read a Real Estate Market Report Property Market Indicators: Stock Indicators Property Market Indicators: Investment Indicators Module 5: Who works in Real Estate? The build Environment by Cobalt Recruitment Rea; Estate Agents Examples of Real Estate Market Agents CVs Real Estate Network
Excel for business professionals
By Nexus Human
Duration 2.25 Days 13.5 CPD hours This course is intended for The job roles best suited to the material in this course are: sales personnel, accountants, administrators, auditors, lab assistants, office job positions. Overview Work with functions. Work with lists. Analyze data. Visualize data with charts. Use PivotTables and PivotCharts. Work with multiple worksheets and workbooks. Share and protect workbooks. Automate workbook functionality. Use Lookup functions and formula auditing. Forecast data. Create sparklines and map data This course provides the knowledge to create advanced workbooks and worksheets that can deepen the understanding of organizational intelligence. The ability to analyze massive amounts of data, extract actionable information from it and present that information to decision makers. In addition this course will give you the ability to collaborate with colleagues, automate complex or repetitive tasks and use conditional logic to construct and apply elaborate formulas and functions which will allow you to work through a lot of data and generate the answers that your organisation needs. WORKING WITH FUNCTIONS Topic A: Work with Ranges Topic B: Use Specialized Functions Topic C: Work with Logical Functions Topic D: Work with Date and Time Functions Topic E: Work with Text Functions WORKING WITH LISTS Topic A: Sort Data Topic B: Filter Data Topic C: Query Data with Database Functions Topic D: Outline and Subtotal Data ANALYZING DATA Topic A: Create and Modify Tables Topic B: Apply Intermediate Conditional Formatting Topic C: Apply Advanced Conditional Formatting VISUALIZING DATA WITH CHARTS Topic A: Create Charts Topic B: Modify and Format Charts Topic C: Use Advanced Chart Features USING PIVOTTABLES AND PIVOTCHARTS Topic A: Create a PivotTable Topic B: Analyze PivotTable Data Topic C: Present Data with PivotCharts Topic D: Filter Data by Using Timelines and Slicers WORKING WITH MULTIPLE WORKSHEETS AND WORKBOOKS Topic A: Use Links and External References Topic B: Use 3-D References Topic C: Consolidate Data SHARING AND PROTECTING WORKBOOKS Topic A: Collaborate on a Workbook Topic B: Protect Worksheets and Workbooks AUTOMATING WORKBOOK FUNCTIONALITY Topic A: Apply Data Validation Topic B: Search for Invalid Data and Formulas with Errors Topic C: Work with Macros USING LOOKUP FUNCTIONS AND FORMULAS AUDITING Topic A: Use Lookup Functions Topic B: Trace Cells Topic C: Watch and Evaluate Formulas FORECASTING DATA Topic A: Determine Potential Outcomes Using Data Tables Topic B: Determine Potential Outcomes Using Scenarios Topic C: Use the Goal Seek Feature Topic D: Forecast Data Trends CREATING SPARKLINES AND MAPPING DATA Topic A: Create Sparklines Topic B: Map Data

Certified Penetration Testing Professional (CPENT)
By Nexus Human
Duration 5 Days 30 CPD hours This course is intended for This course is intended for Ethical Hackers, Penetration Testers, Network Server Administrators, Firewall Administrators, Security Testers, System Administrators and Risk Assessment Professionals, Cybersecurity Forensic Analyst, Cyberthreat Analyst, Cloud Security, Analyst Information Security Consultant, Application Security Analyst, Cybersecurity Assurance Engineer, Security Operations Center (SOC) Analyst, Technical Operations Network Engineer, Information Security Engineer, Network Security Penetration Tester, Network Security Engineer, Information Security Architect. Overview Upon successful completion of this course, students will master their Penetration Testing skills, perform the repeatable methodology, become committed to the code of ethics, and present analyzed results through structured reports. The main course outcomes include: 100% mapped with the NICE framework. Maps to the job role of a Penetration Tester and security analyst, based on major job portals. 100% methodology-based Penetration Testing program. Provides strong reporting writing guidance. Blended with both manual and automated Penetration Testing approaches. Gives a real-world experience through an Advanced Penetration Testing Range. Designed based on the most common Penetration Testing services offered by the best service providers in the market. Offers standard templates that can help during a Penetration test. This is a multidisciplinary course with extensive hands-on training in a wide range of crucial skills, including advanced Windows attacks, Internet of Things (IoT) and Operational Technology (OT) systems, filtered network bypass techniques, exploit writing, single and double pivoting, advanced privilege escalation, and binary exploitation. Course Outline Introduction to Penetration Testing Penetration Testing Scoping and Engagement Open Source Intelligence (OSINT) Social Engineering Penetration Testing Network Penetration Testing ? External Network Penetration Testing ? Internal Network Penetration Testing - Perimeter Devices Web Application Penetration Testing Wireless Penetration Testing IoT Penetration Testing OT/SCADA Penetration Testing Cloud Penetration Testing Binary Analysis and Exploitation Report Writing and Post-Testing Actions Additional course details: Nexus Humans Certified Penetration Testing Professional (CPENT) training program is a workshop that presents an invigorating mix of sessions, lessons, and masterclasses meticulously crafted to propel your learning expedition forward. This immersive bootcamp-style experience boasts interactive lectures, hands-on labs, and collaborative hackathons, all strategically designed to fortify fundamental concepts. Guided by seasoned coaches, each session offers priceless insights and practical skills crucial for honing your expertise. Whether you're stepping into the realm of professional skills or a seasoned professional, this comprehensive course ensures you're equipped with the knowledge and prowess necessary for success. While we feel this is the best course for the Certified Penetration Testing Professional (CPENT) course and one of our Top 10 we encourage you to read the course outline to make sure it is the right content for you. Additionally, private sessions, closed classes or dedicated events are available both live online and at our training centres in Dublin and London, as well as at your offices anywhere in the UK, Ireland or across EMEA.
Palo Alto Networks: Cortex XSOAR 6.8: Automation and Orchestration(EDU-380)
By Nexus Human
Duration 4 Days 24 CPD hours This course is intended for Security-operations (SecOps), or security, orchestration, automation, and response (SOAR) engineers, managed security service providers (MSSPs), service delivery partners, system integrators, and professional services engineers Overview This training is designed to enable a SOC, CERT, CSIRT, or SOAR engineer to start working with Cortex XSOAR integrations, playbooks, incident-page layouts, and other system features to facilitate resource orchestration, process automation, case management, and analyst workflow. The course includes coverage of a complete playbook-development process for automating a typical analyst workflow to address phishing incidents. This end-to-end view of the development process provides a framework for more focused discussions of individual topics that are covered in the course. The Cortex? XSOAR 6.8: Automation and Orchestration (EDU-380) course is four days of instructor-led training that will help you: Configure integrations, create tasks, and develop playbooks Build incident layouts that enable analysts to triage and investigate incidents efficiently Identify how to categorize event information and map that information to display fields Develop automations, manage content, indicator data, and artifact stores, schedule jobs, organize users and user roles, oversee case management, and foster collaboration This class is powered by Cloud Harmonics. Course Outline Module 1 - Core Functionality and Feature Sets Module 2 - Enabling and Configuring Integrations Module 3 - Playbook Development Module 4 - Classification and Mapping Module 5 - Layout Builder Module 6 - Solution Architecture Module 7 - Docker Module 8 - Automation Development and Debugging Module 9 - The Marketplace and Content Management Module 10 - Indicators and Threat Intelligence Management Module 11 - Jobs and Job Scheduling Module 12 - Users and Role-Based Access Controls (RBAC) Module 13 - Integration Development Additional course details: Nexus Humans Palo Alto Networks: Cortex XSOAR 6.8: Automation and Orchestration(EDU-380) training program is a workshop that presents an invigorating mix of sessions, lessons, and masterclasses meticulously crafted to propel your learning expedition forward. This immersive bootcamp-style experience boasts interactive lectures, hands-on labs, and collaborative hackathons, all strategically designed to fortify fundamental concepts. Guided by seasoned coaches, each session offers priceless insights and practical skills crucial for honing your expertise. Whether you're stepping into the realm of professional skills or a seasoned professional, this comprehensive course ensures you're equipped with the knowledge and prowess necessary for success. While we feel this is the best course for the Palo Alto Networks: Cortex XSOAR 6.8: Automation and Orchestration(EDU-380) course and one of our Top 10 we encourage you to read the course outline to make sure it is the right content for you. Additionally, private sessions, closed classes or dedicated events are available both live online and at our training centres in Dublin and London, as well as at your offices anywhere in the UK, Ireland or across EMEA.
Improving Self Awareness
By Nexus Human
Duration 1 Days 6 CPD hours This course is intended for This course is intended for anyone engaged with teams or looking to live a more fulfilling life. Overview Upon successful completion of this course, participants will gain a new perspective on themselves and their emotions, and increase their value to society. In this course, participants will learn how beneficial becoming more self-aware can be and see how a highly self-aware person becomes more equipped to deal with daily life and its challenges. Getting Started Workshop Objectives Action Plan What is the Self? The Physical Self The Emotional Self The Mental Self The Spiritual Self Practical Illustration Awareness of the Physical Self Scanning Progressive Relaxation Physical Stressors Exercise Practical Illustration Time Management Organization Goal Management Priorities Procrastination Practical Illustration The Emotional Self Validity of Emotions Utility of Emotions Emotional Arousal Emotional Valence Practical Illustration Mood Management Emotional Intelligence Categories of Emotion Increasing Arousal Decreasing Arousal Practical Illustration The Mental Self Thinking Style Learning Style Personality Stinking Thinking Practical Illustration Interpersonal Awareness Addressing Different Thinking Styles Addressing Different Learning Styles Active Listening and Body Language Transactional Analysis Practical Illustration The Spiritual Self Mindfulness Meditation Cultivating Positivity Gratitude Practical Illustration Limitations of Self Awareness Navel Gazing Excessive Self Discipline Developing Humility Developing Empathy Practical Illustration Independence versus Interdependence What is Interdependence? Systems Theory More Than the Sum of All Parts Team Building Practical Illustration Wrapping Up Words from the Wise Additional course details: Nexus Humans Improving Self Awareness training program is a workshop that presents an invigorating mix of sessions, lessons, and masterclasses meticulously crafted to propel your learning expedition forward. This immersive bootcamp-style experience boasts interactive lectures, hands-on labs, and collaborative hackathons, all strategically designed to fortify fundamental concepts. Guided by seasoned coaches, each session offers priceless insights and practical skills crucial for honing your expertise. Whether you're stepping into the realm of professional skills or a seasoned professional, this comprehensive course ensures you're equipped with the knowledge and prowess necessary for success. While we feel this is the best course for the Improving Self Awareness course and one of our Top 10 we encourage you to read the course outline to make sure it is the right content for you. Additionally, private sessions, closed classes or dedicated events are available both live online and at our training centres in Dublin and London, as well as at your offices anywhere in the UK, Ireland or across EMEA.
Unlock the Power of AI: A Product Manager's Guide to Working Smarter, Not Harder
By Front Porch Agility
Feeling overwhelmed by multiple tasks? Ready to enhance your product management strategy with AI technology? It’s time to meet your new AI partner! Our course, “Unlocking the Power of AI,” will demonstrate how cutting-edge tools like Generative Pre-trained Transformers (GPTs) can simplify your workflow and bolster your decision-making process. In modern-day fast paced commercial enterprise world, adaptability is vital for success. As a product manager, you oversee the entire product lifecycle—from concept to launch and beyond. With Certified Product Management techniques, you can navigate changing market dynamics, prioritize features efficiently, and deliver value to customers quickly. However, agility alone isn’t sufficient. To excel in your role, embrace the potential of AI. By integrating AI into your practices, you can automate tasks, analyze data effortlessly, and make informed decisions. Picture having a virtual assistant capable of analyzing data and predicting market trends. With AI as your ally, you can focus on engaging customers, innovating, and strategic planning. Don’t hesitate. Embrace the future of product management now. Join us on this journey to unlock the full potential of AI, revolutionizing your workflow and achieving your goals faster than ever before. What You'll Learn (in just 3 hours!) AI 101 for Product Managers We'll break down the buzzwords and get you up to speed on how AI (especially those clever GPTs) can transform your work life. Market Research Master Think of your new AI pal as a super-powered market researcher. Learn how to analyze competitor data, customer feedback, and trends faster than you can say "pivot!" AI-Powered Strategy Say goodbye to gut feelings and hello to data-driven insights. Discover how AI helps you strategize, prioritize features, and build roadmaps that will make your product shine. Hands-on Workshop Dive into real-world scenarios and use GPT tools to tackle market analysis, craft user stories, and nail down your product roadmap. Ethics in the AI Age We'll explore responsible AI use and make sure you understand the potential pitfalls. Because with great power comes great responsibility! Our AI + Your Workflow = Dream Team We'll cover how to access our Product Management tool, how to use it effectively and fit it seamlessly into your existing processes. The future of Product Management is here, don’t get left behind. This course is perfect for Product managers and owners are essential drivers of product success, constantly challenged to balance priorities, navigate complex decisions, and foster innovation in competitive markets. With technology advancing rapidly and consumer preferences evolving, staying ahead can be daunting. Our training programs offer a solution. Designed for product managers and owners, they equip you with the tools, insights, and strategies to enhance productivity, make informed decisions, and ignite innovation. Our courses empower you to navigate modern challenges successfully. Whether you seek to refine strategic planning, optimize product development, or enhance customer engagement, our tailored programs cater to your needs. Join us on a journey to unlock your full potential and propel your career to new heights as a product manager or owner. The Takeaway Empowerment: Leave this workshop feeling empowered, armed with a potent toolkit for achieving product success. AI in Product Management: Recognize that AI is the future of product management, and this course will equip you to leverage its potential effectively. Leadership Position: Position yourself as a leader in product management by embracing AI and staying ahead of industry trends. Innovation: Embrace innovation and drive change within your organization with the insights gained from this course. Confidence: Approach the future with confidence, knowing that you have the skills and knowledge to navigate the evolving landscape of product management.
VMware Workspace ONE: UEM Bootcamp [V22.x]
By Nexus Human
Duration 5 Days 30 CPD hours This course is intended for Workspace ONE UEM operators and administrators, account managers, solutions architects, solutions engineers, sales engineers, and consultants Overview By the end of the course, you should be able to meet the following objectives: Explain and apply the fundamental techniques for launching and maintaining an intelligence-driven, multiplatform endpoint management solution with Workspace ONE UEM Outline the components of Workspace ONE UEM Explain the general features and functionality enabled with Workspace ONE UEM Summarize basic Workspace ONE administrative functions Explain and deploy common Workspace ONE integrations Securely deploy configurations to Workspace ONE UEM managed devices Onboard device endpoints into Workspace ONE UEM Summarize alternative management methodologies for rugged devices Discuss strategies for maintaining environment and device fleet health Configure and deploy applications to Workspace ONE UEM managed devices Analyze a Workspace ONE UEM deployment Enable email access on devices Integrate Workspace ONE UEM with content repositories and corporate file shares Summarize basic troubleshooting methodologies Outline common troubleshooting techniques in the Workspace ONE UEM console Outline common troubleshooting techniques when integrating enterprise solutions in the Workspace ONE UEM console Summarize common troubleshooting strategies for Workspace ONE UEM managed devices Outline common application management troubleshooting techniques in the Workspace ONE UEM console Summarize common troubleshooting techniques for email management in the Workspace ONE UEM console Explain common troubleshooting approaches for the VMware Unified Access Gateway⢠platform and individual edge services Outline useful troubleshooting tools, such as the Self-Service Portal and VMware Workspace ONE Assist⢠In this five-day course, you learn how to apply the fundamental techniques for launching and maintaining an intelligence-driven, multiplatform endpoint management solution with VMware Workspace ONE© UEM. Through a combination of hands-on labs, simulations, and interactive lectures, you will configure and manage the endpoint life cycle. You will also learn to investigate, analyze, and determine issues that might occur with all the different components of Workspace ONE UEM.By understanding how to effectively troubleshoot product issues, administrators can understand how product services communicate and function, in turn optimizing service and software health management. At the end of five days, you will have the foundational knowledge for effectively managing and conducting basic troubleshooting for Workspace ONE UEM. Course Introduction Introductions and course logistics Course objectives Online resources and references Platform Architecture Summarize the features and functionality of Workspace ONE UEM Outline the benefits of leveraging Workspace ONE UEM Recognize the core and productivity components that make up the Workspace ONE UEM platform Summarize high availability and disaster recovery for the Workspace ONE solution Administration Navigate and customize the Workspace ONE UEM console Summarize the hierarchical management structure Explain the features and functions of Workspace ONE Hub Services Outline account options and permissions Enterprise Integrations Outline the process and requirements to integrate with directory services Explain certificate authentication and practical implementation with Workspace ONE Explain the benefits of integrating an email SMTP service into the Workspace ONE UEM console Describe VMware Dynamic Environment Manager? and its architecture Onboarding Outline the prerequisite configurations in the Workspace ONE UEM environment for onboarding devices for management Outline the steps for setting up autodiscovery in the Workspace ONE UEM console Enroll an endpoint through the VMware Workspace ONE© Intelligent Hub app Summarize platform onboarding options Managing Endpoints Explain the differences between device and user profiles Describe policy management options for Windows and macOS Describe the functions and benefits of using compliance policies Explain the use case for Freestyle Orchestrator Describe the capabilities that sensors and scripts enable Alternative Management Methods Describe the function and benefits of device staging Configure product provisioning in the Workspace ONE UEM console Understand the benefits of deploying a VMware Workspace ONE© Launcher? configuration to Android devices List the system and device requirements for Linux device management in Workspace ONE UEM Applications Describe the features, benefits, and capabilities of application management in Workspace ONE UEM Understand and configure deployment settings for public, internal, and paid applications in the Workspace ONE UEM console Describe the benefits of using Apple Business Manager content integration Describe the benefits of using server-to-client software distribution List the functions and benefits of VMware Workspace ONE© SDK Device Email List the email clients supported by Workspace ONE UEM Configure an Exchange Active Sync profile in the Workspace ONE UEM console Configure VMware Workspace ONE© Boxer settings Summarize the available email infrastructure integration models and describe their workflows Configure email compliance policies and notifications services Content Sharing Describe the benefits of using Content Gateway and the Content Gateway workflows Describe the benefits of integrating content repositories with Workspace ONE UEM Configure a repository in the Workspace ONE UEM console Maintenance Manage endpoints from the Device List View and the Device Details View pages Analyze endpoint deployment and compliance data from Monitor Overview page Fundamentals of Troubleshooting Workspace ONE UEM Outline software troubleshooting logic and support methods Summarize the main process flows for the Workspace ONE UEM components Explain the importance of Workspace ONE UEM process flows for troubleshooting Identify different Workspace ONE UEM log files Workspace ONE UEM Console Troubleshooting Outline the best practices for troubleshooting Workspace ONE UEM console issues Identify common group management and assignment-related issues Outline common issues for Workspace ONE UEM console roles and system settings Understand how analytic events can be used to identity platform errors Summarize the steps for collecting and analyzing Workspace ONE UEM console logs Integration Troubleshooting Outline the common enterprise integrations in Workspace ONE UEM Outline common troubleshooting techniques for the VMware AirWatch© Cloud Connector? Troubleshoot issues related to Directory Services integration Identify directory user and groups synchronization issues Troubleshoot issues related to certificate authority integration Explain VMware Workspace ONE© Access? integration and Workspace ONE Intelligent Hub troubleshooting techniques Endpoint Troubleshooting Compare the endpoint connection topologies in Workspace ONE UEM Outline useful tools and resources for endpoint troubleshooting Summarize the best practices for device enrollment troubleshooting Explain device connectivity troubleshooting techniques Demonstrate how to identify and resolve profile-related issues Identify common compliance policy issues and potential root causes Application Troubleshooting Explain the different scoping questions for troubleshooting applications Review application management configurations Summarize the general tools and resources for application troubleshooting Describe the general logic of troubleshooting public applications Understand internal application issues and potential causes Explain purchased application troubleshooting techniques Unified Access Gateway and Edge Services Troubleshooting Review Unified Access Gateway architecture and edge service workflows Understand Unified Access Gateway general configurations Explain how to utilize Unified Access Gateway related troubleshooting tools and resources Identify and resolve common issues for Content Gateway on Unified Access Gateway Summarize troubleshooting techniques for VMware Workspace ONE© Tunnel? on Unified Access Gateway Email Troubleshooting Review different email architecture and workflows Summarize common errors associated with email profiles Identify tools and resources for email troubleshooting Discuss troubleshooting techniques for VMware AirWatch© Secure Email Gateway? on Unified Access Gateway Outline PowerShell integration issues and techniques to address them Additional Troubleshooting Tools Describe how the Self-Service Portal helps administrators and empowers end users to resolve issues Explain how Workspace ONE Assist can help with troubleshooting endpoints
CertNexus Data Ethics for Business Professionals (DEBIZ)
By Nexus Human
Duration 1 Days 6 CPD hours This course is intended for This course is designed for business leaders and decision makers, including C-level executives, project and product managers, HR leaders, Marketing and Sales leaders, and technical sales consultants, who have a vested interest in the representation of ethical values in technology solutions. Other individuals who want to know more about data ethics are also candidates for this course. This course is also designed to assist learners in preparing for the CertNexus DEBIZ⢠(Exam DEB-110) credential. The power of extracting value from data utilizing Artificial Intelligence, Data Science and Machine Learning exposes the learning differences between humans and machines. Humans can apply ethical principles throughout the decision-making process to avoid discrimination, societal harm, and marginalization to maintain and even enhance acceptable norms. Machines make decisions autonomously. So how do we train them to apply ethical principles as they learn from decisions they make? This course provides business professionals and consumers of technology core concepts of ethical principles, how they can be applied to emerging data driven technologies and the impact to an organization which ignores ethical use of technology. Introduction to Data Ethics Defining Data Ethics The Case for Data Ethics Identifying Ethical Issues Improving Ethical Data Practices Ethical Principles Ethical Frameworks Data Privacy Accountability Transparency and Explainability Human-Centered Values and Fairness Inclusive Growth, Sustainable Development, and Well-Being Applying Ethical Principles to Emerging Technology Improving Ethical Data Practices Sources of Ethical Risk Mitigating Bias Mitigating Discrimination Safety and Security Mitigating Negative Outputs Data Surveillance Assessing Risk Ethical Risks in sharing data Applying professional critical judgement Business Considerations Data Legislation Impact of Social and Behavioral Effects Trustworthiness Impact on Business Reputation Organizational Values and the Data Value Chain Building a Data Ethics Culture/Code of Ethics Balancing organizational goals with Ethical Practice Additional course details: Nexus Humans CertNexus Data Ethics for Business Professionals (DEBIZ) training program is a workshop that presents an invigorating mix of sessions, lessons, and masterclasses meticulously crafted to propel your learning expedition forward. This immersive bootcamp-style experience boasts interactive lectures, hands-on labs, and collaborative hackathons, all strategically designed to fortify fundamental concepts. Guided by seasoned coaches, each session offers priceless insights and practical skills crucial for honing your expertise. Whether you're stepping into the realm of professional skills or a seasoned professional, this comprehensive course ensures you're equipped with the knowledge and prowess necessary for success. While we feel this is the best course for the CertNexus Data Ethics for Business Professionals (DEBIZ) course and one of our Top 10 we encourage you to read the course outline to make sure it is the right content for you. Additionally, private sessions, closed classes or dedicated events are available both live online and at our training centres in Dublin and London, as well as at your offices anywhere in the UK, Ireland or across EMEA.
Palo Alto Networks : Strata Foundations
By Nexus Human
Duration 1 Days 6 CPD hours This course is intended for Security Engineers Network Engineers Support staff Overview This course is intended to provide an understanding of Palo Alto Networks Next-Generation firewall technologies enable the student to perform a basic installation of Palo Alto Networks Next-Generation firewalls. Upon completion of this course, students will be able to: Explain the features and advantages of the Palo Alto Networks next-generation firewall architecture Understand the capabilities of App-ID, Content-ID, and User-ID Perform the basic configuration of the firewall including: Interfaces and virtual routers NAT Policies Security zones Objects Security policies Content security profiles View logs and basic reports This course was formerly named Palo Alto Networks Foundations of Next Generation Firewalls (EDU-150). ** Our foundation classes are just introductory trainings, NOT a full technical training. Your network has expanded beyond your organization\'s boundaries. Cloud locations and remote users (often using personal devices) have \'distributed\' the surface you need to both enable and protect.At the same time, the motivations of attackers and their sophistication have continued to evolve.Palo Alto Networks' next-generation firewalls are all based on a consistent Single-Pass Architecture, enabling security capability that is unique in the industry. This architecture is implemented in a portfolio of both physical and virtual appliances, designed to cover a range of performance and use case requirements.Features and management are consistent across the portfolio. Integration with GlobalProtect? mobile security service extends policy-based security to mobile devices (whether on-premises or remote). Integration with our threat intelligence services keeps information up to date for the firewall (e.g., URL categories, threat signatures). WildFire? cloud-based malware analysis environment integration supports a rapid \'feedback loop\' that enables the firewall to stop advanced threats throughout the attack lifecycle. Course Outline Module 0: Introduction Module 1: Platforms & Architecture Module 2: Getting Started Module 3: Basic Administration Module 4: Connectivity Module 5: Security Module 6: Logging & Reporting Additional course details: Nexus Humans Palo Alto Networks : Strata Foundations training program is a workshop that presents an invigorating mix of sessions, lessons, and masterclasses meticulously crafted to propel your learning expedition forward. This immersive bootcamp-style experience boasts interactive lectures, hands-on labs, and collaborative hackathons, all strategically designed to fortify fundamental concepts. Guided by seasoned coaches, each session offers priceless insights and practical skills crucial for honing your expertise. Whether you're stepping into the realm of professional skills or a seasoned professional, this comprehensive course ensures you're equipped with the knowledge and prowess necessary for success. While we feel this is the best course for the Palo Alto Networks : Strata Foundations course and one of our Top 10 we encourage you to read the course outline to make sure it is the right content for you. Additionally, private sessions, closed classes or dedicated events are available both live online and at our training centres in Dublin and London, as well as at your offices anywhere in the UK, Ireland or across EMEA.