- Professional Development
- Medicine & Nursing
- Arts & Crafts
- Health & Wellbeing
- Personal Development
145 Excel Analytics courses
Microsoft Excel Mastery with SQL, Data Analysis, Financial Modelling - 8 Courses Bundle
By NextGen Learning
Have you ever wondered how businesses transform raw data into actionable insights or how financial analysts accurately pinpoint market trends? Microsoft Excel stands tall as the fulcrum that balances numerous sectors of the business world. This 8-course Microsoft Excel Mastery: AutoCAD, SQL, Data Analysis, Financial Modelling & Marketing bundle dives deep into the myriad applications of Microsoft Excel, from interfacing with AutoCAD to crafting marketing strategies and comprehensive financial models. In an era defined by data-driven decisions, this 8-course Microsoft Excel Mastery: AutoCAD, SQL, Data Analysis, Financial Modelling & Marketing bundle is tailored to equip learners with the multifaceted applications of Microsoft Excel. Ranging from foundational Excel operations to advanced integrations with tools like AutoCAD and MySQL, the course bundle aims to foster expertise in data management, analysis, and visualisation. Whether you're venturing into financial modelling, HR analytics, or design integration, this bundle serves as a comprehensive guide to mastering Excel in diverse professional realms, ensuring you are well-prepared to leverage its capabilities in the modern workplace. Ready to excel in your career? Embrace the transformative power of data and design by mastering Microsoft Excel with our comprehensive course bundle. Dive in now and shape your future with unparalleled proficiency! The Eight CPD Accredited courses that the bundle includes are: Course 1: Microsoft Excel Course for Everyone - Complete Excel Course Course 2: Excel VBA/Macros Foundations Course 3: Dynamic Excel Gantt Chart and Timelines Course 4: Hands on Programming on AutoCAD to Excel Using VB.NET Course 5: Learn MySQL from Scratch for Data Science and Analytics Course 6: Data Analytics Course 7: Build HR Dashboard using Excel Course 8: Financial Modelling Using Excel Learning Outcomes: Gain comprehensive knowledge and understanding of Microsoft Excel and its vast capabilities. Understand the seamless integration between Excel and tools like AutoCAD and MySQL. Develop proficiency in creating intricate financial models and marketing strategies. Acquire skills to analyse data, forecast trends, and build informative dashboards. Learn the principles of personal finance management using Excel. Master the art of crafting Gantt charts and timelines for effective project management. Microsoft Excel Course for Everyone - Complete Excel Course: Acquaint yourself with the foundational and advanced facets of Microsoft Excel, fostering data management expertise. Excel VBA/Macros Foundations: Dive into the transformative world of VBA, unlocking Excel's programming potentials. Dynamic Excel Gantt Chart and Timelines: Grasp the essentials of project management by designing insightful Gantt charts and timelines in Excel. Hands on Programming on AutoCAD to Excel Using VB.NET: Bridge the realms of design and data by merging AutoCAD functionalities with Microsoft Excel's prowess. Learn MySQL from Scratch for Data Science and Analytics: Understand the confluence of Excel and MySQL, anchoring data science and analytics. Data Analytics: Master the techniques of transforming raw numbers into actionable insights using Microsoft Excel. Build HR Dashboard using Excel: Curate informative HR dashboards, offering a snapshot of organisational metrics, all within Excel. Financial Modelling Using Excel: Unravel the intricacies of financial markets, crafting accurate models in Microsoft Excel. CPD 90 CPD hours / points Accredited by CPD Quality Standards Who is this course for? Individuals keen on enhancing their Microsoft Excel skills for professional or personal reasons. Marketing professionals aiming to refine their strategic planning with Excel. Financial analysts and enthusiasts looking to build and understand models in Excel. Data scientists and analysts desire to integrate Excel with tools like MySQL. Design engineers and architects keen on integrating AutoCAD designs with Excel data. Career path Data Analyst Financial Modeller Marketing Strategist HR Dashboard Specialist Database Administrator (with Excel integration knowledge) Project Manager (familiar with Gantt and timelines in Excel) Design Engineer using Excel with AutoCAD Certificates CPD Certificate Of Completion Digital certificate - Included 8 Digital Certificates Are Included With This Bundle CPD Quality Standard Hardcopy Certificate (FREE UK Delivery) Hard copy certificate - £9.99 Hardcopy Transcript: £9.99

Crystal Reports 2016 - Part 2
By Nexus Human
Duration 2 Days 12 CPD hours This course is intended for This course is designed for people who know how to create basic list and group reports and need to create reports that include subreports, cross-tabs, advanced formulas, and charts based on more than one data series. They may also need to build tools that make it easier for other people to create reports. They may or may not have programming and/or SQL experience. Overview In this course, you will create complex reports using tools in Crystal Reports 2016. You will: Create automatic and manual running totals. Work with cross-tab reports. Add subreports. Create drill-downs in a report. Use SQL statements in report processing. Create complex formulas. Add charts to reports. Enhance report functionality. In this course, students will create complex reports & data sources using the tools in Crystal Reports 2016. Students will not only create more complex reports including sub-reports and cross-tabs, but will also increase their speed and efficiency. 1 - CREATING RUNNING TOTALS Topic A: Create a Running Total Field Topic B: Modify a Running Total Field Topic C: Create a Manual Running Total 2 - WORKING WITH CROSS-TABS Topic A: Create a Cross-Tab Report Topic B: Format a Cross-Tab Report Topic C: Create Groups in Cross-Tab Reports 3 - ADDING SUBREPORTS Topic A: Insert a Subreport Topic B: Edit a Subreport Topic C: Share Variables 4 - CREATING DRILL-DOWNS IN A REPORT Topic A: Create a Drill-Down Topic B: Create Headings for Drill-Down Data 5 - USING SQL STATEMENTS IN REPORT PROCESSING Topic A: Create a Report Using SQL Queries Topic B: Summarize Report Data Topic C: Create Joins Using SQL Topic D: Create Subqueries Topic E: Create an SQL Expression Field 6 - CREATING COMPLEX FORMULAS Topic A: Work with Loops Topic B: Work with Arrays 7 - ADDING CHARTS TO REPORTS Topic A: Create Charts Topic B: Create a Chart with Drill-Down Topic C: Create a Top N Chart Topic D: Create a Cross-Tab Chart Topic E: Create Charts for Grouped Data Topic F: Format a Chart Topic G: Create a Chart Template 8 - ENHANCING REPORT FUNCTIONALITY Topic A: Organize Data Based on a Hierarchy Topic B: Create a Dynamic Image Topic C: Create a Report Alert Topic D: Create a Geographic Map 9 - APPENDIX Appendix A: Managing Reports Appendix B: Processing Data on the Server Appendix C: Detecting and Fixing Problems

Market Research Analyst Advanced Diploma - 8 Courses Bundle
By NextGen Learning
Are you ready to embark on an enlightening journey of wisdom with the Market Research Analyst bundle and pave your way to an enriched personal and professional future? If so, then Step into a world of knowledge with our course bundle - Market Research Analyst Advanced Diploma. Delve into eight immersive CPD Accredited courses, each a standalone course: Course 01: Marketing Principles Course 02: Marketing Secrets for High Sales Course 03: Marketing Strategies for Business Course 04: Learn with Case Study - Market Research Course 05: Research Methods in Business Course 06: Business Intelligence Analyst Course Course 07: Excel at Marketing Through a Well-Defined Marketing Strategy Course 08: Sales Analysis in Excel Traverse the vast landscapes of theory, unlocking new dimensions of understanding at every turn. Let the Market Research Analyst Advanced Diploma bundle illuminate your path to wisdom. The Market Research Analyst Advanced Diploma bundle offers a comprehensive exploration into a rich tapestry of vast knowledge across eight carefully curated courses. The journey is designed to enhance your understanding and critical thinking skills. Each course within the bundle provides a deep dive into complex theories, principles, and frameworks, allowing you to delve into the nuances of the subject matter at your own pace. In the framework of the Market Research Analyst Advanced Diploma package, you are bestowed with complimentary PDF certificates for all the courses included in this bundle, all without any additional charge. Adorn yourself with the Market Research Analyst bundle, empowering you to traverse your career trajectory or personal growth journey with self-assurance. Register today and ignite the spark of your professional advancement! So, don't wait further and join the Market Research Analyst Advanced Diploma community today and let your voyage of discovery begin! Learning Outcomes: Attain a holistic understanding in the designated areas of study with the Market Research Analyst bundle. Establish robust bases across each course nestled within the Market Research Analyst bundle. Decipher intricate concepts through the articulate content of the Market Research Analyst bundle. Amplify your prowess in interpreting, scrutinising, and implementing theories. Procure the capacity to engage with the course material on an intellectual and profound level. Become proficient in the art of problem-solving across various disciplines. Stepping into the Market Research Analyst bundle is akin to entering a world overflowing with deep theoretical wisdom. Each course within this distinctive bundle is an individual journey, meticulously crafted to untangle the complex web of theories, principles, and frameworks. Learners are inspired to explore, question, and absorb, thus enhancing their understanding and honing their critical thinking skills. Each course invites a personal and profoundly enlightening interaction with knowledge. The Market Research Analyst bundle shines in its capacity to cater to a wide range of learning needs and lifestyles. It gives learners the freedom to learn at their own pace, forging a unique path of discovery. More than just an educational journey, the Market Research Analyst bundle fosters personal growth, enabling learners to skillfully navigate the complexities of the world. The Market Research Analyst bundle also illuminates the route to a rewarding career. The theoretical insight acquired through this bundle forms a strong foundation for various career opportunities, from academia and research to consultancy and programme management. The profound understanding fostered by the Market Research Analyst bundle allows learners to make meaningful contributions to their chosen fields. Embark on the Market Research Analyst journey and let knowledge guide you towards a brighter future. CPD 80 CPD hours / points Accredited by CPD Quality Standards Who is this course for? Individuals keen on deepening their firm understanding in the respective fields. Students pursuing higher education looking for comprehensive theory modules. Professionals seeking to refresh or enhance their knowledge. Anyone with a thirst for knowledge and a passion for continuous learning. Career path Armed with the Market Research Analyst bundle, your professional journey can reach new heights. The comprehensive theoretical knowledge from this bundle can unlock diverse career opportunities across several fields. Whether it's academic research, consultancy, or programme management, the Market Research Analyst bundle lays a solid groundwork. Certificates CPD Certificate Of Completion Digital certificate - Included 8 Digital Certificates Are Included With This Bundle CPD Quality Standard Hardcopy Certificate (FREE UK Delivery) Hard copy certificate - £9.99 Hardcopy Transcript - £9.99

This course covers the essential Excel data skills. Our course is interactive, instructor-led. This Excel Data course is on offered on intermediate level of Excel and concentrates on the Data Analytical capabilities of Excel. These concepts are daily used by data analysts and is a basic essential skill for data professionals. By the end, you'll be able to use Excel for analytics, data summaries, trends and statistics. You will create Excel data analytical spreadsheets and samples that you can use as examples at work.

B6259 IBM Cognos Analytics - Author Reports Advanced V11.1.x
By Nexus Human
Duration 2 Days 12 CPD hours This course is intended for Authors Overview Please refer to course overview This course teaches experienced authors advanced report building techniques to enhance, customize, manage, and distribute reports. Additionally, the student will learn how to create highly interactive and engaging reports that can be run offline by creating Active Reports. Create query models Build a query and connect it to a report Answer a business question by referencing data in a separate query Create reports based on query relationships Create join relationships between queries Combine data containers based on relationships from different queries Create a report comparing the percentage of change Introduction to dimensional reporting concepts Examine data sources and model types Describe the dimensional approach to queries Apply report authoring styles Introduction to dimensional data in reports Use members to create reports Identify sets and tuples in reports Use query calculations and set definitions Dimensional report context Examine dimensional report members Examine dimensional report measures Use the default measure to create a summarized column in a report Focus your dimensional data Focus your report by excluding members of a defined set Compare the use of the filter() function to a detail filter Filter dimensional data using slicers Calculations and dimensional functions Examine dimensional functions Show totals and exclude members Create a percent of base calculation Create advanced dynamic reports Use query macros Control report output using a query macro Create a dynamic growth report Create a report that displays summary data before detailed data and uses singletons to summarize information Design effective prompts Create a prompt that allows users to select conditional formatting values Create a prompt that provides users a choice between different filters Create a prompt to let users choose a column sort order Create a prompt to let users select a display type Examine the report specification Examine report specification flow Identify considerations when modifying report specifications Customize reporting objects Distribute reports Burst a report to email recipients by using a data item Burst a list report to the IBM Cognos Analytics portal by using a burst table Burst a crosstab report to the IBM Cognos Analytics portal by using a burst table and a master detail relationship Enhance user interaction with HTML Create interactive reports using HTML Include additional information with tooltips Send emails using links in a report Introduction to IBM Cognos Active Reports Examine Active Report controls and variables Create a simple Active Report using Static and Data-driven controls Change filtering and selection behavior in a report Create interaction between multiple controls and variables Active Report charts and decks Create an Active Report with a Deck Create an Active Report with 11.0 visualizations
B6061 IBM Cognos Analytics - Author Reports with Multidimensional Data (V11.0)
By Nexus Human
Duration 2 Days 12 CPD hours This course is intended for Report authors working with dimensional data sources. Through interactive demonstrations & exercises, participants will learn how to author reports that navigate & manipulate dimensional data structures using the specific dimensional functions & features available in IBM Cognos Analytics. Introduction to Dimensional Concepts Identify different data sources and models Investigate the OLAP dimensional structure Identify dimensional data items and expressions Differentiate the IBM Cognos Analytics query language from SQL and MDX Differentiate relational and dimensional report authoring styles Introduction to Dimensional Data in Reports Work with members Identify sets and tuples in IBM Cognos Analytics Dimensional Report Context Understand the purpose of report context Understand how data is affected by default and root members Focus Your Dimensional Data Compare dimensional queries to relational queries Explain the importance of filtering dimensional queries Evaluate different filtering techniques Filter based on dimensions and members Filter based on measure values Filter using a slicer Calculations & Dimensional Functions Use IBM Cognos Analytics dimensional functions to create sets and tuples Perform arithmetic operations in OLAP queries Identify coercion errors and rules Functions for Navigating Dimesional Hierarchies Navigate dimensional data using family functions Relative Functions Navigate dimensional data using relative functions Navigate dimensional data using relative time functions Advanced Drilling Techniques & Member Sets Understand default drill-up and drill-down functionality Identify cases when you need to override default drilling behavior Configure advanced drilling behavior to support sophisticated use cases Define member sets to support advanced drilling Define member sets to support functions Set Up Drill-Through Reports Navigate from a specific report to a target report Drill down to greater detail and then navigate to target report Navigate between reports created using different data sources End-to-End Workshop Review concepts covered throughout the course
B6159 IBM Cognos Analytics - Author Reports Advanced (v11.0.x)
By Nexus Human
Duration 2 Days 12 CPD hours This course is intended for Report Authors Overview Create query models Create reports based on query relationships Introduction to dimensional data Introduction to dimensional data in reports Dimensional report context Focus your dimensional data Calculations and dimensional functions Create advanced dynamic reports This offering teaches Professional Report Authors about advanced report building techniques using relational data models, dimensional data, and ways of enhancing, customizing, managing, and distributing professional reports. The course builds on topics presented in the Fundamentals course. Activities will illustrate and reinforce key concepts during this learning activity. Create query models Build a query and connect it to a report Answer a business question by referencing data in a separate query Create reports based on query relationships Create join relationships between queries Combine data containers based on relationships from different queries Create a report comparing the percentage of change Introduction to dimensional reporting concepts Examine data sources and model types Describe the dimensional approach to queries Apply report authoring styles Introduction to dimensional data in reports Use members to create reports Identify sets and tuples in reports Use query calculations and set definitions Dimensional report context Examine dimensional report members Examine dimensional report measures Use the default measure to create a summarized column in a report Focus your dimensional data Focus your report by excluding members of a defined set Compare the use of the filter() function to a detail filter Filter dimensional data using slicers Calculations and dimensional functions Examine dimensional functions Show totals and exclude members Create a percent of base calculation Create advanced dynamic reports Use query macros Control report output using a query macro Create a dynamic growth report Create a report that displays summary data before detailed data and uses singletons to summarize information Design effective prompts Create a prompt that allows users to select conditional formatting values Create a prompt that provides users a choice between different filters Create a prompt to let users choose a column sort order Create a prompt to let users select a display type Examine the report specification Examine report specification flow Identify considerations when modifying report specifications Customize reporting objects Distribute reports Burst a report to email recipients by using a data item Burst a list report to the IBM Cognos Analytics portal by using a burst table Burst a crosstab report to the IBM Cognos Analytics portal by using a burst table and a master detail relationship Enhance user interaction with HTML Create interactive reports using HTML Include additional information with tooltips Send emails using links in a report Introduction to IBM Cognos Active Reports Examine Active Report controls and variables Create a simple Active Report using Static and Data-driven controls Change filtering and selection behavior in a report Create interaction between multiple controls and variables Active Report charts and decks Create an Active Report with a Data deck Use Master detail relationships with Decks Optimize Active Reports Create an Active Report with new visualizations
B6258 IBM Cognos Analytics - Author Reports Fundamentals V11.1.x
By Nexus Human
Duration 3 Days 18 CPD hours This course is intended for Authors Overview Please refer to course overview This course provides authors with an introduction to build reports using Cognos Analytics. Techniques to enhance, customize, and manage reports will be explored. Activities will illustrate and reinforce key concepts during this learning opportunity. What is IBM Cognos Analytics - Reporting The Welcome page Consume report content Interactive filtering Working with reports Dimensionally modeled relational dataUse personal data sources and data modules Upload personal data Upload custom images Using navigation paths in a data module Examine list reports Group data Format columns Include headers and footers Aggregate fact data Identify differences in aggregation Multiple facts and repeated information Use shared dimensions to create multi-fact queries Present repeated information Add repeated information to reports Create a mailing list report Create crosstab reports Add measures to a crosstab Data sources for a crosstab Create complex crosstab reports Add items as peers Create crosstab nodes and crosstab members Work with crosstab data Format, sort, and aggregate a crosstab Create discontinuous crosstab reportsCreate visualization reports Visualization categories Customize visualizations Client side visualizations Enhanced map visualizations Focus reports using filters Create filters to narrow the focus Use advanced detail filters Apply a filter with aggregation Use summary filters Focus reports using prompts Examine parameters and prompts Create a parameter for a report item Add a prompt page Add a prompt item to a report Identify a prompt type Create a cascading prompt Use calculations What are calculations Add Date and Time functions Add string functions Display prompt selections in report titles Customize reports with conditional formatting Three steps for conditional formatting Create a variable Assign the variable to a report object Format based on the conditional value Conditionally render report objects Drill-through definitions Navigate to related data Enhance report layout View the structure of a report Use Guided report layout Force page breaks Create horizontal pagination Modify the report structure Format objects across reports Use additional report-building techniques Enhance a report design Add objects to reports Convert a list to a crosstab Explore reuse Additional course details: Nexus Humans B6258 IBM Cognos Analytics - Author Reports Fundamentals V11.1.x training program is a workshop that presents an invigorating mix of sessions, lessons, and masterclasses meticulously crafted to propel your learning expedition forward. This immersive bootcamp-style experience boasts interactive lectures, hands-on labs, and collaborative hackathons, all strategically designed to fortify fundamental concepts. Guided by seasoned coaches, each session offers priceless insights and practical skills crucial for honing your expertise. Whether you're stepping into the realm of professional skills or a seasoned professional, this comprehensive course ensures you're equipped with the knowledge and prowess necessary for success. While we feel this is the best course for the B6258 IBM Cognos Analytics - Author Reports Fundamentals V11.1.x course and one of our Top 10 we encourage you to read the course outline to make sure it is the right content for you. Additionally, private sessions, closed classes or dedicated events are available both live online and at our training centres in Dublin and London, as well as at your offices anywhere in the UK, Ireland or across EMEA.
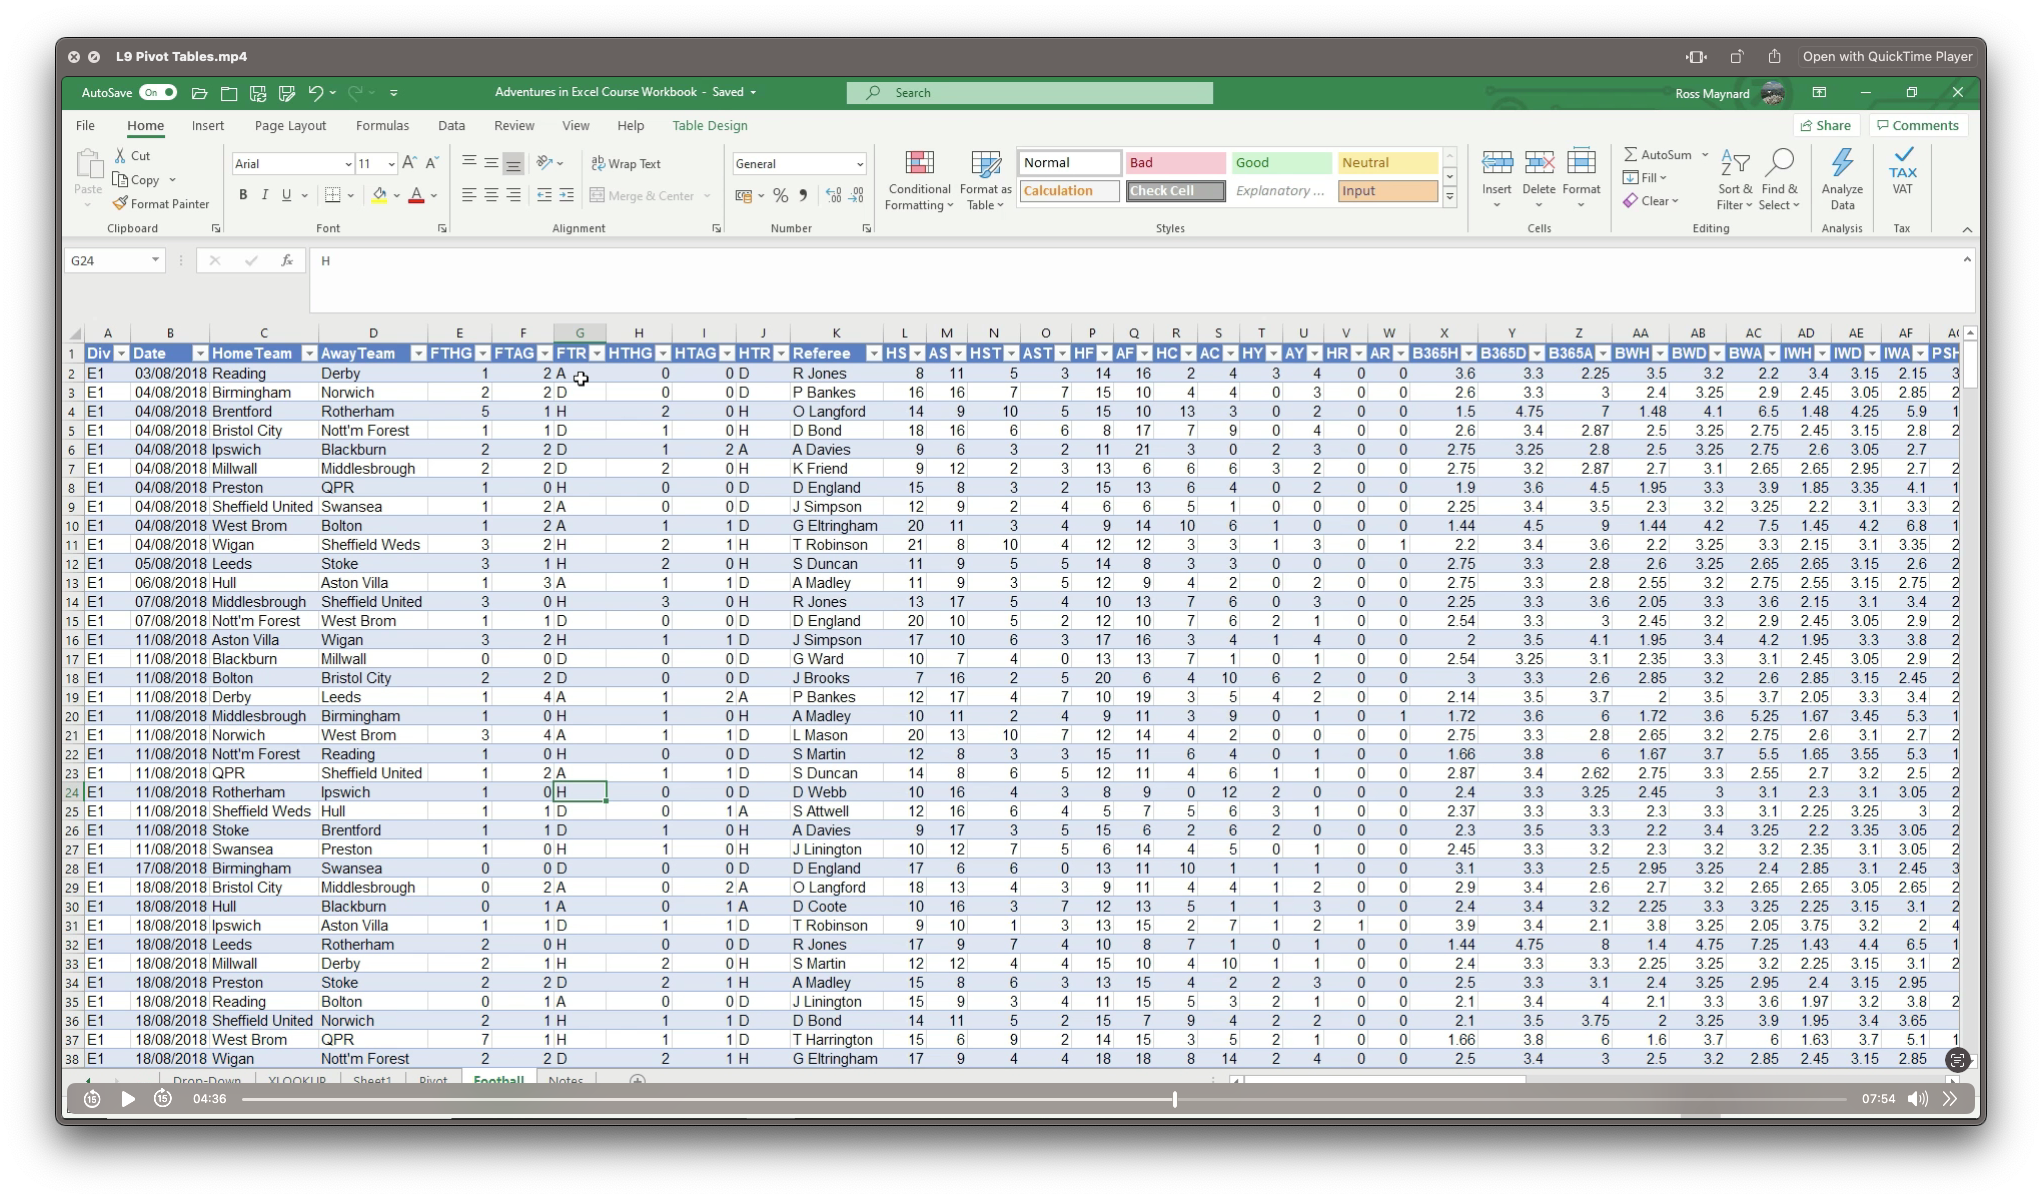
Adventures in Excel
By Ideas Into Action
Description Microsoft Excel has hundreds, if not thousands, of functions and features. This course aims to cover some of the best – that is the ones I find most useful. In “Adventures in Excel”, I cover the simple-to-use but powerful functions that I use most often: Basic features including products and powers Key date functions including the calculation of due dates and days past due Generating random numbers and random dates The new IFS functions (new to Office365) Text functions The most useful logical functions and IS functions How to create a drop-down list The new XLOOKUP function Pivot tables These functions are easy to use, and, unless your role is extremely specialised, they are probably the ones you’ll use 90% of the time. I hope you find the course helpful. Learning Outcomes Participants in this course will learn: Basic Excel functions including SUM, AVERAGE, MIN, MAX, PRODUCT, POWER and SQRT Useful date functions including TODAY, EOMONTH, EDATE, and DAYS Generating random numbers using RAND and RANDBETWEEN; generating random dates; and randomly picking an item from a list or table The new RANDARRAY function in Office365 The new IFS functions in Office365 including AVERAGEIFS, MAXIFS, MINIFS, COUNTIFS, and SUMIFS Text functions including TRIM, LOWER, UPPER, PROPER, LEFT, MID, RIGHT, FIND, TEXTJOIN and CONCATENATE Logical functions AND, OR, and NOT and IS functions ISTEXT, ISNUMBER, ISBLANK and ISERROR How to create a drop-down list The new SORT and FILTER functions in Office365 VLOOKUP and the new XLOOKUP function How to create a Pivot table and analyse data with one Course Requirements There are no pre-course requirements. Additional Resources Course Spreadsheet with the examples covered. About Ross Ross Maynard is a Fellow of the Chartered Institute of Management Accountants in the UK. He is director of Ideas2Action Process Excellence Ltd and has 30 years’ experience as a process improvement consultant and facilitator. Ross is also a professional author of online training courses for accountants. Ross lives in Scotland with his wife, daughter and Cocker Spaniel
Microsoft Excel in Depth
By IIL Europe Ltd
Microsoft Excel® in Depth The goal of this course is to provide a deeper understanding of Excel and its intricacies and a new ability to use it efficiently producing the best solutions for your projects. This practical course provides a solid background of the features of Excel and a deeper understanding of its features, benefits and uses. This is not a beginner's course in Excel. You will learn some advanced features such as Pivot Tables, Charting, Tables, Sorting, Filtering and Functions. The goal of this course is to provide a deeper understanding of Excel and its intricacies and a new ability to use it efficiently producing the best solutions for your projects. What you Will Learn You'll learn how to: Use functions like IF, AVERAGE, SUMIF, SUMIFS, SUMPRODUCT, INDEX, MATCH, CHOOSE, DATE, and many more Create meaningful charts Use pivot tables Use Conditional Formatting, Data Validation Take advantage of using Named ranges, do sorting, filtering, tables Getting Started The building blocks of Excel, built-in functions, will be examined The basics of formatting your data will be examined Shortcuts and data manipulation will be explored Built-in features like those mentioned in the 'What you will learn' section above will be explored in detail Excel Functions - VLOOKUP, IF, INDEX, MATCH, CHOOSE, SUMIF, SUMIFS, SUMPRODUCT, DATE, so many more Using Named ranges, Data Validation, Sorting, and Filtering Learn the Name manager; Learn the difference between local and global names; Ensure correct access to linked workbooks; Ensure data accuracy; Learn how to use cascading data validation (for example, once a user chooses 'cars', another cell allows only Ford, Toyota, etc.); Sorting by more than 3 fields; Filtering by font, pattern, or value; See your data based on things like dates in the 3rd quarter, or fields where quantity x price is greater than some fixed value Conditional formatting and data formatting Make relevant data stand out Isolate highs and lows Make error cells invisible Learn about Data bars, Icon sets, and Color scales Highlight differences between worksheets Learn all the codes in the Format/Number list Using cell Styles Learn all about alignment, protection, borders, colors and more Pivot Tables Learn how to summarize large amounts of data with a few clicks Learn various ways of presenting the data Learn the various pivot table tools Learn how to customize and format a pivot table to suit your needs Learn how to group data Learn how to use the various options to present your data Charts Learn how to create a chart with one keystroke! Learn the 11 types of built-in charts Learn how to create a chart with one keystroke! Learn how to customize the charts to make the information tell the right story Learn how to use the design, layout, and formatting available to charts in Excel 2007 Learn embedded charts versus chart sheets Learn how to use modify all the pieces of a chart Array formulas Learn how to use the most powerful formulas in Excel Learn how to combine many formulas into one compact array-formula Learn the real power of these formulas and why regular formulas can't do the job Learn how to use built-in array formulas, like TREND or TRANSPOSE
