- Professional Development
- Medicine & Nursing
- Arts & Crafts
- Health & Wellbeing
- Personal Development
75 Excel Analytics courses in Cardiff delivered On Demand
From business to research, having a solid grasp of Excel Data analysis can open doors of opportunity in various industries. Learn this valuable skill set from the comfort of your home with the Data Analysis In Excel course. This course will introduce you to the ins and outs of Excel data analysis. This Data Analysis In Excel course will help you establish a solid foundation in Excel data analysis. This course will help you pick up the skills to visualise data with charts in Excel. Here, you will also learn about Pivot Tables and Charts. Furthermore, the course will teach you how to work with multiple Workbooks. In addition, you will learn about Lookup factions and how to use them. By the end of this course, you will know the essentials of automating Workbook functionality. This course will assist you in securing effective data analysis skills. In addition, you will receive a QLS-endorsed certificate of achievement. This certificate will enhance your employability in the relevant job market. Join now! Learning Outcomes Understand the basic principles of data analysis with Excel Learn how to visualise data with Excel charts Build your expertise in using Pivot Tables and Charts Grasp the techniques of working with multiple Worksheets and Workbooks Know the process of automating Workbook functionality Certificate of Achievement Endorsed Certificate of Achievement from the Quality Licence Scheme Upon successful completion of the final assessment, you will be eligible to apply for the Quality Licence Scheme Endorsed Certificate of achievement. This certificate will be delivered to your doorstep through the post for £99. An extra £10 postage charge will be required for students leaving overseas. CPD Accredited Certificate After the successful completion of the final assessment, you will receive a CPD-accredited certificate of achievement. The PDF certificate is for 9.99, and it will be sent to you immediately after through e-mail. You can get the hard copy for 15.99, which will reach your doorsteps by post. Method of Assessment At the end of the course, there will be an MCQ assessment. In order to pass this exam, you must score at least 60%. When you submit the assessment, it will be examined, and the results will be given to you immediately. Career path This course is designed to help you extant your knowledge and understanding of this sector. After completing the course, you will be able to explore career options such as Data Analyst Research Assistant Researcher Business Analyst

Build HR Dashboard using Excel Course
By One Education
Numbers tell stories—but only if you know how to read them. This course is designed to guide learners through the fine art of building HR dashboards using Excel, helping you turn columns and cells into clear, strategic insights. Whether you're navigating headcount data, analysing attrition, or tracking recruitment pipelines, you’ll gain the structured knowledge to bring clarity to the chaos of workforce figures. No fluffy jargon or corporate riddles—just solid Excel techniques that speak directly to HR needs. Through well-organised lessons, you'll explore how to compile, format, and visualise essential HR data in a way that even senior leadership won’t scroll past. From pivot tables to conditional formatting and dynamic charts, this course will help you create dashboards that don’t just look good, but actually mean something. If you're in HR and Excel is your daily battleground, this course will teach you how to build dashboards that do the talking for you—neatly, clearly, and without needing a 50-slide presentation. Learning Outcomes: Develop an understanding of the principles and practices of HR dashboard analysis using Excel Learn effective strategies for index and tab designing, MOM headcount, and employee compensation front face Develop analytical skills for departmental and location analysis, tenure wise analysis, and job rating analysis Understand how to utilize Excel to gain insights on complex HR data sets Be able to make informed decisions and navigate the complex and dynamic world of HR analytics using Excel The "Build HR Dashboard using Excel" course is designed to provide a comprehensive understanding of the principles and practices that underpin successful HR dashboard analysis using Excel. Through engaging modules and real-world case studies, learners will gain insights into effective strategies for index and tab designing, MOM headcount, employee compensation frontface, departmental and location analysis, tenure wise analysis, and job rating analysis. By the end of the course, learners will be equipped with the knowledge and skills to make informed decisions and navigate the complex and dynamic world of HR analytics using Excel. Whether you're an HR professional looking to enhance your skills or a beginner looking to enter the world of HR analytics, this course is a must-have for anyone interested in building a comprehensive HR dashboard using Excel. Build HR Dashboard using Excel Course Curriculum Section 01: Introduction Section 02: Data Introduction Section 03: Index Design and Tab Designing Section 04: Employee Frontface Section 05: Pivot Data List Section 06: MOM Headcount Section 07: Departmental and Location Analysis Section 08: Tenure wise Analysis Section 09: Age wise Analysis Section 10: Emp Demo and Quality Circles Section 11: Time Sheet Late Marks Analysis Section 12: Full and Final Analysis Section 13: Training Analysis Section 14: Employee Compensation Frontface Section 15: Job Rating Analysis Section 16: HR Update Section 17: Conclusion How is the course assessed? Upon completing an online module, you will immediately be given access to a specifically crafted MCQ test. For each test, the pass mark will be set to 60%. Exam & Retakes: It is to inform our learners that the initial exam for this online course is provided at no additional cost. In the event of needing a retake, a nominal fee of £9.99 will be applicable. Certification Upon successful completion of the assessment procedure, learners can obtain their certification by placing an order and remitting a fee of __ GBP. £9 for PDF Certificate and £15 for the Hardcopy Certificate within the UK ( An additional £10 postal charge will be applicable for international delivery). CPD 10 CPD hours / points Accredited by CPD Quality Standards Who is this course for? HR professionals looking to enhance their data analysis skills using Excel Beginners interested in the world of HR dashboard analysis using Excel Business students interested in the field of HR analytics using Excel Entrepreneurs looking to incorporate data analysis into their HR practices using Excel Anyone interested in gaining a comprehensive understanding of HR analytics using Excel Career path HR Analyst: £25,000 - £50,000 per year HR Manager: £35,000 - £70,000 per year HR Business Partner: £35,000 - £90,000 per year HR Director: £70,000 - £150,000 per year Chief Human Resources Officer (CHRO): £100,000 - £250,000+ per year Certificates Certificate of completion Digital certificate - £9 You can apply for a CPD Accredited PDF Certificate at the cost of £9. Certificate of completion Hard copy certificate - £15 Hard copy can be sent to you via post at the expense of £15.

Data Analysis with Excel
By Compliance Central
Are you looking to enhance your Data Analysis with Excel skills? If yes, then you have come to the right place. Our comprehensive course on Data Analysis with Excel will assist you in producing the best possible outcome by mastering the Data Analysis with Excel skills. The Data Analysis with Excel is for those who want to be successful. In the Data Analysis with Excel, you will learn the essential knowledge needed to become well versed in Data Analysis with Excel. Our Data Analysis with Excel starts with the basics of Data Analysis with Excel and gradually progresses towards advanced topics. Therefore, each lesson of this Data Analysis with Excel is intuitive and easy to understand. Why would you choose the Data Analysis with Excel from Compliance Central: Lifetime access to Data Analysis with Excel materials Full tutor support is available from Monday to Friday with the Data Analysis with Excel Learn Data Analysis with Excel skills at your own pace from the comfort of your home Gain a complete understanding of Data Analysis with Excel Accessible, informative Data Analysis with Excel learning modules designed by expert instructors Get 24/7 help or advice from our email and live chat teams with the Data Analysis with Excel bundle Study Data Analysis with Excel in your own time through your computer, tablet or mobile device. A 100% learning satisfaction guarantee with your Data Analysis with Excel Improve your chance of gaining in demand skills and better earning potential by completing the Data Analysis with Excel Data Analysis with Excel Curriculum Breakdown of the Data Analysis with Excel Modifying a Worksheet Insert, Delete, and Adjust Cells, Columns, and Rows Search for and Replace Data Use Proofing and Research Tools Working with Lists Sort Data Filter Data Query Data with Database Functions Outline and Subtotal Data Analyzing Data Apply Intermediate Conditional Formatting Apply Advanced Conditional Formatting Visualizing Data with Charts Create Charts Modify and Format Charts Use Advanced Chart Features Using PivotTables and PivotCharts Create a PivotTable Analyze PivotTable Data Present Data with PivotCharts Filter Data by Using Timelines and Slicers Working with Multiple Worksheets and Workbooks Use Links and External References Use 3-D References Consolidate Data Using Lookup Functions and Formula Auditing Use Lookup Functions Trace Cells Watch and Evaluate Formulas Automating Workbook Functionality Apply Data Validation Search for Invalid Data and Formulas with Errors Work with Macros Creating Sparklines and Mapping Data Create Sparklines MapData Forecasting Data Determine Potential Outcomes Using Data Tables Determine Potential Outcomes Using Scenarios Use the Goal Seek Feature Forecasting Data Trends CPD 10 CPD hours / points Accredited by CPD Quality Standards Who is this course for? The Data Analysis with Excel helps aspiring professionals who want to obtain the knowledge and familiarise themselves with the skillsets to pursue a career in Data Analysis with Excel. It is also great for professionals who are already working in Data Analysis with Excel and want to get promoted at work. Requirements To enrol in this Data Analysis with Excel, all you need is a basic understanding of the English Language and an internet connection. Career path The Data Analysis with Excel will enhance your knowledge and improve your confidence in exploring opportunities in various sectors related to Data Analysis with Excel. Certificates CPD Accredited PDF Certificate Digital certificate - Included CPD Accredited PDF Certificate CPD Accredited Hard Copy Certificate Hard copy certificate - £10.79 CPD Accredited Hard Copy Certificate Delivery Charge: Inside the UK: Free Outside of the UK: £9.99

Power Query and Power Pivot in Microsoft Excel: A Quickstart Guide
By Ideas Into Action
Power Query and Power Pivot in Microsoft Excel: A Quickstart Guide Course Description Copyright Ross Maynard 2022 Course Description Power Query and Power Pivot are two tools available in Microsoft Excel. If you are serious about data analysis, then you need to know how to use these tools. This Quickstart guide will give you the skills you need to get started with these powerful features. The Power Query tool allows you to import external data and then modify it to meet your needs, before loading it into Excel. These editing tasks are all things you can do manually in Excel, but Power Query greatly speeds things up when you have a large volume of data. The Power Pivot tool allows you to connect multiple data tables in an extended pivot table. Power Pivot also introduces new analysis and query tools to further enhance data analysis. If data analysis is your thing, then this course will help you get up to speed with these feature-filled tools. Through screen-capture video, the course provides a step-by-step guide to the foundation skills needed to use both Power Query and Power Pivot effectively. The course is designed to make your first steps into Power Query easy and to build your confidence to use them on your own. Both Power Query and Power Pivot are also available in Microsoft Power BI – the data visualisation suite. Once you have learned how to use Power Query and Power Pivot in Excel with this course, you’ll have a head start in getting to grips with Power BI Get up to speed with Power Query and Power Pivot in Microsoft Excel with this Quickstart guide. Key Learning Points On completion of the course, delegates will be able to: Use Power Query to load data from an external source into Microsoft Excel Clean and manipulate external data before loading it into Excel Consolidate separate files with Power Query Update Excel tables with new data in the same format Use Power Query to “unpivot” report tables to prepare the data for analysis Explain the core functionality of Power Pivot Link data tables together in the Power Pivot data model Create pivot tables that draw data from several source data tables Create performance measures and new analysis in the Power Pivot data model Use the most popular DAX query language functions in Power Pivot Curriculum Lesson 1: Power Query Quickstart Lesson 2: Consolidating Files with Power Query Lesson 3: Unpivoting a Table Lesson 4: Power Pivot Quickstart Lesson 5: Power Pivot – Adding Data and Functionality Lesson 6: Key DAX Functions for Power Pivot Lesson 7: The DAX CALCULATE Function Lesson 8: Key Learning Points Pre-Course Requirements There are no pre-course requirements Additional Resources Starter spreadsheets for each lesson are provided so that learners can follow the steps presented. Course Tutor Your tutor is Ross Maynard. Ross is a Fellow of the Chartered Institute of Management Accountants in the UK and has 30 years’ experience as a process improvement consultant specialising in business processes and organisation development. Ross is also a professional author of online training courses. Ross lives in Scotland with his wife, daughter and Cocker Spaniel Questions What is the main feature of Power Query? The ability to link data tables together to create pivot tables that allow data to be drawn from any and all of the source tables The ability to clean and manipulate large volumes of external data efficiently and to load the result into Microsoft Excel The removal of Microsoft Excel’s restrictions on file sizes and the number of rows of data allowed The ability to visualise data in dashboards and management reports What is the main feature of Power Pivot? The ability to link data tables together to create pivot tables that allow data to be drawn from any and all of the source tables The ability to clean and manipulate large volumes of external data efficiently and to load the result into Microsoft Excel The removal of Microsoft Excel’s restrictions on file sizes and the number of rows of data allowed The ability to visualise data in dashboards and management reports Which of the following actions cannot be performed within Power Query? Split text into multiple columns Trimming text and removing spaces Creating calculated columns using DAX functions Make date based calculations Which of the following statements is true? You can use Power Query to combine files that have the same format and open them all in the same spreadsheet You can use Power Query to link data tables and create pivot tables that pull data items from all the linked tables You can use Power Query to create interactive dashboard reports You can use Power Query to export data files to Microsoft Access and other databases Which of the following provides a compelling case to use Power Pivot in Microsoft Excel? The data visualisation and presentation features of Power Pivot are much more powerful than those in Excel Power Pivot offers the ability to clean large files of data imported from other systems quickly Existing reports and tables can be “reverse engineered” (unpivoted) to create data tables for more advanced analysis Files sizes in Power Pivot are smaller than in Excel and there is no limit on the number of rows of data that can be stored. This makes it much faster and more efficient to use Power Pivot for large data sets Power Pivot uses analysis functions from the DAX formula language. What does “DAX” stand for? Digital Architecture Extraction Data Arbitrage Extrapolation Display Analytics Extension Data Analysis Expressions Deeply Annoying Exercise The DAX CALCULATE function is one of the most powerful and useful functions available in Power Pivot. Which statement best describes it? It performs row by row calculations defined by the user and adds the total of them all together for a specified table It performs row by row calculations defined by the user and displays the maximum result for a specified table It performs a defined calculation and then applies filters specified by the user It filters the data in a specified table according to criteria set by the user As well as in Power Pivot in Microsoft Excel, in what application are DAX functions also available? Microsoft PowerPoint Microsoft Forms Microsoft Teams Microsoft Power BI How do DAX functions differ from Microsoft Excel functions? DAX functions are designed specifically for use with SQL based data sources DAX functions are completely new and provide additional functionality within Microsoft Excel DAX functions never take a cell reference or a range as reference, but instead take a column or table as reference DAX date and time functions return a date as a serial number, whereas Excel date and time functions return a datetime data type
Microsoft Excel
By IOMH - Institute of Mental Health
Join our Microsoft Excel course and discover your hidden skills, setting you on a path to success in this area. Get ready to improve your skills and achieve your biggest goals. The Microsoft Excel course has everything you need to get a great start in this sector. Improving and moving forward is key to getting ahead personally. The Microsoft Excel course is designed to teach you the important stuff quickly and well, helping you to get off to a great start in the field. So, what are you looking for? Enrol now! You will Learn The Following Things: Learn strategies to boost your workplace efficiency. Hone your skills to help you advance your career. Acquire a comprehensive understanding of various topics and tips. Learn in-demand skills that are in high demand among UK employers This course covers the topic you must know to stand against the tough competition. The future is truly yours to seize with this Microsoft Excel. Enrol today and complete the course to achieve a certificate that can change your career forever. Details Perks of Learning with IOMH One-to-one support from a dedicated tutor throughout your course. Study online - whenever and wherever you want. Instant Digital/ PDF certificate 100% money back guarantee 12 months access Process of Evaluation After studying the course, an MCQ exam or assignment will test your skills and knowledge. You have to get a score of 60% to pass the test and get your certificate. Certificate of Achievement After completing the Microsoft Excel course, you will receive your CPD-accredited Digital/PDF Certificate for £5.99. To get the hardcopy certificate for £12.99, you must also pay the shipping charge of just £3.99 (UK) and £10.99 (International). Who Is This Course for? This Microsoft Excel is suitable for anyone aspiring to start a career in relevant field; even if you are new to this and have no prior knowledge, this course is going to be very easy for you to understand. On the other hand, if you are already working in this sector, this course will be a great source of knowledge for you to improve your existing skills and take them to the next level. This course has been developed with maximum flexibility and accessibility, making it ideal for people who don't have the time to devote to traditional education. Requirements There is no prerequisite to enrol in this course. You don't need any educational qualification or experience to enrol in the Microsoft Excel course. Do note: you must be at least 16 years old to enrol. Any internet-connected device, such as a computer, tablet, or smartphone, can access this online course. Career Path The certification and skills you get from this Microsoft Excel Course can help you advance your career and gain expertise in several fields, allowing you to apply for high-paying jobs in related sectors. Course Curriculum Unit 01: Excel from A-Z Course Introduction Excel from A-Z Course Intro 00:03:00 Excel Job Opportunities 00:03:00 Excel Job Types 00:04:00 Microsoft Excel Marketplace 00:04:00 What is Microsoft Excel? 00:04:00 Who is This Course For? 00:03:00 Unit 02: Getting Started With Excel Finding & Opening Excel 00:01:00 Excel's Start Screen 00:03:00 Explaining the Excel Interface 00:03:00 Excel Interface Continued 00:01:00 Excel Workbook vs. Excel Worksheet 00:02:00 Saving an Excel Document 00:04:00 Customizing the Quick Access Toolbar 00:02:00 Customizing the Excel Ribbon 00:03:00 Excel Shortcut Keys 00:02:00 Unit 03: Values, Referencing and Formulas Creating Excel Labels 00:03:00 Entering Numeric Values in Excel 00:03:00 Formatting Date Values in Excel 00:05:00 Building Basic Formulas in Excel 00:05:00 Order of Operations 00:06:00 Relative vs. Absolute Cell References 00:07:00 Unit 04: Intro to Excel Functions Excel Functions Explained 00:03:00 The SUM() Function 00:08:00 The MIN() & MAX() Function 00:04:00 The AVERAGE() Function 00:02:00 COUNT() Functions 00:05:00 Unit 05: Adjusting Excel Worksheets Moving & Copying Data 00:07:00 Insert & Delete Rows and Columns 00:05:00 Adjusting the Width and Height of Cells 00:05:00 Hiding and Unhiding Excel Rows and Columns 00:04:00 Renaming, Moving & Deleting Excel Worksheets 00:05:00 Adding Protection to Specific Cells 00:04:00 Protecting the Structure of a Workbook 00:02:00 Adding a Workbook Password to Open File 00:02:00 Unit 06: Visually Pleasing Cell Formatting Formatting Fonts and Cell Background Color 00:05:00 Adding Cell Borders 00:05:00 Formatting Data Appropriately 00:05:00 The Magic behind Excel's Format Painter 00:03:00 Creating Styles for Formatting Efficiency 00:06:00 Merging Cells for a Cleaner Look 00:03:00 The Power of Conditional Formatting 00:06:00 Unit 07: How to Insert Images and Shapes! Grab User's Attention using Illustrations 00:09:00 Customizing Icons 00:05:00 Create Compelling Graphics with SmartArt 00:06:00 Unit 08: Visualize Data with Charts The Commonly Used Column Chart 00:03:00 Changing the Chart Design.mp4 00:02:00 Formatting Elements of a Chart 00:06:00 Modifying the Data, Type & Location of a Chart 00:06:00 Unit 09: Excel's Printing Options Print Preview Options 00:04:00 Excel's Page Layout View 00:07:00 Printing a Specific Range of Cells 00:03:00 Converting Spreadsheets to PDF Files 00:02:00 Unit 10: Benefits of Using Excel Templates Why Create an Excel Template 00:01:00 How to Create an Excel Template 00:05:00 Unit 11: Working with Excel Datasets How to Prepare Data for Analysis 00:04:00 How to Sort Data in Excel 00:03:00 Multi-Level Sorting 00:03:00 Custom Sorting Datasets in Excel 00:02:00 Applying Filters to Datasets 00:05:00 Creating Subtotals within a Dataset 00:06:00 Converting Datasets into Tables 00:06:00 Little Slice of Pie Charts 00:05:00 Finding & Removing Duplicate Values 00:07:00 Unit 12: Excel Database Functions The SUMIF() Function 00:09:00 The DSUM() Function 00:08:00 The DSUM() Function Cont. 00:07:00 The SUBTOTAL() Function 00:06:00 Unit 13: Excel Data Validation What is Excel Data Validation? 00:02:00 Creating a Drop Down List with Data Validation 00:07:00 Different Types of Excel Data Validation 00:06:00 Adding Custom Alerts to Data Validation 00:07:00 Creating a Dynamic Drop Down List 00:03:00 Complex Validation: Dependent Drop Down List! 00:09:00 Unit 14: Excel PivotTables Creating an Excel Pivot Table 00:06:00 Modifying Excel PivotTables 00:06:00 Grouping & Filtering PivotTable Data 00:06:00 Drilling Down into PivotTable Data 00:02:00 Creating Pivot Charts & Utilizing Slicers 00:08:00 Unit 15: Excel's PowerPivot Add-In What is PowerPivot? 00:04:00 Activating the Excel PowerPivot Add-In 00:02:00 Creating Relationships between Data Tables.mp4 00:06:00 Using Data Models to Create PivotTables 00:05:00 How to Create PowerPivot KPI's 00:08:00 Unit 16: Excel's Conditional Functions Excels IF Function 00:05:00 IF() Function with AND() Criteria 00:05:00 IF() Function with OR() Criteria 00:05:00 Nesting Multiple IF() Functions 00:07:00 The COUNTIF() Function 00:04:00 Key Benefits of Named Ranges 00:04:00 Unit 17: Excel's Lookup Function VLOOKUP() Function 00:09:00 The Beauty of Excel's IFERROR() Function 00:04:00 HLOOKUP() Function 00:06:00 The INDEX Function 00:05:00 MATCH() Function 00:05:00 INDEX() and MATCH() Combined 00:05:00 Two-Way Lookup with INDEX() and MATCH() 00:04:00 Unit 18: Text Based Functions in Excel LEFT(), RIGHT() and MID() Function 00:07:00 Extracting Specific Text using LEN() & SEARCH() 00:13:00 Combining Text with CONCATENATE() 00:06:00 Quick Tips & Other Text Based Functions 00:06:00 Unit 19: Auditing Formulas and Views in Excel Tracing Precedents & Dependents in Formulas 00:04:00 Showing Formulas 00:02:00 Grouping Data 00:03:00 3D Referencing in Formulas 00:05:00 Utilizing the Watch Window in Excel 00:03:00 How to Freeze Panes in Excel 00:03:00 Unit 20: Excel's 'what If?' Tools Excel's Scenario Manager Tool 00:06:00 Goal Seek in Excel 00:06:00 Compare Results with Excel Data Tables 00:04:00 Solver Tool 00:11:00 Unit 21: Welcome to Excel VBA The Power Behind Excel VBA 00:03:00 A Look Inside the Visual Basic Editor (VBE) 00:04:00 Recording a Macro 00:09:00 Saving & Opening a Macro-Enabled Workbook 00:02:00 Unit 22: The VBA Language Modules and Procedures 00:07:00 Objects, Methods and Properties 00:06:00 Excel VBA Variables 00:05:00 Unit 23: Writing VBA Code Referencing a Range 00:13:00 InputBox & MsgBox 00:06:00 Using Variables in VBA Code 00:05:00 If Then Else Statement 00:10:00 Worksheet Functions inside VBA 00:08:00 Creating User Defined Functions 00:09:00 User Defined Functions within VBA Scripts 00:06:00 Unit 24: Important VBA Tools and Logic Find Last Row of Data 00:06:00 Find Last Column of Data 00:03:00 With Statement 00:05:00 Debugging & Error Handling 00:07:00 Debugging & Error Handling Cont. 00:07:00 Unit 25: Excel VBA Loop For Next Loop 00:09:00 Do Until Loop 00:06:00 For Each Loop 00:04:00 Unit 26: Triggering Macros Assigning Macros to Shapes 00:04:00 Form Controls vs ActiveX Controls 00:08:00 Worksheet Events 00:04:00 Workbook Events 00:03:00 Fun with VBA Events! 00:07:00 Unit 27: Excel User Forms Creating an Excel UserForm 00:03:00 Adding Controls to UserForms 00:10:00 How to Show an UserForm 00:03:00 Passing TextBox Values to Desired Cells 00:07:00 Passing Option Buttons to Desired Cells 00:07:00 UserForm ComboBoxes 00:08:00 Clearing Values from UserForm Controls 00:03:00 How to Close an UserForm 00:02:00 UserForms and Protected Sheets 00:05:00 Unit 28: Starting a Career in Excel Creating an Excel Resume 00:05:00 Getting Started with Freelancing 00:06:00 How to Become an Excel Freelancer 00:05:00 Top Freelance Websites 00:05:00 How to Get Your First Client 00:08:00 Personal Branding 00:07:00 Networking Do's and Don'ts 00:04:00 Importance of Having a Website 00:04:00 Resources Resources - Microsoft Excel 00:00:00
Microsoft Excel Mastery with SQL, Data Analysis, Financial Modelling - 8 Courses Bundle
By NextGen Learning
Have you ever wondered how businesses transform raw data into actionable insights or how financial analysts accurately pinpoint market trends? Microsoft Excel stands tall as the fulcrum that balances numerous sectors of the business world. This 8-course Microsoft Excel Mastery: AutoCAD, SQL, Data Analysis, Financial Modelling & Marketing bundle dives deep into the myriad applications of Microsoft Excel, from interfacing with AutoCAD to crafting marketing strategies and comprehensive financial models. In an era defined by data-driven decisions, this 8-course Microsoft Excel Mastery: AutoCAD, SQL, Data Analysis, Financial Modelling & Marketing bundle is tailored to equip learners with the multifaceted applications of Microsoft Excel. Ranging from foundational Excel operations to advanced integrations with tools like AutoCAD and MySQL, the course bundle aims to foster expertise in data management, analysis, and visualisation. Whether you're venturing into financial modelling, HR analytics, or design integration, this bundle serves as a comprehensive guide to mastering Excel in diverse professional realms, ensuring you are well-prepared to leverage its capabilities in the modern workplace. Ready to excel in your career? Embrace the transformative power of data and design by mastering Microsoft Excel with our comprehensive course bundle. Dive in now and shape your future with unparalleled proficiency! The Eight CPD Accredited courses that the bundle includes are: Course 1: Microsoft Excel Course for Everyone - Complete Excel Course Course 2: Excel VBA/Macros Foundations Course 3: Dynamic Excel Gantt Chart and Timelines Course 4: Hands on Programming on AutoCAD to Excel Using VB.NET Course 5: Learn MySQL from Scratch for Data Science and Analytics Course 6: Data Analytics Course 7: Build HR Dashboard using Excel Course 8: Financial Modelling Using Excel Learning Outcomes: Gain comprehensive knowledge and understanding of Microsoft Excel and its vast capabilities. Understand the seamless integration between Excel and tools like AutoCAD and MySQL. Develop proficiency in creating intricate financial models and marketing strategies. Acquire skills to analyse data, forecast trends, and build informative dashboards. Learn the principles of personal finance management using Excel. Master the art of crafting Gantt charts and timelines for effective project management. Microsoft Excel Course for Everyone - Complete Excel Course: Acquaint yourself with the foundational and advanced facets of Microsoft Excel, fostering data management expertise. Excel VBA/Macros Foundations: Dive into the transformative world of VBA, unlocking Excel's programming potentials. Dynamic Excel Gantt Chart and Timelines: Grasp the essentials of project management by designing insightful Gantt charts and timelines in Excel. Hands on Programming on AutoCAD to Excel Using VB.NET: Bridge the realms of design and data by merging AutoCAD functionalities with Microsoft Excel's prowess. Learn MySQL from Scratch for Data Science and Analytics: Understand the confluence of Excel and MySQL, anchoring data science and analytics. Data Analytics: Master the techniques of transforming raw numbers into actionable insights using Microsoft Excel. Build HR Dashboard using Excel: Curate informative HR dashboards, offering a snapshot of organisational metrics, all within Excel. Financial Modelling Using Excel: Unravel the intricacies of financial markets, crafting accurate models in Microsoft Excel. CPD 90 CPD hours / points Accredited by CPD Quality Standards Who is this course for? Individuals keen on enhancing their Microsoft Excel skills for professional or personal reasons. Marketing professionals aiming to refine their strategic planning with Excel. Financial analysts and enthusiasts looking to build and understand models in Excel. Data scientists and analysts desire to integrate Excel with tools like MySQL. Design engineers and architects keen on integrating AutoCAD designs with Excel data. Career path Data Analyst Financial Modeller Marketing Strategist HR Dashboard Specialist Database Administrator (with Excel integration knowledge) Project Manager (familiar with Gantt and timelines in Excel) Design Engineer using Excel with AutoCAD Certificates CPD Certificate Of Completion Digital certificate - Included 8 Digital Certificates Are Included With This Bundle CPD Quality Standard Hardcopy Certificate (FREE UK Delivery) Hard copy certificate - £9.99 Hardcopy Transcript: £9.99

Market Research Analyst Advanced Diploma - 8 Courses Bundle
By NextGen Learning
Are you ready to embark on an enlightening journey of wisdom with the Market Research Analyst bundle and pave your way to an enriched personal and professional future? If so, then Step into a world of knowledge with our course bundle - Market Research Analyst Advanced Diploma. Delve into eight immersive CPD Accredited courses, each a standalone course: Course 01: Marketing Principles Course 02: Marketing Secrets for High Sales Course 03: Marketing Strategies for Business Course 04: Learn with Case Study - Market Research Course 05: Research Methods in Business Course 06: Business Intelligence Analyst Course Course 07: Excel at Marketing Through a Well-Defined Marketing Strategy Course 08: Sales Analysis in Excel Traverse the vast landscapes of theory, unlocking new dimensions of understanding at every turn. Let the Market Research Analyst Advanced Diploma bundle illuminate your path to wisdom. The Market Research Analyst Advanced Diploma bundle offers a comprehensive exploration into a rich tapestry of vast knowledge across eight carefully curated courses. The journey is designed to enhance your understanding and critical thinking skills. Each course within the bundle provides a deep dive into complex theories, principles, and frameworks, allowing you to delve into the nuances of the subject matter at your own pace. In the framework of the Market Research Analyst Advanced Diploma package, you are bestowed with complimentary PDF certificates for all the courses included in this bundle, all without any additional charge. Adorn yourself with the Market Research Analyst bundle, empowering you to traverse your career trajectory or personal growth journey with self-assurance. Register today and ignite the spark of your professional advancement! So, don't wait further and join the Market Research Analyst Advanced Diploma community today and let your voyage of discovery begin! Learning Outcomes: Attain a holistic understanding in the designated areas of study with the Market Research Analyst bundle. Establish robust bases across each course nestled within the Market Research Analyst bundle. Decipher intricate concepts through the articulate content of the Market Research Analyst bundle. Amplify your prowess in interpreting, scrutinising, and implementing theories. Procure the capacity to engage with the course material on an intellectual and profound level. Become proficient in the art of problem-solving across various disciplines. Stepping into the Market Research Analyst bundle is akin to entering a world overflowing with deep theoretical wisdom. Each course within this distinctive bundle is an individual journey, meticulously crafted to untangle the complex web of theories, principles, and frameworks. Learners are inspired to explore, question, and absorb, thus enhancing their understanding and honing their critical thinking skills. Each course invites a personal and profoundly enlightening interaction with knowledge. The Market Research Analyst bundle shines in its capacity to cater to a wide range of learning needs and lifestyles. It gives learners the freedom to learn at their own pace, forging a unique path of discovery. More than just an educational journey, the Market Research Analyst bundle fosters personal growth, enabling learners to skillfully navigate the complexities of the world. The Market Research Analyst bundle also illuminates the route to a rewarding career. The theoretical insight acquired through this bundle forms a strong foundation for various career opportunities, from academia and research to consultancy and programme management. The profound understanding fostered by the Market Research Analyst bundle allows learners to make meaningful contributions to their chosen fields. Embark on the Market Research Analyst journey and let knowledge guide you towards a brighter future. CPD 80 CPD hours / points Accredited by CPD Quality Standards Who is this course for? Individuals keen on deepening their firm understanding in the respective fields. Students pursuing higher education looking for comprehensive theory modules. Professionals seeking to refresh or enhance their knowledge. Anyone with a thirst for knowledge and a passion for continuous learning. Career path Armed with the Market Research Analyst bundle, your professional journey can reach new heights. The comprehensive theoretical knowledge from this bundle can unlock diverse career opportunities across several fields. Whether it's academic research, consultancy, or programme management, the Market Research Analyst bundle lays a solid groundwork. Certificates CPD Certificate Of Completion Digital certificate - Included 8 Digital Certificates Are Included With This Bundle CPD Quality Standard Hardcopy Certificate (FREE UK Delivery) Hard copy certificate - £9.99 Hardcopy Transcript - £9.99

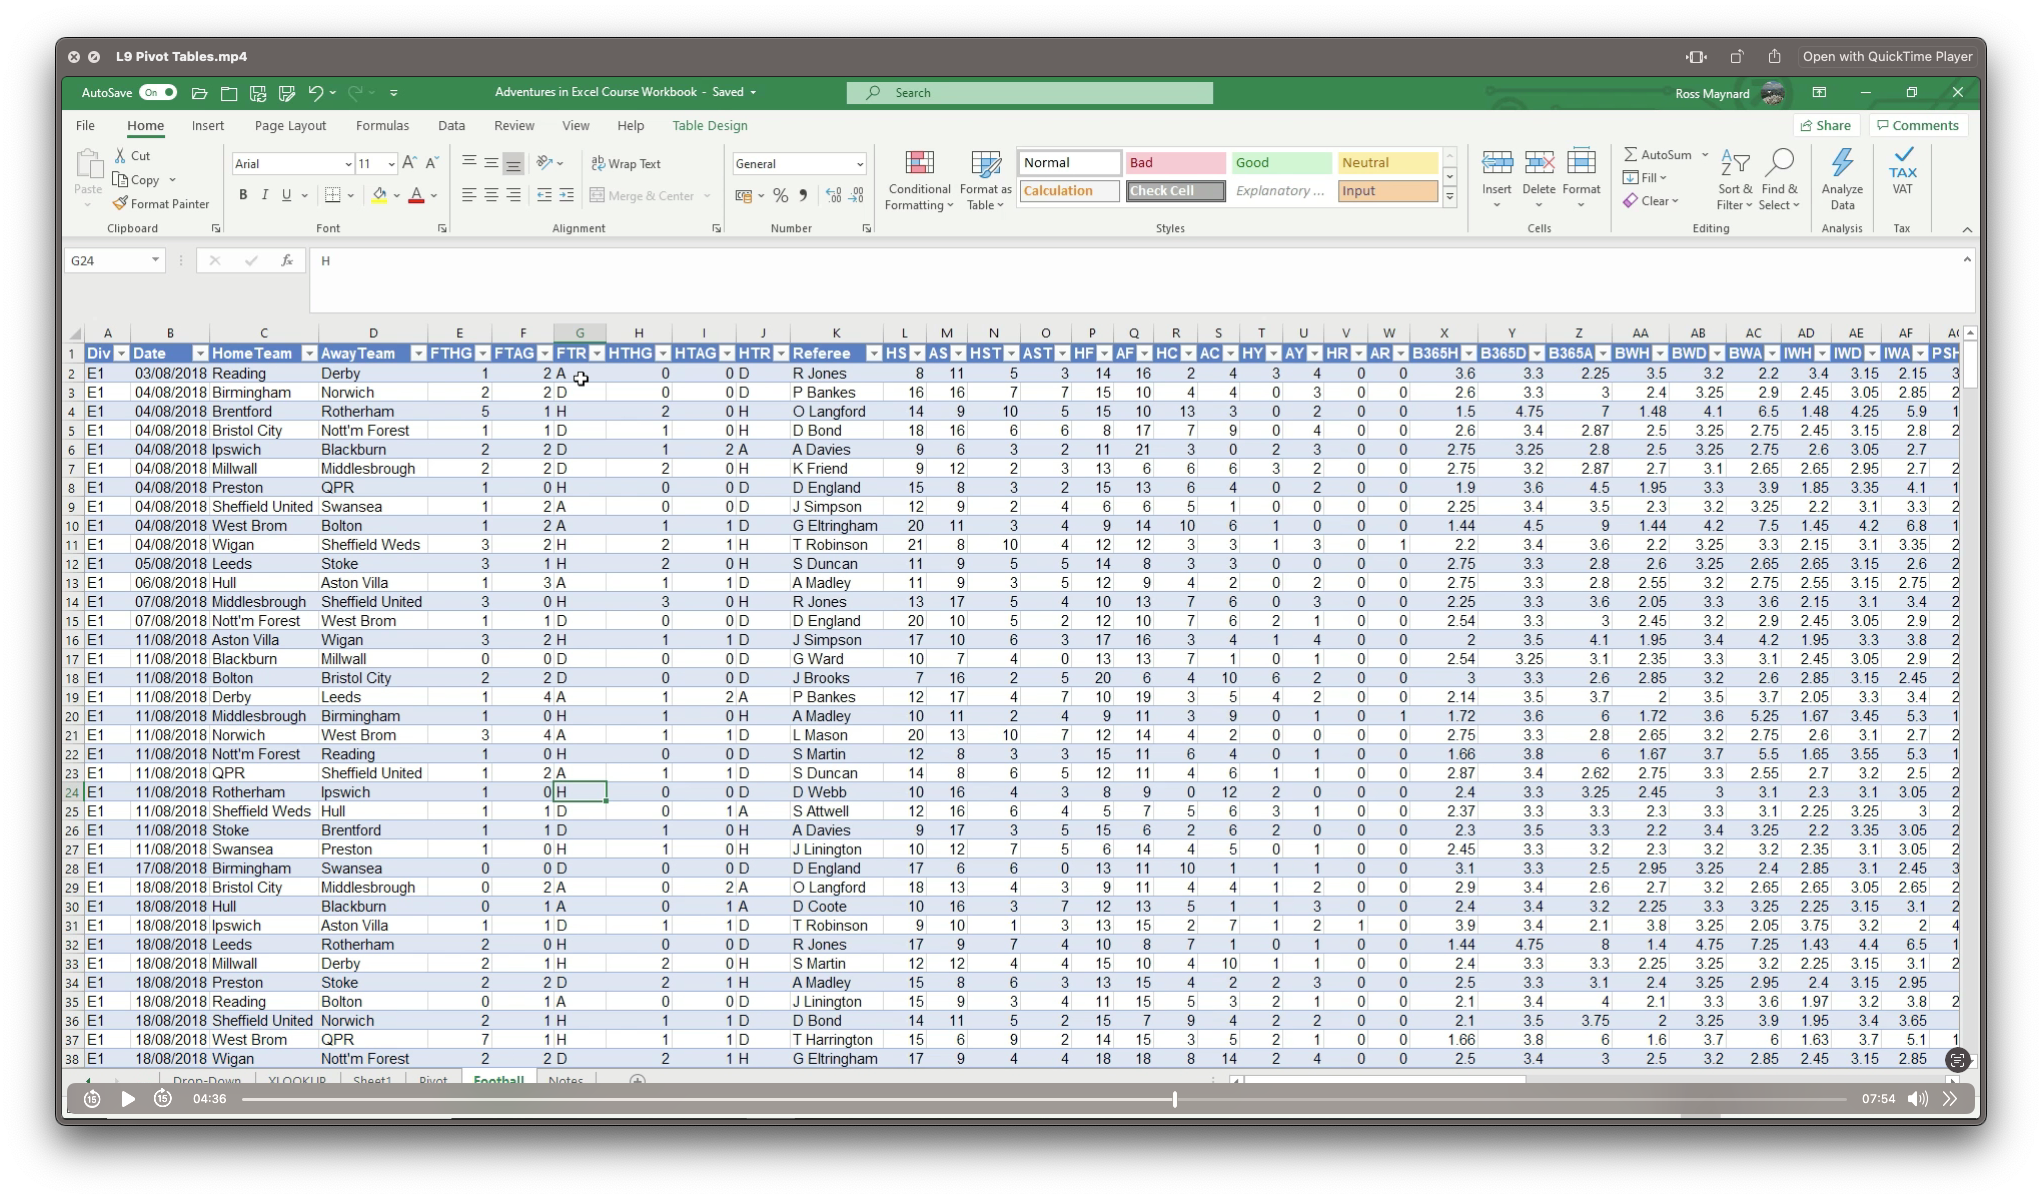
Adventures in Excel
By Ideas Into Action
Description Microsoft Excel has hundreds, if not thousands, of functions and features. This course aims to cover some of the best – that is the ones I find most useful. In “Adventures in Excel”, I cover the simple-to-use but powerful functions that I use most often: Basic features including products and powers Key date functions including the calculation of due dates and days past due Generating random numbers and random dates The new IFS functions (new to Office365) Text functions The most useful logical functions and IS functions How to create a drop-down list The new XLOOKUP function Pivot tables These functions are easy to use, and, unless your role is extremely specialised, they are probably the ones you’ll use 90% of the time. I hope you find the course helpful. Learning Outcomes Participants in this course will learn: Basic Excel functions including SUM, AVERAGE, MIN, MAX, PRODUCT, POWER and SQRT Useful date functions including TODAY, EOMONTH, EDATE, and DAYS Generating random numbers using RAND and RANDBETWEEN; generating random dates; and randomly picking an item from a list or table The new RANDARRAY function in Office365 The new IFS functions in Office365 including AVERAGEIFS, MAXIFS, MINIFS, COUNTIFS, and SUMIFS Text functions including TRIM, LOWER, UPPER, PROPER, LEFT, MID, RIGHT, FIND, TEXTJOIN and CONCATENATE Logical functions AND, OR, and NOT and IS functions ISTEXT, ISNUMBER, ISBLANK and ISERROR How to create a drop-down list The new SORT and FILTER functions in Office365 VLOOKUP and the new XLOOKUP function How to create a Pivot table and analyse data with one Course Requirements There are no pre-course requirements. Additional Resources Course Spreadsheet with the examples covered. About Ross Ross Maynard is a Fellow of the Chartered Institute of Management Accountants in the UK. He is director of Ideas2Action Process Excellence Ltd and has 30 years’ experience as a process improvement consultant and facilitator. Ross is also a professional author of online training courses for accountants. Ross lives in Scotland with his wife, daughter and Cocker Spaniel
Data Analytics & Database Development Using SQL - 8 Courses Bundle
By NextGen Learning
Are you ready to embark on an enlightening journey of wisdom with the Data Analytics & Database Development Using SQL bundle, and pave your way to an enriched personal and professional future? If so, then Step into a world of knowledge with our bundle - Data Analytics & Database Development Using SQL. Delve into eight immersive CPD Accredited courses, each a simple course: Course 1: Data Analytics Course 2: SQL Database Basics for Everyone Course 3: SQL for Data Science, Data Analytics and Data Visualization Course 4: Microsoft Access Databases Forms and Reports Course 5: Microsoft SQL Server Development for Everyone! Course 6: Python Programming from Scratch with My SQL Database Course 7: Google Data Studio: Data Analytics Course 8: Data Analysis and Forecasting in Excel Traverse the vast landscapes of theory, unlocking new dimensions of understanding at every turn. Let the Data Analytics & Database Development Using SQL bundle illuminate your path to wisdom. The Data Analytics & Database Development Using SQL bundle offers a comprehensive exploration into a rich tapestry of vast knowledge across five carefully curated courses. The journey is designed to enhance your understanding and critical thinking skills. Each course within the bundle provides a deep-dive into complex theories, principles, and frameworks, allowing you to delve into the nuances of the subject matter at your own pace. In the framework of the Data Analytics & Database Development Using SQL package, you are bestowed with complimentary PDF certificates for all the courses included in this bundle, all without any additional charge. Adorn yourself with the Data Analytics & Database Development Using SQL bundle, empowering you to traverse your career trajectory or personal growth journey with self-assurance. Register today and ignite the spark of your professional advancement! So, don't wait further and join the Data Analytics & Database Development Using SQL community today and let your voyage of discovery begin! Learning Outcomes: Upon completion of the Data Analytics & Database Development Using SQL Bundle, you will be able to: Attain a holistic understanding in the designated areas of study with the Data Analytics & Database Development Using SQL bundle. Establish robust bases across each course nestled within the Data Analytics & Database Development Using SQL bundle. Decipher intricate concepts through the articulate content of the Data Analytics & Database Development Using SQL bundle. Amplify your prowess in interpreting, scrutinising, and implementing theories. Procure the capacity to engage with the course material on an intellectual and profound level. Become proficient in the art of problem-solving across various disciplines. Stepping into the Data Analytics & Database Development Using SQL bundle is akin to entering a world overflowing with deep theoretical wisdom. Each course within this distinctive bundle is an individual journey, meticulously crafted to untangle the complex web of theories, principles, and frameworks. Learners are inspired to explore, question, and absorb, thus enhancing their understanding and honing their critical thinking skills. Each course invites a personal and profoundly enlightening interaction with knowledge. The Data Analytics & Database Development Using SQL bundle shines in its capacity to cater to a wide range of learning needs and lifestyles. It gives learners the freedom to learn at their own pace, forging a unique path of discovery. More than just an educational journey, the Data Analytics & Database Development Using SQL bundle fosters personal growth, enabling learners to skillfully navigate the complexities of the world. The Data Analytics & Database Development Using SQL bundle also illuminates the route to a rewarding career. The theoretical insight acquired through this bundle forms a strong foundation for various career opportunities, from academia and research to consultancy and programme management. The profound understanding fostered by the Data Analytics & Database Development Using SQL bundle allows learners to make meaningful contributions to their chosen fields. Embark on the Data Analytics & Database Development Using SQL journey and let knowledge guide you towards a brighter future. CPD 90 CPD hours / points Accredited by CPD Quality Standards Who is this course for? Individuals keen on deepening their firm understanding in the respective fields. Students pursuing higher education looking for comprehensive theory modules. Professionals seeking to refresh or enhance their knowledge. Anyone with a thirst for knowledge and a passion for continuous learning. Requirements Without any formal requirements, you can delightfully enrol in this Data Analytics & Database Development Using SQL Bundle. Career path Armed with the Data Analytics & Database Development Using SQL bundle, your professional journey can reach new heights. The comprehensive theoretical knowledge from this bundle can unlock diverse career opportunities across several fields. Whether it's academic research, consultancy, or programme management, the Data Analytics & Database Development Using SQL bundle lays a solid groundwork. Certificates CPD Certificate Of Completion Digital certificate - Included 8 Digital Certificates Are Included With This Bundle CPD Quality Standard Hardcopy Certificate (FREE UK Delivery) Hard copy certificate - £9.99 Hardcopy Transcript: £9.99

Mastering Microsoft Office: Word, Excel, PowerPoint, and 365
By IOMH - Institute of Mental Health
Microsoft Office skills are in high demand across industries, and proficiency in Microsoft Word, Microsoft Excel, Microsoft PowerPoint, and Microsoft Office 365 opens up numerous career opportunities. In the UK, administrative roles, data analysis positions, office management, project coordination, and marketing support roles are just a few examples of job prospects. With average salaries ranging from £20,000 to £45,000 per year, individuals with comprehensive Microsoft Office skills can secure stable employment and contribute to the success of various organisations. Enrol in the Ultimate Microsoft Office Skills Training course today and equip yourself with the knowledge and expertise needed to thrive in the ever-evolving workplace. You Will Learn Following Things: Develop a solid foundation in Microsoft Office applications, including Word, Excel, PowerPoint, and Office 365. Acquire essential skills to efficiently navigate and manipulate data in Microsoft Excel, such as organising, sorting, filtering, and writing formulas. Gain proficiency in creating professional presentations in Microsoft PowerPoint, utilising features like multimedia, transitions, animations, and smart graphics. Master the art of document creation and formatting in Microsoft Word, including tables, styles, page layouts, envelopes, labels, and mail merges. Understand advanced features like pivot tables, charts, and data analysis tools in Microsoft Excel, enabling effective data visualisation and decision-making. This course covers everything you must know to stand against the tough competition. The future is truly yours to seize with this Mastering Microsoft Office: Word, Excel, PowerPoint, and 365. Enrol today and complete the course to achieve a certificate that can change your career forever. Details Perks of Learning with IOMH One-to-one support from a dedicated tutor throughout your course. Study online - whenever and wherever you want. Instant Digital/ PDF certificate 100% money back guarantee 12 months access This course covers everything you must know to stand against the tough competition. The future is truly yours to seize with this Mastering Microsoft Office: Word, Excel, PowerPoint, and 365. Enrol today and complete the course to achieve a certificate that can change your career forever. Process of Evaluation After studying the course, your skills and knowledge will be tested with an MCQ exam or assignment. You have to get a score of 60% to pass the test and get your certificate. Certificate of Achievement After completing the Mastering Microsoft Office: Word, Excel, PowerPoint, and 365 course, you will receive your CPD-accredited Digital/PDF Certificate for £5.99. To get the hardcopy certificate for £12.99, you must also pay the shipping charge of just £3.99 (UK) and £10.99 (International). Who Is This Course for? This course is designed for individuals who want to enhance their Microsoft Office skills for personal or skilled purposes. Whether you are a student, an experienced entrepreneur, or anyone who regularly works with Microsoft Word, Excel, PowerPoint, and Office 365, this Microsoft Office skills course will provide you with a solid foundation and advanced techniques to maximise your productivity and efficiency. No prior experience is required, making it suitable for beginners and intermediate users looking to expand their knowledge and capabilities in the Microsoft Office suite. On the other hand, anyone who wants to establish their career as: like MS Office User Microsoft Office 2019 User Touch Typing Worker Audio Typist Can take this Ultimate Microsoft Office Skills Training (Word, Excel, PowerPoint, and 365) course. Requirements There is no prerequisite to enrol in this course. You don't need any educational qualification or experience to enrol in the Mastering Microsoft Office: Word, Excel, PowerPoint, and 365 course. Do note: you must be at least 16 years old to enrol. Any internet-connected device, such as a computer, tablet, or smartphone, can access this online course. Career path Administrative Assistant - £20K to £30K/year Data Analyst - £25K to £45K/year Office Manager - £25K to £40K/year Project Coordinator - £25K to £35K/year Marketing Assistant - £20K to £30K/year Course Curriculum Section 01: Getting Started Introduction 00:03:00 Getting started on Windows, macOS, and Linux 00:01:00 How to ask great questions 00:01:00 FAQ's 00:01:00 Section 02: Excel 2021: Basics Excel Overview 00:05:00 Start Excel Spreadsheet 00:04:00 Enter Text and Numbers 00:07:00 Relative References 00:04:00 Working with ranges 00:07:00 Save and Save as Actions 00:08:00 File Extensions, Share, Export, and Publish files 00:06:00 Section 03: Excel 2021: Rows, Columns, and Cells Adding Rows and Columns 00:03:00 Modifying Rows and Column lengths 00:05:00 Section 04: Excel 2021: Data Handling Copy, Cut, and Paste 00:07:00 Copying Formulas 00:03:00 Section 05: Excel 2021: Page Setting Up and Print Page setup options 00:06:00 Fit to print on One Page 00:03:00 Print Workbooks 00:03:00 Section 06: Excel 2021: Sorting and Filtering Sorting Data Ascending Order 00:04:00 Sorting Data Descending Order 00:02:00 Filter Data 00:04:00 Section 07: Excel 2021: Writing Formulas Creating Basic Formulas 00:06:00 Datetime Formulas 00:06:00 Mathematical formulas phase1 00:20:00 Mathematical formulas phase2 00:12:00 Section 08: Excel 2021: Advanced Formulas VLOOKUP formula 00:12:00 HLOOKUP formula 00:04:00 Section 09: Excel 2021: XLOOKUP only for 2021 and Office 365 XLOOKUP 00:08:00 Handling #NA and Approximates match in XLOOKUP 00:11:00 Section 10: Excel 2021: Data and Tools Split Text into columns 00:07:00 Flash Fill 00:07:00 Data Validation 00:07:00 Remove Duplicates 00:08:00 Import Data from Text files 00:06:00 Import Data from .CSV files 00:03:00 Section 11: Excel 2021: Formatting data and tables Formatting Font 00:04:00 Formatting Alignment 00:06:00 Formatting Numbers 00:05:00 Formatting Date 00:03:00 Formatting Tables 00:05:00 Section 12: Excel 2021: Pivot Tables Pivot Tables 00:07:00 Pivot Charts 00:02:00 Section 13: Excel 2021: Charts Excel Charts - Categories 00:03:00 Elements of a chart 00:04:00 Creating Charts 00:02:00 Column or Bar charts 00:04:00 Formatting charts 00:04:00 Line Charts 00:02:00 Pie and Doughnut charts 00:04:00 Section 14: PowerPoint 2021: Course Introduction Overview 00:04:00 Start PowerPoint Presentation 00:05:00 Screen setting and Views 00:05:00 Section 15: PowerPoint 2021: Basics Presentation Tips and Guidelines 00:06:00 Creating a New Presentation 00:04:00 Working with Slides 00:04:00 Save a Presentation 00:04:00 Print Slides 00:03:00 Section 16: PowerPoint 2021: Text and Bullet Options Formatting Text 00:05:00 Slide Text Alignments 00:03:00 Multi-Column Text Alignments 00:02:00 Adding Bullets and Numbered List Items 00:03:00 Section 17: PowerPoint 2021: Adding Graphic Assets Insert Shapes 00:03:00 Insert Icons 00:03:00 Insert Graphics 00:04:00 Add 3D Models 00:03:00 Insert Pictures 00:03:00 Section 18: PowerPoint 2021: Picture Formatting Picture Options 00:04:00 Picture Cropping 00:03:00 Applying Built-in Picture Styles 00:04:00 Section 19: PowerPoint 2021: SmartArt Graphics Add SmartArt Graphic 00:03:00 Modifying SmartArt 00:03:00 Creating a Target Chart using SmartArt 00:03:00 Section 20: PowerPoint 2021: Working with Tables Create a Table on Slide 00:04:00 Formatting Tables 00:02:00 Inserting Tables 00:02:00 Table Layouts 00:01:00 Section 21: PowerPoint 2021: Working with Charts Add a Chart 00:02:00 Formatting Charts 00:02:00 Insert Chart from Microsoft Excel 00:03:00 Section 22: PowerPoint 2021: Adding Multimedia Adding Video to a Presentation 00:03:00 Adding Audio to a Presentation 00:02:00 Screen Recording and Adding 00:02:00 Section 23: PowerPoint 2021: Working with Transition Applying Transitions to Presentation 00:04:00 Section 24: PowerPoint 2021: Animation Object Animation 00:03:00 Effect Options 00:02:00 Advanced Animation 00:02:00 Triggers to control animation 00:02:00 Section 25: PowerPoint 2021: Slideshow Effects Onscreen Presentation 00:02:00 Hiding Slides 00:02:00 Changing Order of Slides 00:02:00 Copying Slides 00:02:00 Section 26: Word 2021: Introduction Overview of MS Word 00:04:00 Start MS Word 2021 00:05:00 Section 27: Word 2021: Basics Create a new blank document 00:04:00 Creating a paragraph text 00:05:00 Non-printing characters 00:03:00 Save a document 00:03:00 Open a document 00:01:00 Find and replace 00:04:00 Section 28: Word 2021: Word Formatting AutoCorrect options 00:03:00 Formatting text 00:04:00 Copy cut and paste 00:04:00 Character formatting 00:02:00 Format painter 00:04:00 Work with numbers 00:02:00 Add bullets 00:03:00 Outline creation 00:04:00 Section 29: Word 2021: Tables Creating a table 00:03:00 Adding rows and columns to a table 00:02:00 Formatting table data 00:02:00 Borders and shading 00:02:00 Sorting in a table 00:04:00 Draw a table 00:04:00 Convert text to table 00:03:00 Convert table to text 00:02:00 Insert a spreadsheet 00:02:00 Quick tables - readily available formats 00:02:00 Section 30: Word 2021: Styles Working with styles 00:02:00 Creating styles 00:02:00 Clear formatting 00:01:00 Section 31: Word 2021: Page Layout Margins 00:02:00 Orientation 00:01:00 Page size setting 00:01:00 Adding columns 00:03:00 Page break - section break 00:02:00 Adding watermark 00:03:00 Headers and footers 00:03:00 Section 32: Word 2021: Envelops and Lables Create envelops 00:02:00 Creating labels 00:02:00 Section 33: Word 2021: Mail Merges Creating a mail merge document 00:03:00 Section 34: Word 2021: Review and Printing Thesaurus and spell check 00:01:00 Word count 00:01:00 Speech - read aloud 00:01:00 Language - translate 00:01:00 Tracking 00:01:00