- Professional Development
- Medicine & Nursing
- Arts & Crafts
- Health & Wellbeing
- Personal Development
1052 Engineer courses in Ewell delivered Live Online
REVIT ADVANCED ONE-TO-ONE COURSE
By Real Animation Works
Vray face to face training customised and bespoke.

AutoCAD One to One Training Course
By Real Animation Works
Autocad face to face training customised and bespoke Online or Face to Face

Networks demystified training course description A concise overview course covering all aspects of networking with particular emphasis of use of the 7 layer model as a framework for discussing and learning new network terms enabling delegates to recognise the main buzzwords used in the industry. What will you learn Use the 7 layer model to classify networking terms. Differentiate between LANS and WANS. Recognise bandwidth measurements. List LAN and WAN technologies. Recognise cabling issues in a network. Networks demystified training course details Who will benefit: Sales staff, managers and other non-technical personnel. Technical personnel may benefit more from our Intro to data communications and networking course. Prerequisites: None. Duration 1 day Networks demystified training course contents What are networks? What is a network? Types of network, Local Area Networks (LANs), Wide Area Networks (WANs), connecting networks together with routers. The 7 layer model What is the 7 layer model? The importance of standards, using the 7 layer model to classify networking terms. Cables Copper, Fibre, Air, standards, connectors, LAN cables, WAN cables, distance limitations, hubs and repeaters, other issues. The radio spectrum. Bandwidth Bits and bytes. Bandwidth measurements, common technologies and their bandwidth, the impact of applications on bandwidth. Full and half duplex. Joining cables together to increase bandwidth (Link aggregation). LANs and WANs What is Ethernet? What is WiFi? What are Leased lines? What is MPLS? Ethernet switches Ethernet 'packets', MAC addresses, what is a switch, what is the difference between a hub and a switch. TCP/IP What is TCP/IP? What is a protocol? What is IP? What is TCP? The role of routers in joining LANS and WANS, What is the Internet? Applications Ways to use the network, clients, servers, web browsing and HTTP, Email, instant messaging, multimedia applications.
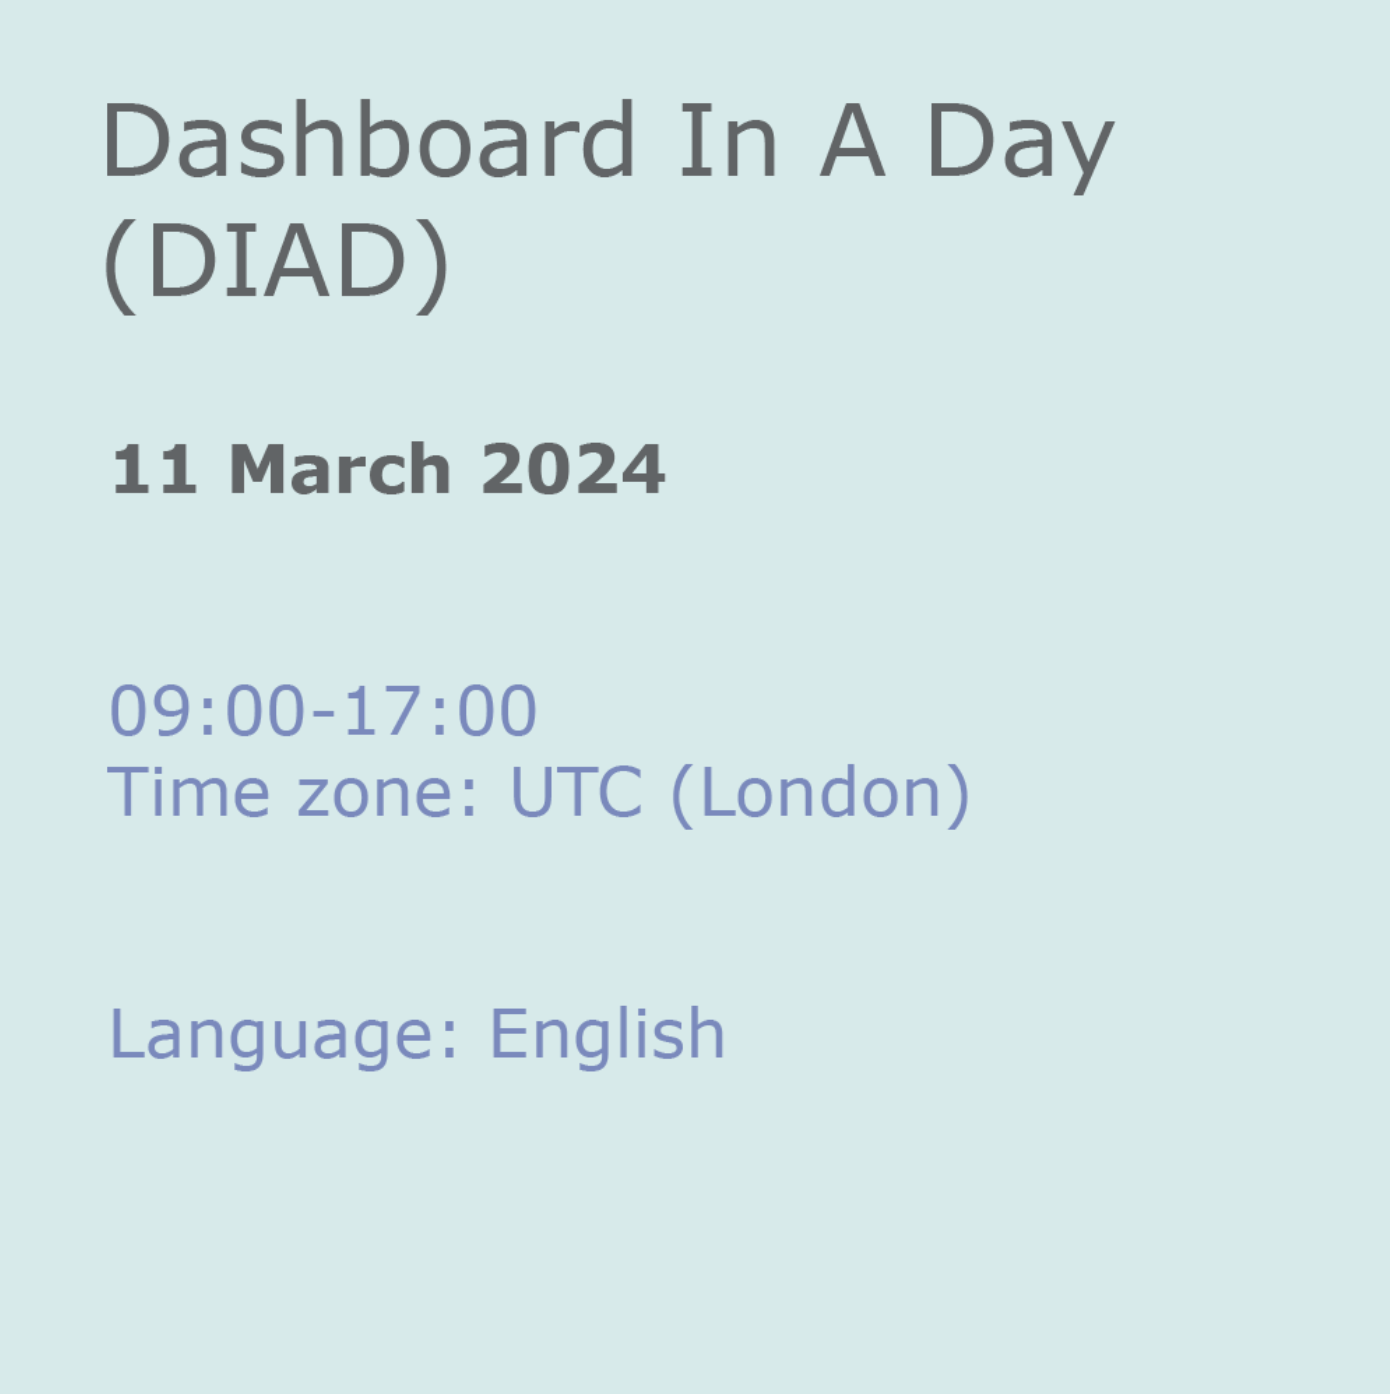
Dashboard In A Day (DIAD)
By Online Productivity Training
OVERVIEW DIAD is a one-day, hands-on workshop for business analysts, covering the breadth of Power BI capabilities. The course focuses on five practical Labs and at the end of the day, attendees will better understand how to: Connect and transform data from a variety of data sources. Define business rules and KPIs. Explore data with powerful interactive visuals. Build stunning reports. Share their dashboards with their team business partners and publish them to the web. The course content is managed by the Power BI engineering team at Microsoft. There is no exam associated with the course. COURSE BENEFITS: Learn how to clean, transform, and load data from various sources Create and manage a data model in Power BI consisting of multiple tables connected with relationships Build Measures and other calculations in the DAX language to plot in reports Manage and share report assets to the Power BI Service WHO IS THE COURSE FOR? Data Analysts and Management Consultants with little or no experience of Power BI who wish to upgrade their knowledge to include Business Intelligence Analysts looking for a quick introduction to Power BI who don’t have the time for the full three day PL-300 course Marketers in data-intensive organisations who need new tools to build visually appealing, dynamic charts for their stakeholders to use LAB OUTLINE Lab 1 Accessing & Preparing The Data Load data from Excel and CSV sources Manipulate the data to prepare it for reporting Prepare tables in Power Query and load them into the data model Lab 2 Data Modelling And Exploration Create a range of different charts Highlight and cross-filter Create new groups and hierarchies Add new measures to the model Lab 3 Data Visualization Add conditional formatting to a report Add logos to a filter Import a custom visual Apply a custom theme Add bookmarks to the report to tell a story Lab 4 Publishing A Report And Creating A Dashboard Create a Workspace in the Power BI Service Publish a report to the Service Create a Dashboard and pin visuals to it Generate and view insights Lab 5 Collaboration Share a Dashboard Access a Dashboard on a Mobile Device
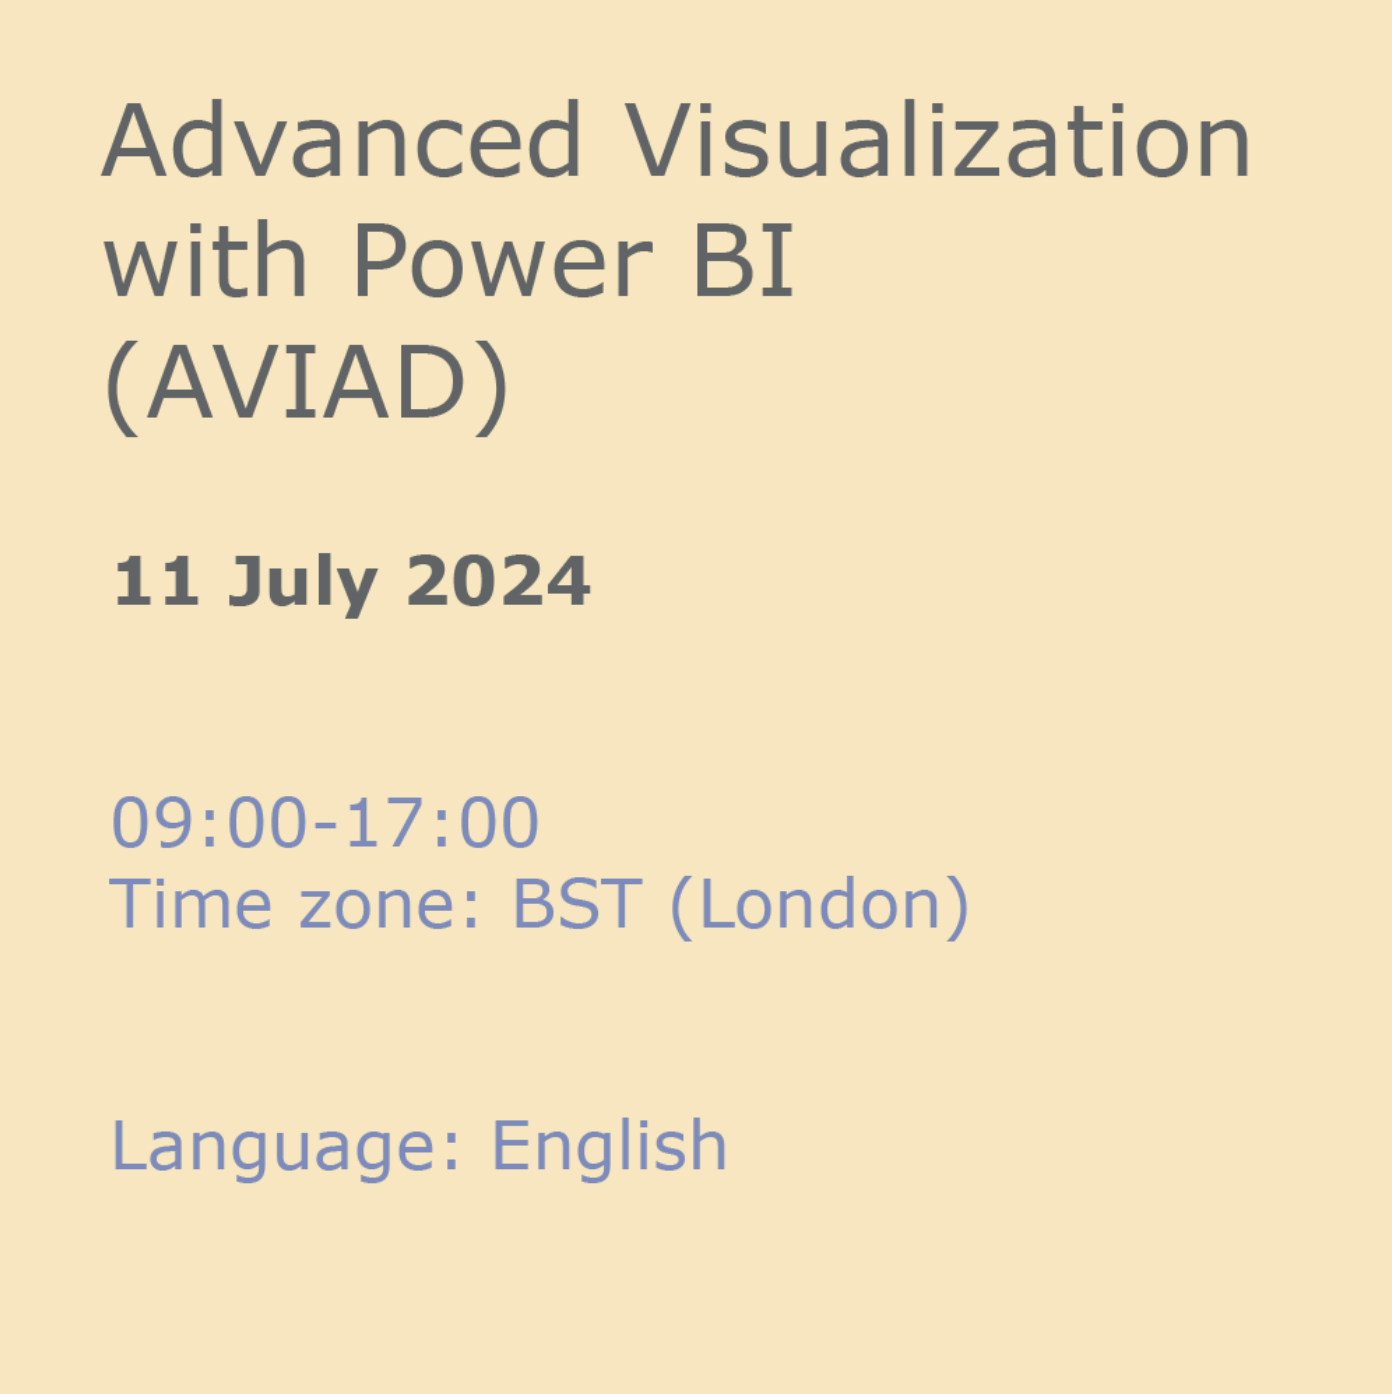
Advanced Visualization with Power BI (AVIAD)
By Online Productivity Training
OVERVIEW Prerequisites—DIAD training or equivalent working experience This one-day course will cover Power BI report layouts and structure the agile process to creating Power BI data visualizations. It will help attendees to understand the art behind visualizations, the implications behind choosing the right charts, the impact of color, shape, and size, and finally the use of Power BI custom visuals. The course includes various design patterns of dashboards and reports, as well as best practices for authoring great reports and dashboards for business users. The course content is managed by the Power BI engineering team at Microsoft. There is no exam associated with the course. COURSE BENEFITS: Understand the need for storytelling with data Understand the agile process to creating Power BI data visualizations Understand the art behind visualizations Gain familiarity with Power BI report layouts and structure Understand implications behind choosing the right charts Gain familiarity with using Power BI custom visuals WHO IS THE COURSE FOR? Power BI report developers who wish to improve the aesthetic quality of their reports Power BI and other BI practitioners who would like to understand more about the theory of data visualization BI practitioners who wish to create reports that communicate the meaning behind the data more clearly Power BI users who would like to explore the types of chart and visual available that answer different types of business question COURSE OUTLINE Module 1 What Is Storytelling With Data? Volume, Velocity and Variety The importance of business questions What is a story in this context? Module 2 The Science Behind Data Visualization Basic problems to avoid Memory and visualization Ways to spark iconic, short-term and long-term memory Module 3 The Process Behind Data Visualization Using an agile approach to report development Data structure and data grain Converting the story to a data model Module 4 Dashboards And Reports Terminology and definitions Dashboard layout and structure Report layout and structure Storyboarding Drill-through, bookmarks, toggles and tooltips Module 5 Chart Selection Charts for comparison Time series Proportions Constructing effective tables, cards and slicers Scatterplots Module 6 Accessibility And Custom Visuals Report accessibility checklists Custom visuals Creating a custom R visual Charticulator Module 7 Publishing And Formatting Colour schemes Making a Power BI theme Use of fonts, icons and symbols Sizing dashboard and report tiles Sparklines, hyperlinks and images Module 8 Report Authoring - Best Practices Design thought process The audience Defining the platform environment The user experience Visualization Implementation and testing Optimization Module 9 Dashboard And Goals Design Tips and tricks Best practices for dashboard design Tracking business metrics with goals

Vectorworks Basic to Intermediate Course
By Real Animation Works
Revit face to face training customised and bespoke.

REVIT ADVANCED ONE-TO-ONE COURSE
By Real Animation Works
3ds max and Photoshop face to face training customised and bespoke.