- Professional Development
- Medicine & Nursing
- Arts & Crafts
- Health & Wellbeing
- Personal Development
6 Courses delivered Live Online
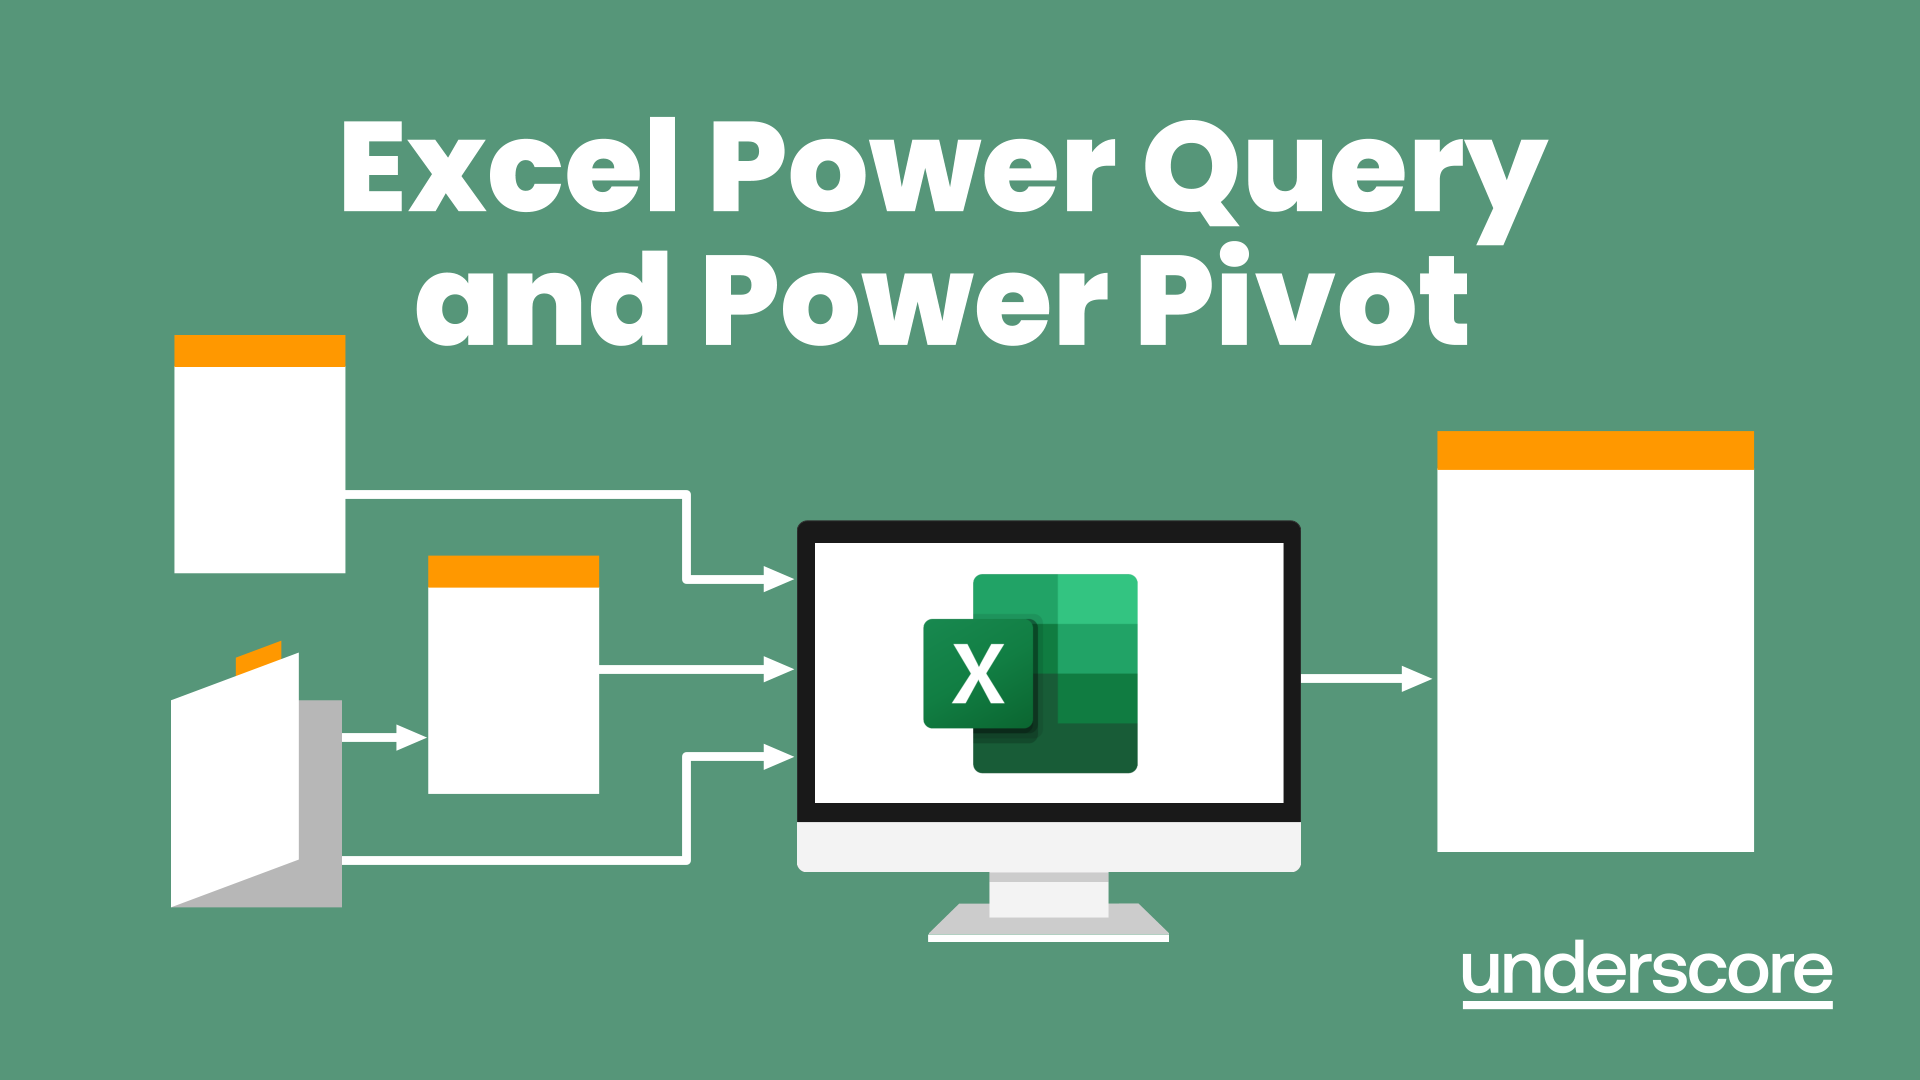
Excel Power Query and Power Pivot
By Underscore Group
Learn how to work with and connect multiple data sets to effectively analyse and report on data. Course overview Duration: 1 day (6.5 hours) Within Excel you have some powerful features to enable you to connect and analyse multiple data sources. Power Query enables you to import and manipulate your data, Power Pivot enables you to connect multiple data sources and create pivot tables and pivot charts from them. This course is an introduction to Power Query and Power Pivot in Excel to get you started on creating a powerful reporting capability. Knowledge of working with Excel workbooks and relational databases would be an advantage. Objectives By the end of the course you will be able to: Import data from multiple data sources Edit and transform data before importing Add extra columns of data Append data Merge data from other tables Create data models Build data relationships Build Pivot Tables Build Pivot Charts Use Slicers and Timeline Filters Content Importing data Data sources Importing data Transforming data Editing your data Setting data types Removing columns/rows Choosing columns to keep Setting header rows Splitting columns Appending queries Appending data from other tables Adding text Columns from example Custom columns Conditional columns Merge queries Setting up and using merge queries Merging in columns of data Creating a data model The data model Multiple data tables Connecting tables Building relationships Relationship types Building visuals from multiple tables Analysing information using pivot tables Creating and modifying a Pivot Table Recalculating the Pivot Table Filtering the Pivot Table Searching the Pivot Table Drilling down to underlying data Customising field names Changing field formatting Pivot charts, slices and timelines Creating Pivot Charts Adding and using Slicers
Data Analysis and Visualization with Microsoft Excel
By Mpi Learning - Professional Learning And Development Provider
This course is designed for students who already have foundational knowledge and skills in Excel and who wish to perform robust and advanced data and statistical analysis with Microsoft Excel using PivotTables, use tools such as Power Pivot and the Data Analysis ToolPak to analyze data and visualize data and insights using advanced visualizations in charts and dashboards in Excel.

Data Analysis and Visualization with Microsoft Excel
By Nexus Human
Duration 2 Days 12 CPD hours This course is intended for This course is designed for students who already have foundational knowledge and skills in Excel and who wish to perform robust and advanced data and statistical analysis with Microsoft Excel using PivotTables, use tools such as Power Pivot and the Data Analysis ToolPak to analyze data, and visualize data and insights using advanced visualizations in charts and dashboards in Excel. To ensure success, you should have baseline skill using Microsoft Excel worksheets, particularly in creating workbooks with formulas and function Overview #NAME? Analyzing data to find issues, insights and opportunities, is now a critical part of many job roles. Beyond the analysis, data analysts in all job roles must be able to effectively present and communicate their findings in visually compelling ways. Microsoft© Excel© is designed for this purpose. Excel can connect to a wide range of data sources, perform robust data analysis and create diverse and robust data-backed visualizations to show insights, trends, and create reports. These capabilities enable people who use Excel for data analysis to turn data into thoughtful action. 1 - DATA ANALYSIS FUNDAMENTALS Introduction to Data Science Create and Modify Tables Sort and Filter Data 2 - VISUALIZING DATA WITH EXCEL Visualize Data with Charts Modify and Format Charts Apply Best Practices in Chart Design 3 - ANALYZING DATA WITH FORMULAS AND FUNCTIONS Analyze Data with Formulas and Named Ranges Analyze Data with Functions Implement Data Validation, Forms, and Controls Create Conditional Visualizations with Lookup Functions 4 - ANALYZING DATA WITH PIVOTTABLES Create a PivotTable Analyze PivotTable Data 5 - PRESENTING VISUAL INSIGHTS WITH DASHBOARDS IN EXCEL Visualize Data with PivotCharts Filter Data Using Slicers and Timelines Create a Dashboard in Excel 6 - CREATING GEOSPATIAL VISUALIZATIONS WITH EXCEL Create Map Charts in Excel Customize Map Charts in Excel 7 - PERFORMING STATISTICAL ANALYSIS Visualize Trendlines and Sparklines with Excel Analyze Data with the Data Analysis ToolPa 8 - GETTING AND TRANSFORMING DATA Connect to Data with Queries Clean and Combine Data Shape and Transform Data 9 - MODELING AND ANALYZING DATA WITH POWER PIVOT Install Power Pivot in Excel Create Data Models with Power Pivot Create Power Pivots Perform Advanced Data Analysis and Visualization 10 - PRESENTING INSIGHTS WITH REPORTS (OPTIONAL) Plan a Report Create a Report

Microsoft Power BI Desktop (live online classes)
By Microsoft Office Training
This course will allow you to explore the potential of self-service business intelligence using Power BI Desktop to analyse and connect to different sources of data, creating Relationships between those different datasets, Query the data using Shaping and data Modelling, to create Visualizations, and publish Reports to different platforms . Course Objectives At the end of this course you will be able to: Connect to data from different sources. Use the Query Editor Perform Power BI desktop data Shaping and Transformation. Create Power BI desktop Modelling. Create Power BI desktop Visualizations and Reports. ' 1 year email support service Take a closer look at the consistent excellent feedback from our growing corporate clients visiting our site ms-officetraining co uk With more than 20 years experience, we deliver courses on all levels of the Desktop version of Microsoft Office and Office 365; ranging from Beginner, Intermediate, Advanced to the VBA level and Business Intelligence. Our trainers are Microsoft certified professionals with a proven track record with several years experience in delivering public, one to one, tailored and bespoke course Tailored training courses: in in company training, you can choose to run the course exactly as they are outlined by us or we can customise it so that it meets your specific needs. A tailored or bespoke course will follow the standard outline but may be adapted to your specific organisational needs. Please visit our site (ms-officetraining co uk) to get a feel of the excellent feedback our courses have had and look at other courses you might be interested in. Introduction to Power BI Power BI Jargon explained A quick look at Power BI Desktop A quick look at the Power BI service Helpful resources Power BI and Excel Introduction to using Excel data in Power BI Upload Excel data to Power BI Import Power View and Power Pivot to Power BI Getting started with Power BI Desktop Overview of Power BI Desktop Accessing Help and Helpful resources Connect to data sources in Power BI Desktop Shaping and Transforming Data with Query Editor Introduction to the Query Editor Data Sources Power BI Desktop can Connect to Introduction to Steps and M code Combining Data Using Merge and Append Queries Data Type Properties Working with Delimiters Clean and transform your data with the Query Editor Text Specific Transformation Tools Number Specific Transformation Tools Date Specific Transformation Tools Split and Merge columns Creating an Index Column Adding Conditional Columns Columns From Examples Grouping and Aggregating data Pivoting and Unpivoting Using filters Modeling the data Introduction to modeling your data How to manage your data relationships Create calculated columns Optimizing data models Create calculated measures Show Values As and Quick Measures Create calculated tables Explore your time-based data Introduction to DAX DAX calculation types DAX functions Visualizations Introduction to visuals in Power BI Create and customize simple visualizations Modify colors in charts and visuals Shapes, text boxes, and images Page layout and formatting Group interactions among visualizations Visual hierarchies and drill-down Using custom visualizations Create a KPI Visualization Geo-Data and Maps Reports, Publishing and Sharing Introduction to the Power BI service Quick insights in Power BI Create and configure a dashboard Ask questions of your data with natural language Create custom Q&A suggestions Share dashboards with your organization Introduction to content packs, security, and groups Publish Power BI Desktop reports Print and export dashboards and reports Create groups in Power BI Use content packs Update content packs Publish to web Who is this course for? Who is this course for? This course facilitates you with knowledge on the potential for Power BI Desktop to analyse and connect to different sources of data, creating Relationships between those different datasets, Query the data using Shaping and data Modelling, and to create Visualizations, and publish Reports to different platforms. Requirements Requirements Before attending this course, delegates should have: - A general knowledge of database concepts (fields, records and relationships) - Familiarity with Excel. Career path Career path Business Intelligence Data Analysis ETL & Data Warehousing

Microsoft Power BI Desktop In-company (now with live online classes)
By Microsoft Office Training
This course will allow you to explore the potential of self-service business intelligence using Power BI Desktop to analyse and connect to different sources of data, creating Relationships between those different datasets, Query the data using Shaping and data Modelling, to create Visualizations, and publish Reports to different platforms . Course Objectives At the end of this course you will be able to: Connect to data from different sources. Use the Query Editor Perform Power BI desktop data Shaping and Transformation. Create Power BI desktop Modelling. Create Power BI desktop Visualizations and Reports. ' 1 year email support service Take a closer look at the consistent excellent feedback from our growing corporate clients visiting our site ms-officetraining co uk With more than 20 years experience, we deliver courses on all levels of the Desktop version of Microsoft Office and Office 365; ranging from Beginner, Intermediate, Advanced to the VBA level and Business Intelligence. Our trainers are Microsoft certified professionals with a proven track record with several years experience in delivering public, one to one, tailored and bespoke courses. Our competitive rates start from £550.00 per day of training Tailored training courses: You can choose to run the course exactly as they are outlined by us or we can customise it so that it meets your specific needs. A tailored or bespoke course will follow the standard outline but may be adapted to your specific organisational needs. Please visit our site (ms-officetraining co uk) to get a feel of the excellent feedback our courses have had and look at other courses you might be interested in. Introduction to Power BI Power BI Jargon explained A quick look at Power BI Desktop A quick look at the Power BI service Helpful resources Power BI and Excel Introduction to using Excel data in Power BI Upload Excel data to Power BI Import Power View and Power Pivot to Power BI Getting started with Power BI Desktop Overview of Power BI Desktop Accessing Help and Helpful resources Connect to data sources in Power BI Desktop Shaping and Transforming Data with Query Editor Introduction to the Query Editor Data Sources Power BI Desktop can Connect to Introduction to Steps and M code Combining Data Using Merge and Append Queries Data Type Properties Working with Delimiters Clean and transform your data with the Query Editor Text Specific Transformation Tools Number Specific Transformation Tools Date Specific Transformation Tools Split and Merge columns Creating an Index Column Adding Conditional Columns Columns From Examples Grouping and Aggregating data Pivoting and Unpivoting Using filters Modeling the data Introduction to modeling your data How to manage your data relationships Create calculated columns Optimizing data models Create calculated measures Show Values As and Quick Measures Create calculated tables Explore your time-based data Introduction to DAX DAX calculation types DAX functions Visualizations Introduction to visuals in Power BI Create and customize simple visualizations Modify colors in charts and visuals Shapes, text boxes, and images Page layout and formatting Group interactions among visualizations Visual hierarchies and drill-down Using custom visualizations Create a KPI Visualization Geo-Data and Maps Reports, Publishing and Sharing Introduction to the Power BI service Quick insights in Power BI Create and configure a dashboard Ask questions of your data with natural language Create custom Q&A suggestions Share dashboards with your organization Introduction to content packs, security, and groups Publish Power BI Desktop reports Print and export dashboards and reports Create groups in Power BI Use content packs Update content packs Publish to web Who is this course for? Who is this course for? This course facilitates you with knowledge on the potential for Power BI Desktop to analyse and connect to different sources of data, creating Relationships between those different datasets, Query the data using Shaping and data Modelling, and to create Visualizations, and publish Reports to different platforms. Requirements Requirements Before attending this course, delegates should have: - A general knowledge of database concepts (fields, records and relationships) - Familiarity with Excel. Career path Career path Business Intelligence Data Analysis ETL & Data Warehousing