- Professional Development
- Medicine & Nursing
- Arts & Crafts
- Health & Wellbeing
- Personal Development
271 Courses delivered Live Online
Personal Transformation
By Confidentmindset
Discover personal transformation with our weekly sessions! Dive into self-discovery, redefine your path, and master decision-making. Join us every Wednesday for 50 minutes. Reserve your spot today and start your journey to a new you!

SAP CRM Training Online
By Osborne Training
SAP CRM Training Online SAP CRM (Customer Relationship Management) module empowers you to manage all of your customer-related data and contacts. In SAP CRM training course you will learn how to leverage functionality for the full spectrum of CRM processes including sales, service, marketing, and operations. Powered with an understanding and knowledge of the comprehensive functionality in SAP CRM, you can easily manage the entire customer life cycle efficiently and intelligently. SAP CRM is one of the significant part of SAP Business Suite to manage customer relationship. It supports all customer-focused business areas such as marketing, sales and service. A component of SAP CRM, CRM Analytics, enables organizations to gather all relevant information about various key factors such as a customer and analyse the knowledge base to incorporate insights into operational processes and helps in strategic decision-making. SAP CRM Basic Functions and Master Data SAP CRM Sales, Marketing, Services and Middleware SAP CRM WORKSHOP/Project orientation Training

Hands-on Data Analysis with Pandas (TTPS4878)
By Nexus Human
Duration 3 Days 18 CPD hours This course is intended for This course is geared for Python-experienced attendees who wish to be equipped with the skills you need to use pandas to ensure the veracity of your data, visualize it for effective decision-making, and reliably reproduce analyses across multiple datasets. Overview Working in a hands-on learning environment, guided by our expert team, attendees will learn to: Understand how data analysts and scientists gather and analyze data Perform data analysis and data wrangling using Python Combine, group, and aggregate data from multiple sources Create data visualizations with pandas, matplotlib, and seaborn Apply machine learning (ML) algorithms to identify patterns and make predictions Use Python data science libraries to analyze real-world datasets Use pandas to solve common data representation and analysis problems Build Python scripts, modules, and packages for reusable analysis code Perform efficient data analysis and manipulation tasks using pandas Apply pandas to different real-world domains with the help of step-by-step demonstrations Get accustomed to using pandas as an effective data exploration tool. Data analysis has become a necessary skill in a variety of domains where knowing how to work with data and extract insights can generate significant value. Geared for data team members with incoming Python scripting experience, Hands-On Data Analysis with Pandas will show you how to analyze your data, get started with machine learning, and work effectively with Python libraries often used for data science, such as pandas, NumPy, matplotlib, seaborn, and scikit-learn. Using real-world datasets, you will learn how to use the powerful pandas library to perform data wrangling to reshape, clean, and aggregate your data. Then, you will be able to conduct exploratory data analysis by calculating summary statistics and visualizing the data to find patterns. In the concluding lessons, you will explore some applications of anomaly detection, regression, clustering, and classification using scikit-learn to make predictions based on past data. Students will leave the course armed with the skills required to use pandas to ensure the veracity of their data, visualize it for effective decision-making, and reliably reproduce analyses across multiple datasets. Introduction to Data Analysis Fundamentals of data analysis Statistical foundations Setting up a virtual environment Working with Pandas DataFrames Pandas data structures Bringing data into a pandas DataFrame Inspecting a DataFrame object Grabbing subsets of the data Adding and removing data Data Wrangling with Pandas What is data wrangling? Collecting temperature data Cleaning up the data Restructuring the data Handling duplicate, missing, or invalid data Aggregating Pandas DataFrames Database-style operations on DataFrames DataFrame operations Aggregations with pandas and numpy Time series Visualizing Data with Pandas and Matplotlib An introduction to matplotlib Plotting with pandas The pandas.plotting subpackage Plotting with Seaborn and Customization Techniques Utilizing seaborn for advanced plotting Formatting Customizing visualizations Financial Analysis - Bitcoin and the Stock Market Building a Python package Data extraction with pandas Exploratory data analysis Technical analysis of financial instruments Modeling performance Rule-Based Anomaly Detection Simulating login attempts Exploratory data analysis Rule-based anomaly detection Getting Started with Machine Learning in Python Learning the lingo Exploratory data analysis Preprocessing data Clustering Regression Classification Making Better Predictions - Optimizing Models Hyperparameter tuning with grid search Feature engineering Ensemble methods Inspecting classification prediction confidence Addressing class imbalance Regularization Machine Learning Anomaly Detection Exploring the data Unsupervised methods Supervised methods Online learning The Road Ahead Data resources Practicing working with data Python practice

Elite EA PA Forum 🇮🇪
By Elite Forums Events
Elite EA/PA Forum We are delighted to announce the Elite EA/PA Forum for the UK & Ireland will be on the 30th of October 2025. Our workshop aims to: Enhance your influence and impact by mastering assertive communication, negotiation, and self-advocacy skills. Stay composed and solution-focused in high-pressure situations with practical tools for crisis management and clear decision-making. Embrace evolving technology by understanding how AI and automation can streamline your role and boost efficiency. Future-proof your career by building strategic value, resilience, and adaptability in an ever-changing professional landscape. Keynote Address with Q&A from the audience: What to expect from Sam's Keynote: With over 30 years supporting leaders at the highest levels, Sam Cohen brings a wealth of insight, experience, and stories (the kind she can share) to the stage. From 18 years serving within The Royal Household - including as Deputy Private Secretary and Press Secretary to Her late Majesty Queen Elizabeth II - to working with The Duke and Duchess of Sussex, running the Prime Minister’s Office at Downing Street, and serving as Chief of Staff to the global CEO of Rio Tinto, Sam’s career is a masterclass in discretion, diplomacy, and delivering at the top. In this exclusive keynote, Beyond the Role, Sam will explore how Executive Assistants don’t just support leaders - they shape leadership, drive strategy, and build legacy from behind the scenes. Join us for this rare opportunity to hear from someone who’s been at the epicentre of power - and bring your questions! The keynote will include a live Q&A, where you can ask Sam about her remarkable career, leadership insights, and how to truly excel in high-performance environments. (Don’t ask her what the Queen kept in her handbag - she’s not telling.) Sam Cohen Career Bio: Sam Cohen has spent the last 30 years working to support leaders in the public and private sectors. Sam spent 18 years serving The Royal Household, as Deputy Private Secretary to Her late Majesty Queen Elizabeth II and Press Secretary to The Queen. Sam also served as Private Secretary to The Duke and Duchess of Sussex. Following this time, Sam worked as Director of the Prime Minister’s Office at Downing Street under Boris Johnson and, most recently, was Chief of Staff to the global CEO at Rio Tinto. Source: ABC News - YouTube Channel. Facilitator The Confident Assistant - Speak Up, Go After What You Want & Create The Future You Deserve: Develop practical strategies to negotiate workload, boundaries, and career growth with confidence. Learn assertive communication techniques to handle challenging conversations effectively. Build self-advocacy skills to articulate your value and influence outcomes in the workplace. Monika Turner Career Bio: Monika Anna Turner is an ICF-certified Leadership and Executive coach with over seven years of experience helping professionals unlock their confidence, elevate their voice, and lead with authenticity. Before stepping into coaching, she built a successful career as a Personal Assistant, Executive Assistant, and ultimately Chief Of Staff —giving her a deep understanding of the unique challenges and strengths of support roles. Originally from Poland, Monika knows firsthand what it’s like to question your voice and your value—especially in a second language. Her journey from self-doubt to self-assurance informs everything she does today. Through her coaching, she empowers assistants and leaders alike to move beyond fear, speak up and create fulfilling careers they’re proud of. Panel Crisis Mode: What to do when everything goes wrong Master a step-by-step approach to prioritising and problem-solving under pressure. Strengthen emotional resilience and calm decision-making during unexpected disruptions. Learn how to communicate clearly and lead from behind in high-stress situations. Facilitator - PM: Justin Kabbani AI Is Not Here to Replace You. It's Here to Upgrade You. We'll explore Justin's proven 3P framework: Priming – How to set up AI like a strategic advisor by feeding it context, tone and mindset Prompting – How to craft clear, structured instructions to get consistently great results Producing – How to turn AI outputs into high-leverage work that makes you stand out Your session outcomes: Real examples from admin professionals already using AI to elevate their work Prompts you can copy, adapt, and test live Interactive exercises to build confidence fast A practical challenge to implement right after the session If you’ve been overwhelmed by AI, or underwhelmed by its impact, this session will change that. You'll leave with tools you can use today, and a mindset you’ll carry forward for the rest of your career. Justin Kabbani Career Bio: Justin Kabbani is one of Australia’s most in-demand AI trainers and keynote speakers, known for making AI feel simple, powerful, and immediately useful. He’s worked with brands like Uber, Treasury Wine Estates, and Udemy, helping their teams embed AI into daily workflows, strategic planning, and executive communication. Over the past two years, Justin has trained more than 2,000 professionals across Australia and beyond, consistently earning feedback like “mind-blowing,” and “game-changing”. His signature Prime, Prompt, Produce framework has transformed how business leaders, executive assistants, marketers, and teams think, work, and communicate with AI, without needing to be “tech people.” Justin believes AI isn’t here to replace people. It’s here to take the robotic work off our plate, so we can focus on what humans do best. LinkedIn: https://www.linkedin.com/in/justinkabbani/ Website: https://justinkabbani.com/ Speed Connections Networking Session Join us for Speed Connections, a lively 30-minute networking session designed to foster meaningful connections in a fun, fast-paced environment. Every 10 minutes, attendees will be placed into new breakout rooms with small groups, giving everyone the chance to meet a diverse range of peers. Each breakout session will feature engaging prompts to spark conversations and make networking enjoyable and memorable! Who will attend this event? Executive Assistant (EA) Personal Assistant (PA) Virtual Assistant (VA) Legal Secretary Legal Executive Assistant Administrative Assistant Office Manager Health Care Office Manager Chief of Staff Additional roles may be relevant depending on role responsibilities along with development opportunities. This workshop is open to females, male including trans women/males and non-binary professionals. Group Rate Discounts To discuss our group rates in more detail, please email support@elite-forums.com and provide the following: Group Number (How many would like to attend) Event Date (If numerous dates, please advise if we are splitting attendees across multiple dates) Attendee Contact details (Or request our Group Rate Document. Complete and return - we'll sort the rest.) Group discounts are on request - see below group rate discount brackets: 🧩 You just need one piece to come together - to unlock your Elite Potential. 🔑 Media outlets/organisations will not be permitted to attend this event.

Key Working
By Prima Cura Training
A key-worker role is to provide the best individual care for people they support and carry out effective assessment and support planning. Staff need to know how to motivate individuals to achieve their personal goals and understand how to advocate on their behalf. Staff also need to know how to improve communication between colleagues, individuals, other professionals, and contribute to service improvement.

Healthcare Hero Instructor Training Certification: Level 1
By HFX Training
At HFX Training, we are passionate about business simulations because they bring learning to life through hands-on experience. This Level 1 Certification Program is the first step in our Instructor Training Certification Pathway, equipping you to confidently use the Healthcare Hero simulation in your teaching environment. In this program, you will experience the simulation as a student, navigating its complexities and dynamics. Upon successfully completing Level 1, you’ll be ready to advance to Level 2 Training, where you will deepen your expertise in simulation facilitation and administration. The program is cohort-based, and the timetable is coordinated in advance through discussions with the HFX team to ensure maximum participation. For more information on the program structure, instructional materials, and certification requirements, please read on. What to Expect: The Healthcare Hero simulation places you in charge of a fictional hospital. Over eight simulation rounds - each representing one quarter of business operations - you will make strategic decisions to optimize patient care while managing staffing, capacity, quality, and finances. Throughout the simulation, you’ll navigate challenges like healthcare and economic crises, all while balancing the needs of multiple stakeholders. Your ultimate goal is to outperform competing hospitals managed by other participants in the program. Program and Certification Requirements This program equips you to confidently lead the simulation by requiring more than attendance or participation. To earn certification, you must: Thoroughly Prepare: Review all instructional materials and the scenario manual before the course begins. Fully Participate: Attend all Zoom sessions and complete each simulation round with focus and effort. Demonstrate Mastery: Show a comprehensive understanding of the simulation’s dynamics, decision-making processes, and strategies during practice and live rounds. Engage in Reflection: Actively participate in debrief sessions, assess your performance, and identify strategies for improvement. This certification ensures you are equipped to facilitate this complex simulation with confidence. Auditing the course is an option, but participants who choose to audit will not receive certification. Program Format The program is delivered intensively over one or more Zoom sessions, totaling six hours. This compressed format demands your full attention and focus to successfully navigate the simulation’s complexities. Eligibility Requirements: By registering for this training program, you acknowledge the following: You have discussed your needs with the HFX team and confirmed that the simulation aligns with your class or program objectives. You are an instructor at an academic institution. You agree to the confidentiality terms and commit not to distribute, disclose, or replicate any program content for purposes outside of this training. This program is offered in goodwill to academic instructors as a resource to enhance their teaching. As part of this agreement, you understand that all materials, including the simulation itself, are proprietary to HFX and its partners. Any use of these materials for purposes beyond this program, such as developing similar tools or simulations, is strictly prohibited. Course Structure: After registering, you will gain immediate access to the simulation’s instructional materials. This includes: The Scenario Manual: Your guide to understanding the game. The Capacity Planner Worksheet and Financial Planning Worksheet: Tools to help you strategize. The Strategy Planning Exercise: Designed to align your decisions with overall objectives. The Portal Guide: A walkthrough of the simulation platform. The program unfolds in four key phases: Phase 1: Pre Zoom Call / Study / Set Up Register using the button at the bottom of this page. Review the instructional materials thoroughly. Once the cohort is finalized, you will be sent your login credentials for the simulation itself. Try to submit decisions for the first practice round using the simulation portal at www.simulationportal.com. Phase 2: Play We run two practice rounds over the first 2 hours of the zoom call. This allows you to familiarize yourself with the platform and decision-making process, and think through what your strategy might be in the live game. The simulation resets ("zeroed") after the practice rounds. A brief session will clarify lessons learned and expectations for the live rounds. Over eight rounds, you’ll compete against other participants while refining your strategic decisions. Phase 3: Feedback Reflect on your performance during a structured debrief, including: Strengths and areas for improvement. Insights into competitors’ strategies. Strategic lessons learned, and applicability to local healthcare organizations. Phase 4: Implementation Planning Work with the HFX team to plan your first application of the simulation in a teaching environment. Certification Outcome Upon completing this program, you will earn the HFX Instructor Training Certification: Level One, signifying your expertise in conducting impactful simulation-based training using Healthcare Hero.

Team Leader/Supervisor Level 3
By Rachel Hood
Managing teams and projects to meet a private, public or voluntary organisation's goals.
Unconscious bias
By Underscore Group
Understand the biases we all have and the impact they can have in the workplace. Look at how to minimise their impact on others and the organisation. Course overview Duration: 1 day (6.5 hours) The purpose of this course is to help individuals understand and recognise their own unconscious biases, and to provide strategies on how to minimise the impact of those biases in the workplace. The course will provide an overview of what unconscious bias is, its prevalence and impact, and ways to mitigate its effects. Objectives By the end of the course you will be able to: Define unconscious bias and recognise different types of bias Understand how unconscious bias affects decision-making and behaviours in the workplace Identify their own unconscious biases Understand the impact of unconscious bias on individual and team performance Apply strategies to mitigate the effects of unconscious bias in the workplace Content Module 1: Introduction to Unconscious Bias Definition of unconscious bias History and prevalence of unconscious bias Different types of unconscious bias (e.g. affinity bias, confirmation bias) Module 2: Understanding the Impact of Unconscious Bias How unconscious bias affects decision-making and behaviours in the workplace Examples of unconscious bias in the workplace Impact of unconscious bias on individual and team performance Module 3: Recognising Your Own Unconscious Biases Identifying personal biases Tools to recognise and minimise unconscious biases Module 4: Mitigating the Impact of Unconscious Bias in the Workplace Best practices for reducing unconscious bias in the workplace Strategies for managerial and executive leadership to combat unconscious bias Tips for creating a culture of inclusion and diversity

Tableau Training On Tap - Fast Track
By Tableau Training Uk
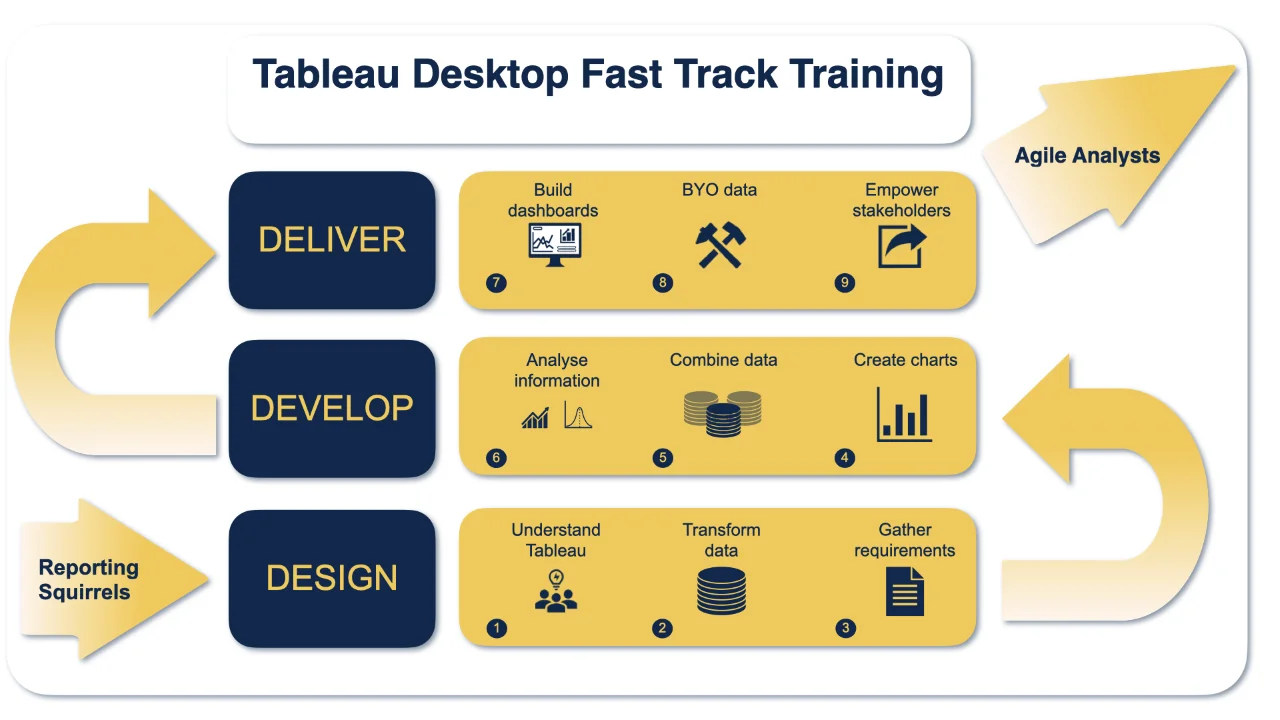
Tableau is an intuitive and simple tool to learn. This Tableau training course is a jumpstart to getting report writers and analysts who are self-taught or have no previous knowledge to being productive. It covers everything from connecting to data, through to creating interactive dashboards with a range of visualisations in three days. Having a quick turnaround from starting to use Tableau, to getting real, actionable insights means that you get a swift return on your investment. At the end of this course, you will be able to communicate insights more effectively, enabling your organisation to make better decisions, quickly. This accelerated approach is key to getting engagement from within your organisation so everyone can immediately see and feel the impact of the data and insights you create. Our Tableau Desktop Fast Track course combines all of our Foundation (Fundamentals) and Analyst (Intermediate) content into a 3 day live online course with added access to online bonus content of 3 additional modules. Gathering Requirements, Bring Your Own Data and Engaging Users. What do you get? This course is delivered live virtually and has all material provided through our online portal, together with email support and live coaching sessions. The full program includes all of the following elements: 3 days of live and interactive instructor-led sessions delivered by an expert Tableau Trainer 6 weeks access to our live coaching program delivered by expert Tableau coaches 50+ practical exercises to practice what you learn 12 months access to video’s that walk you through the theory and exercise solutions Practical advice, tools and resources for using Tableau in the real world The three additional online modules provide:Clarity on the approach to gathering dashboard requirements in a way that can be translated into dashboard designs.An agile and iterative development process that delivers products that meet user needs more quickly and effectively.An understanding of how end users will interact with dashboards to ensure that designers deliver actionable results. THE SYLLABUS PHASE 1: DESIGN MODULE 1: UNDERSTAND TABLEAU What is possible How does Tableau deal with data Know your way around Review of Type Conversions How do we format charts Dashboard basics – My first Dashboard MODULE 2: TRANSFORM DATA Connecting to and setting up data in Tableau Modifying data attributes How Do I Structure my Data – Groups & Hierarchies, Visual Groups How Tableau Deals with Dates – Using Discrete and Continuous Dates, Custom Dates How do I create calculated fields and why? – Creating Calculated Fields, Types of calculated fields, Row Level v Aggregations, Aggregating dimensions in calculations, Changing the Level of Detail (LOD) of calculations – What, Why, How MODULE 3: GATHER REQUIREMENTS(ONLINE CONTENT ONLY) Brainstorm and assess possible priorities Pitfalls to avoid Gather requirements PHASE 2: DEVELOP MODULE 4: CREATE CHARTS Charts that Compare Multiple Measures – Measure Names and Measure Values, Shared Axis Charts, Dual Axis Charts, Scatter Plots Showing progress over time Creating Tables – Creating Tables, Highlight Tables, Heat Maps Showing Relational & Proportional Data – Pie Charts, Donut Charts, Tree Maps Making things dynamic with parameters MODULE 5: COMBINE DATA Relationships Joining Tables – Join Types, Joining tables within the same database, cross database joins, join calculations Blending – How to create a blend with common fields, Custom defined Field relationships and mismatched element names, Calculated fields in blended data sources Unions – Manual Unions and mismatched columns, Wildcard unions Data Extracts – Creating & Editing Data extracts MODULE 6: ANALYSE INFORMATION Table Calculations Sets, Reference Lines, Trends and Forecasting Answering spatial questions – Mapping, Creating a choropleth (filled) map, Using your own images for spatial analysis, Mapping with spatial files Advanced charts Bar in Bar charts Bullet graphs Creating Bins and Histograms Creating a Box & Whisker plot Viz in Tooltips PHASE 3: DESIGN MODULE 7: BUILD DASHBOARDS Using the Dashboard Interface Device layouts Dashboard Actions – Set actions, Parameter actions Viz in Tooltips for Dashboards Dashboard containers – Horizontal & Vertical containers, Hidden containers Navigate between dashboards Telling data driven stories MODULE 8: BRING YOUR OWN DATA Design Best Practices & Resources Wireframe templates Questions Process Start building and testing MODULE 9: EMPOWER STAKEHOLDERS What is Tableau Server Publishing & permissions How can your users engage with content The Tableau ecosystem Review your progress Your next steps HOW MUCH OF YOUR TIME WILL THIS TAKE? Delegates are also provided 6 weeks access to our Tableau Coaching. We run Live Q&A sessions from 4pm-5pm on a Monday (Connecting to Data and Calculated Fields), 2pm-3pm Friday (Creating Charts) & 4pm-5pm Friday (Dashboard Design). The coaching helps delegates to transition from the theory of using Tableau to its practical use. We’d be expecting them to apply the exercises you’ll be doing during the course, onto your own data after the course. In our experience, this is the best way to increase both understanding and long term memory retention. The live coaching also acts as a troubleshooting platform for any practical issues that delegates need to overcome in the real world. Delegates also have 12 months access to all of the training material covered in the course in the form of an online portal (this includes theory videos, exercise solution videos, exercise materials and even quizzes). We have a growing LinkedIn community that delegates are encouraged to join and participate in. We regularly post useful blog posts and additional training that will enhance the Tableau journey and understanding. We help teams using Tableau to transform in the following ways : From a disjointed understanding of Tableau – To being familiar with Tableau terminology and capability From ad-hoc data uploads and error prone calculations – To reusable data connections and robust metrics From disjointed stakeholder questions – To clear and concise requirements that lead to decision making From being unsure how difficult Tableau will be to learn – To being able to develop standard charts and tables in Tableau with dynamic reporting capabilities From manually combining data for each analytical task – To dynamically combining data from multiple tables for analysis From being unsure how to answer analytical questions and what options there are – To being equipped with multiple actionable, dynamic, analytical use cases From not knowing Why, When and How to create Dashboards or Story’s – To being able to combine analysis to answer complex questions and tell data driven stories From using demo data theory – To Delivering value [Answering questions] on their own data From spending lots of time answering colleagues ad-hoc (data) questions – To empowering stakeholders in answering ad-hoc queries and reducing the time to analyse and steer the business
Finance for Non Financial Managers
By Underscore Group
Learn the basics of financial awareness and better understand the language used by accountants and how financial statements fit together within organisations. Course overview Duration: 2 days (13 hours) This workshop will provide participants with a grasp of basic financial awareness, to help them to better understand the language used by accountants and how financial statements fit together. Training is done in a jargon-free way that is aimed building attendees’ confidence in using financial terms and concepts within their organisation. Competent financial management has many aspects, it is wide reaching and requires multiple skills but if participants work to become organised and effective in planning, these skills can be easily acquired. There is a misconception that to be a good operational manager dealing with financial decisions people must be accounting or numerical geniuses. There are basic skills that attendees can easily learn that will support them in those areas. Objectives By the end of the course you will be able to: Identify the importance of financial management and its impact Identify the link between financial information and decision making Set, manage, monitor and review budgets Analyse financial statements Demonstrate the link between the statements, budgets and decision making. Content Financial Management Budgeting process (generic / client specific if possible) Forecasting and re forecasting process The need for accurate forecasting Accrual v cash accounting revisited Financial Objectives of the business Users of the accounts Financial Tools Depreciation and Amortisation Accruals and Prepayments Deferred and Accrued Income Costs, Opex and Capex Financial Statements The Income Statement The Balance Sheet Understanding capital employed The relationship between balance sheet and income statement The cash flow statement Profitability: gross, operating and net margins Review of client’s management information reports Building the Business Case Break even analysis Discounted Cash Flow Discount factors Net Present Value (NPV) Internal Rate of Return (IRR)