- Professional Development
- Medicine & Nursing
- Arts & Crafts
- Health & Wellbeing
- Personal Development
296 Data Structure courses
CompTIA CySA+ Cybersecurity Analyst (CS0-002)
By Course Cloud
Course Overview Learn how to safeguard operating systems and protect personal data on any IT infrastructure with this training for CompTIA CySA+ Cybersecurity Analyst (CS0-002). Passing a CompTIA CySA+ exam will certify and validate your technical skills, allowing you to become an accomplished analyst who will excel in the IT industry. This course prepares you for the exam and also primes you for dealing with the world of hackers, cybersecurity, threat hunting, and digital forensics? This CompTIA CySA+ tutorial focuses on the competencies needed to apply behavioural analytics in order to prevent, detect and combat all manner of cybersecurity threats. You will be taught the importance of gathering threat intelligence, providing practical security solutions, and establishing a proactive wall of safety around any data structure. This is the complete learning package to complete your cybersecurity skillset and turn you into a senior analyst. Computer safety has never been more critical, so enrol now and learn how to protect others from the 'black hats' and Internet criminals. This best selling CompTIA CySA+ Cybersecurity Analyst (CS0-002) has been developed by industry professionals and has already been completed by hundreds of satisfied students. This in-depth CompTIA CySA+ Cybersecurity Analyst (CS0-002) is suitable for anyone who wants to build their professional skill set and improve their expert knowledge. The CompTIA CySA+ Cybersecurity Analyst (CS0-002) is CPD-accredited, so you can be confident you're completing a quality training course will boost your CV and enhance your career potential. The CompTIA CySA+ Cybersecurity Analyst (CS0-002) is made up of several information-packed modules which break down each topic into bite-sized chunks to ensure you understand and retain everything you learn. After successfully completing the CompTIA CySA+ Cybersecurity Analyst (CS0-002), you will be awarded a certificate of completion as proof of your new skills. If you are looking to pursue a new career and want to build your professional skills to excel in your chosen field, the certificate of completion from the CompTIA CySA+ Cybersecurity Analyst (CS0-002) will help you stand out from the crowd. You can also validate your certification on our website. We know that you are busy and that time is precious, so we have designed the CompTIA CySA+ Cybersecurity Analyst (CS0-002) to be completed at your own pace, whether that's part-time or full-time. Get full course access upon registration and access the course materials from anywhere in the world, at any time, from any internet-enabled device. Our experienced tutors are here to support you through the entire learning process and answer any queries you may have via email.

Pandas for Beginners - A Quick Guide
By Packt
This beginner's level course on Pandas acquaints you to the data analysis fundamentals using Pandas library and working with Pandas primary data structures, Series and DataFrame. Learn all about data input using indexing and filtering, data preprocessing, and handle missing values and duplicate rows to transform your data more efficiently with the help of this hands-on course.
Modern JavaScript From The Beginning
By Packt
Learn and Build Projects with Pure JavaScript (No Frameworks or Libraries)

Becoming a Data Quality Expert
By IIL Europe Ltd
Becoming a Data Quality Expert Data science is an exploding field with tremendous demand. Having high quality data is an absolute must for any business today and data informs every decision a business must make. But what if you have poor quality data? What if your company acquired another company and the data structure does not match? What if you have large gaps in the data you have vs. what you need?Imagine yourself as an IT project/program manager who has run many engagements for the business. You have great PM skills and you run your agenda with the precision of a Swiss watch. But you now have to run Data Quality for your organization. Can you just program manage this and be fine? What will be different about this than any other IT project?Wake-up call: a WHOLE LOT! You must acquire a lot of new skills and you must become a data expert as quickly as possible. I want to share with you my journey and experience. I have had to go from deeply technical in some IT areas, to project/program managing general IT projects, to gaining specialized skills in data quality. I will share with you my assessment, gap analysis and mitigation strategy that transformed me into a data quality expert.

PL-300T00 Microsoft Power BI Data Analyst
By Nexus Human
Duration 3 Days 18 CPD hours This course is intended for The audience for this course are data professionals and business intelligence professionals who want to learn how to accurately perform data analysis using Power BI. This course is also targeted toward those individuals who develop reports that visualize data from the data platform technologies that exist on both in the cloud and on-premises. This course covers the various methods and best practices that are in line with business and technical requirements for modeling, visualizing, and analyzing data with Power BI. The course will show how to access and process data from a range of data sources including both relational and non-relational sources. Finally, this course will also discuss how to manage and deploy reports and dashboards for sharing and content distribution. Prerequisites Understanding core data concepts. Knowledge of working with relational data in the cloud. Knowledge of working with non-relational data in the cloud. Knowledge of data analysis and visualization concepts. DP-900T00 Microsoft Azure Data Fundamentals is recommended 1 - Discover data analysis Overview of data analysis Roles in data Tasks of a data analyst 2 - Get started building with Power BI Use Power BI Building blocks of Power BI Tour and use the Power BI service 3 - Get data in Power BI Get data from files Get data from relational data sources Create dynamic reports with parameters Get data from a NoSQL database Get data from online services Select a storage mode Get data from Azure Analysis Services Fix performance issues Resolve data import errors 4 - Clean, transform, and load data in Power BI Shape the initial data Simplify the data structure Evaluate and change column data types Combine multiple tables into a single table Profile data in Power BI Use Advanced Editor to modify M code 5 - Design a semantic model in Power BI Work with tables Create a date table Work with dimensions Define data granularity Work with relationships and cardinality Resolve modeling challenges 6 - Add measures to Power BI Desktop models Create simple measures Create compound measures Create quick measures Compare calculated columns with measures 7 - Add calculated tables and columns to Power BI Desktop models Create calculated columns Learn about row context Choose a technique to add a column 8 - Use DAX time intelligence functions in Power BI Desktop models Use DAX time intelligence functions Additional time intelligence calculations 9 - Optimize a model for performance in Power BI Review performance of measures, relationships, and visuals Use variables to improve performance and troubleshooting Reduce cardinality Optimize DirectQuery models with table level storage Create and manage aggregations 10 - Design Power BI reports Design the analytical report layout Design visually appealing reports Report objects Select report visuals Select report visuals to suit the report layout Format and configure visualizations Work with key performance indicators 11 - Configure Power BI report filters Apply filters to the report structure Apply filters with slicers Design reports with advanced filtering techniques Consumption-time filtering Select report filter techniques Case study - Configure report filters based on feedback 12 - Enhance Power BI report designs for the user experience Design reports to show details Design reports to highlight values Design reports that behave like apps Work with bookmarks Design reports for navigation Work with visual headers Design reports with built-in assistance Tune report performance Optimize reports for mobile use 13 - Perform analytics in Power BI Explore statistical summary Identify outliers with Power BI visuals Group and bin data for analysis Apply clustering techniques Conduct time series analysis Use the Analyze feature Create what-if parameters Use specialized visuals 14 - Create and manage workspaces in Power BI Distribute a report or dashboard Monitor usage and performance Recommend a development life cycle strategy Troubleshoot data by viewing its lineage Configure data protection 15 - Manage semantic models in Power BI Use a Power BI gateway to connect to on-premises data sources Configure a semantic model scheduled refresh Configure incremental refresh settings Manage and promote semantic models Troubleshoot service connectivity Boost performance with query caching (Premium) 16 - Create dashboards in Power BI Configure data alerts Explore data by asking questions Review Quick insights Add a dashboard theme Pin a live report page to a dashboard Configure a real-time dashboard Set mobile view 17 - Implement row-level security Configure row-level security with the static method Configure row-level security with the dynamic method Additional course details: Nexus Humans PL-300T00: Microsoft Power BI Data Analyst training program is a workshop that presents an invigorating mix of sessions, lessons, and masterclasses meticulously crafted to propel your learning expedition forward. This immersive bootcamp-style experience boasts interactive lectures, hands-on labs, and collaborative hackathons, all strategically designed to fortify fundamental concepts. Guided by seasoned coaches, each session offers priceless insights and practical skills crucial for honing your expertise. Whether you're stepping into the realm of professional skills or a seasoned professional, this comprehensive course ensures you're equipped with the knowledge and prowess necessary for success. While we feel this is the best course for the PL-300T00: Microsoft Power BI Data Analyst course and one of our Top 10 we encourage you to read the course outline to make sure it is the right content for you. Additionally, private sessions, closed classes or dedicated events are available both live online and at our training centres in Dublin and London, as well as at your offices anywhere in the UK, Ireland or across EMEA.

Data Wrangling with Python
By Nexus Human
Duration 3 Days 18 CPD hours This course is intended for Data Wrangling with Python takes a practical approach to equip beginners with the most essential data analysis tools in the shortest possible time. It contains multiple activities that use real-life business scenarios for you to practice and apply your new skills in a highly relevant context. Overview By the end of this course, you will be confident in using a diverse array of sources to extract, clean, transform, and format your data efficiently. In this course you will start with the absolute basics of Python, focusing mainly on data structures. Then you will delve into the fundamental tools of data wrangling like NumPy and Pandas libraries. You'll explore useful insights into why you should stay away from traditional ways of data cleaning, as done in other languages, and take advantage of the specialized pre-built routines in Python.This combination of Python tips and tricks will also demonstrate how to use the same Python backend and extract/transform data from an array of sources including the Internet, large database vaults, and Excel financial tables. To help you prepare for more challenging scenarios, you'll cover how to handle missing or wrong data, and reformat it based on the requirements from the downstream analytics tool. The course will further help you grasp concepts through real-world examples and datasets. Introduction to Data Structure using Python Python for Data Wrangling Lists, Sets, Strings, Tuples, and Dictionaries Advanced Operations on Built-In Data Structure Advanced Data Structures Basic File Operations in Python Introduction to NumPy, Pandas, and Matplotlib NumPy Arrays Pandas DataFrames Statistics and Visualization with NumPy and Pandas Using NumPy and Pandas to Calculate Basic Descriptive Statistics on the DataFrame Deep Dive into Data Wrangling with Python Subsetting, Filtering, and Grouping Detecting Outliers and Handling Missing Values Concatenating, Merging, and Joining Useful Methods of Pandas Get Comfortable with a Different Kind of Data Sources Reading Data from Different Text-Based (and Non-Text-Based) Sources Introduction to BeautifulSoup4 and Web Page Parsing Learning the Hidden Secrets of Data Wrangling Advanced List Comprehension and the zip Function Data Formatting Advanced Web Scraping and Data Gathering Basics of Web Scraping and BeautifulSoup libraries Reading Data from XML RDBMS and SQL Refresher of RDBMS and SQL Using an RDBMS (MySQL/PostgreSQL/SQLite) Application in real life and Conclusion of course Applying Your Knowledge to a Real-life Data Wrangling Task An Extension to Data Wrangling
Python Intermediate Training Course
By One Education
Step beyond the basics and dive deeper into Python with our Intermediate Training Course, designed for those who have already dipped their toes into coding and are ready to advance their skills. This course carefully guides you through more intricate concepts such as object-oriented programming, data manipulation, and working with modules and libraries—all essential tools in the modern Python programmer’s toolkit. Whether you want to enhance your coding fluency or prepare for more specialised projects, this course offers the perfect balance of theory and thoughtful explanation, ensuring clarity without drowning you in jargon. Crafted for learners who appreciate precision and clarity, the course content balances informative detail with a touch of wit to keep you engaged without ever feeling like you’re slogging through a manual. Ideal for self-paced study, it fits neatly around your schedule and learning preferences. By the end, you’ll be confidently handling Python’s intermediate-level challenges and writing code that’s not only functional but a little bit clever too. Ready to level up your programming skills? This course is your next smart step. Learning Outcomes: Gain a deeper understanding of intermediate-level Python concepts. Learn how to work with matrices and manipulate lists and dictionaries. Discover how to use Python to solve complex problems and write efficient and elegant code. Understand how to manipulate data structures and perform advanced data analysis tasks. Learn how to use Python to build real-world projects and applications. The Python Intermediate Training course is designed to provide you with the skills and knowledge you need to become a proficient Python developer. Whether you're a beginner or an experienced programmer looking to enhance your Python skills, this course is perfect for you. Starting with the basics of matrices and lists and moving on to more advanced topics, such as dictionaries and data analysis, this course covers everything you need to know to become a proficient Python developer. You'll learn how to manipulate data structures, perform advanced data analysis tasks, and use Python to build real-world projects and applications. â±â± Python Intermediate Training Course Curriculum Section 01: Introduction Course Introduction Section 02: Matrix in Python Working on Matrix in Python Working on Matrix in Python Continued Performing Sort Section 03: Working on List in Python Merging to Dictionaries Concatenation of List Example Excepting Values in List and Adding those Using for Loop Excepting Values in List and Adding Those Using While Loop Performing Arithmetic Operation on List Data Structure in Python Data Structure in Python Continued Section 04: Lists & Dictionaries in Python List and Dictionary in Python List and Dictionary in Python Continued Various Sorting Methods in Python Part 1 Various Sorting Methods in Python Part 2 Binary Search Example Reversing a String Dictionary Examples More on List and Dictionary Examples String Examples How is the course assessed? Upon completing an online module, you will immediately be given access to a specifically crafted MCQ test. For each test, the pass mark will be set to 60%. Exam & Retakes: It is to inform our learners that the initial exam for this online course is provided at no additional cost. In the event of needing a retake, a nominal fee of £9.99 will be applicable. Certification Upon successful completion of the assessment procedure, learners can obtain their certification by placing an order and remitting a fee of __ GBP. £9 for PDF Certificate and £15 for the Hardcopy Certificate within the UK ( An additional £10 postal charge will be applicable for international delivery). CPD 10 CPD hours / points Accredited by CPD Quality Standards Who is this course for? Python beginners who want to take their skills to the next level. Experienced programmers who want to expand their Python skills and knowledge. Data analysts who want to use Python for advanced data analysis tasks. Entrepreneurs who want to develop their own Python-based applications. Students who want to enhance their Python skills and prepare for a career in programming. Requirements There are no formal entry requirements for the course, with enrollment open to anyone! Career path Python Developer: £28,000 - £55,000 Data Analyst: £24,000 - £45,000 Software Engineer: £28,000 - £60,000 Technical Lead: £40,000 - £90,000 Chief Technology Officer: £90,000 - £250,000 Certificates Certificate of completion Digital certificate - £9 You can apply for a CPD Accredited PDF Certificate at the cost of £9. Certificate of completion Hard copy certificate - £15 Hard copy can be sent to you via post at the expense of £15.

The Complete Python and PostgreSQL Developer Course
By Packt
Build 9 projects to master 2 essential and modern technologies: Python and PostgreSQL
Advanced Visualization with Power BI (AVIAD)
By Online Productivity Training
OVERVIEW Prerequisites—DIAD training or equivalent working experience This one-day course will cover Power BI report layouts and structure the agile process to creating Power BI data visualizations. It will help attendees to understand the art behind visualizations, the implications behind choosing the right charts, the impact of color, shape, and size, and finally the use of Power BI custom visuals. The course includes various design patterns of dashboards and reports, as well as best practices for authoring great reports and dashboards for business users. The course content is managed by the Power BI engineering team at Microsoft. There is no exam associated with the course. COURSE BENEFITS: Understand the need for storytelling with data Understand the agile process to creating Power BI data visualizations Understand the art behind visualizations Gain familiarity with Power BI report layouts and structure Understand implications behind choosing the right charts Gain familiarity with using Power BI custom visuals WHO IS THE COURSE FOR? Power BI report developers who wish to improve the aesthetic quality of their reports Power BI and other BI practitioners who would like to understand more about the theory of data visualization BI practitioners who wish to create reports that communicate the meaning behind the data more clearly Power BI users who would like to explore the types of chart and visual available that answer different types of business question COURSE OUTLINE Module 1 What Is Storytelling With Data? Volume, Velocity and Variety The importance of business questions What is a story in this context? Module 2 The Science Behind Data Visualization Basic problems to avoid Memory and visualization Ways to spark iconic, short-term and long-term memory Module 3 The Process Behind Data Visualization Using an agile approach to report development Data structure and data grain Converting the story to a data model Module 4 Dashboards And Reports Terminology and definitions Dashboard layout and structure Report layout and structure Storyboarding Drill-through, bookmarks, toggles and tooltips Module 5 Chart Selection Charts for comparison Time series Proportions Constructing effective tables, cards and slicers Scatterplots Module 6 Accessibility And Custom Visuals Report accessibility checklists Custom visuals Creating a custom R visual Charticulator Module 7 Publishing And Formatting Colour schemes Making a Power BI theme Use of fonts, icons and symbols Sizing dashboard and report tiles Sparklines, hyperlinks and images Module 8 Report Authoring - Best Practices Design thought process The audience Defining the platform environment The user experience Visualization Implementation and testing Optimization Module 9 Dashboard And Goals Design Tips and tricks Best practices for dashboard design Tracking business metrics with goals

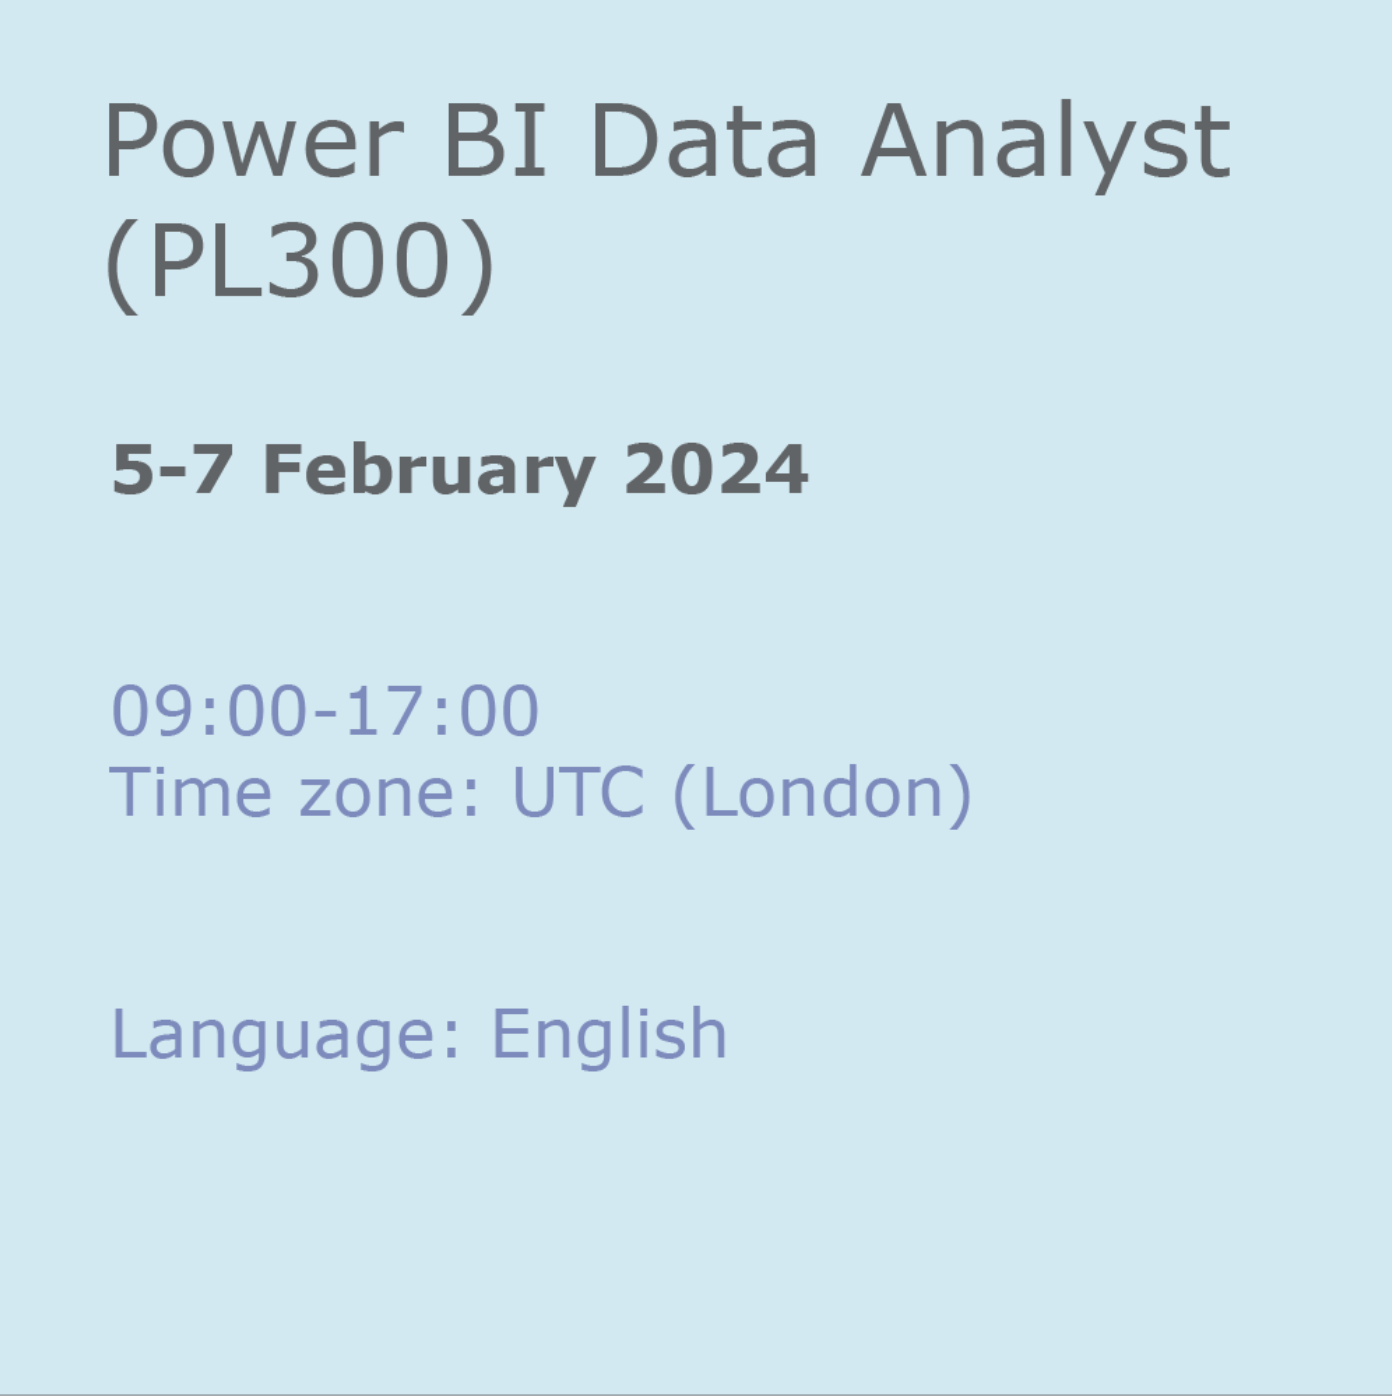
Power BI Data Analyst (PL300)
By Online Productivity Training
OVERVIEW This official Microsoft Power BI training course will teach you how to connect to data from many sources, clean and transform it using Power Query, create a data model consisting of multiple tables connected with relationships and build visualisations and reports to show the patterns in the data. The course will explore formulas created using the DAX language, including the use of advanced date intelligence calculations. Additional visualisation features including interactivity between the elements of a report page are covered as well as parameters and row-level security, which allows a report to be tailored according to who is viewing it. The course will also show how to publish reports and dashboards to a workspace on the Power BI Service. COURSE BENEFITS: Learn how to clean, transform, and load data from many sources Use database queries in Power Query to combine tables using append and merge Create and manage a data model in Power BI consisting of multiple tables connected with relationships Build Measures and other calculations in the DAX language to plot in reports Manage advanced time calculations using date tables Optimise report calculations using the Performance Analyzer Manage and share report assets to the Power BI Service Prepare for the official Microsoft PL-300 exam using Microsoft Official Courseware WHO IS THE COURSE FOR? Data Analysts with little or no experience of Power BI who wish to upgrade their knowledge to include Business Intelligence Management Consultants who need to conduct rapid analysis of their clients’ data to answer specific business questions Analysts who need to upgrade their organisation from a simple Excel or SQL-based management reporting system to a dynamic BI system Data Analysts who wish to develop organisation-wide reporting in the form of web reports or phone apps Marketers in data-intensive organisations who wish to build visually appealing, dynamic charts for their stakeholders to use COURSE OUTLINE Module 1 Getting Started With Microsoft Data Analytics Data analytics and Microsoft Getting Started with Power BI Module 2 Get Data In Power BI Get data from various data sources Optimize performance Resolve data errors Lab: Prepare Data in Power BI Desktop Module 3 Clean, Transform And Load Data In Power BI Data shaping Data profiling Enhance the data structure Lab: Load Data in Power BI Desktop Module 4 Design A Data Model In Power BI Introduction to data modelling Working with Tables Dimensions and Hierarchies Lab: Model Data in Power BI Desktop Module 5 Create Model Calculations Using DAX In Power BI Introduction to DAX Real-time Dashboards Advanced DAX Lab 1: Create DAX Calculations in Power BI Desktop, Part 1 Lab 2: Create DAX Calculations in Power BI Desktop, Part 2 Module 6 Optimize Model Performance Optimize the data model for performance Optimize DirectQuery models Module 7 Create Reports Design a Report Enhance the Report Lab 1: Design a Report in Power BI Desktop, Part 1 Lab 2: Design a Report in Power BI Desktop, Part 2 Module 8 Create Dashboards Create a Dashboard Real-time Dashboards Enhance a Dashboard Lab: Create a Power BI Dashboard Module 9 Perform Advanced Analytics Advanced analytics Data Insights through AI Visuals Lab: Perform Data Analysis in Power BI Desktop Module 10 Create And Manage Workspaces Creating Workspaces Sharing and managing assets Module 11 Manage Datasets In Power BI Parameters Datasets Module 12 Row-Level Security Security in Power BI Lab: Enforce Row-Level Security