- Professional Development
- Medicine & Nursing
- Arts & Crafts
- Health & Wellbeing
- Personal Development
115 Data Science courses in Cardiff delivered Live Online
Certified Data Science Practitioner
By Mpi Learning - Professional Learning And Development Provider
This course will enable you to bring value to the business by putting data science concepts into practice. Data is crucial for understanding where the business is and where it's headed. Not only can data reveal insights, but it can also inform - by guiding decisions and influencing day-to-day operations.

Data Science for Business Professionals
By Mpi Learning - Professional Learning And Development Provider
The ability to identify and respond to changing trends is a hallmark of a successful business. Whether those trends are related to customers and sales, or to regulatory and industry standards, businesses are wise to keep track of the variables that can affect the bottom line. In today's business landscape, data comes from numerous sources and in diverse forms.

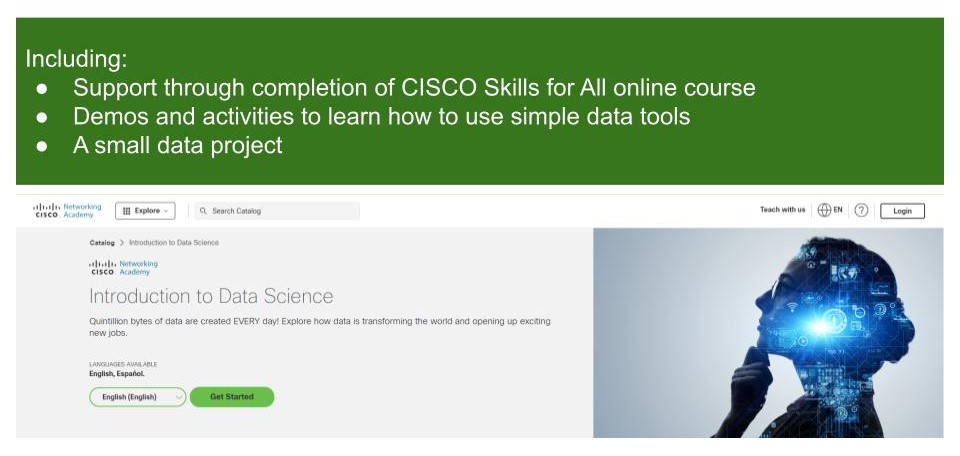
Introduction to Data Science
By futureCoders SE
Learn the basics of Data Science, combining a supported #CISCO Skills for All online course with practical learning and a project to help consolidate the learning.
Python With Data Science
By Nexus Human
Duration 2 Days 12 CPD hours This course is intended for Audience: Data Scientists, Software Developers, IT Architects, and Technical Managers. Participants should have the general knowledge of statistics and programming Also familiar with Python Overview ? NumPy, pandas, Matplotlib, scikit-learn ? Python REPLs ? Jupyter Notebooks ? Data analytics life-cycle phases ? Data repairing and normalizing ? Data aggregation and grouping ? Data visualization ? Data science algorithms for supervised and unsupervised machine learning Covers theoretical and technical aspects of using Python in Applied Data Science projects and Data Logistics use cases. Python for Data Science ? Using Modules ? Listing Methods in a Module ? Creating Your Own Modules ? List Comprehension ? Dictionary Comprehension ? String Comprehension ? Python 2 vs Python 3 ? Sets (Python 3+) ? Python Idioms ? Python Data Science ?Ecosystem? ? NumPy ? NumPy Arrays ? NumPy Idioms ? pandas ? Data Wrangling with pandas' DataFrame ? SciPy ? Scikit-learn ? SciPy or scikit-learn? ? Matplotlib ? Python vs R ? Python on Apache Spark ? Python Dev Tools and REPLs ? Anaconda ? IPython ? Visual Studio Code ? Jupyter ? Jupyter Basic Commands ? Summary Applied Data Science ? What is Data Science? ? Data Science Ecosystem ? Data Mining vs. Data Science ? Business Analytics vs. Data Science ? Data Science, Machine Learning, AI? ? Who is a Data Scientist? ? Data Science Skill Sets Venn Diagram ? Data Scientists at Work ? Examples of Data Science Projects ? An Example of a Data Product ? Applied Data Science at Google ? Data Science Gotchas ? Summary Data Analytics Life-cycle Phases ? Big Data Analytics Pipeline ? Data Discovery Phase ? Data Harvesting Phase ? Data Priming Phase ? Data Logistics and Data Governance ? Exploratory Data Analysis ? Model Planning Phase ? Model Building Phase ? Communicating the Results ? Production Roll-out ? Summary Repairing and Normalizing Data ? Repairing and Normalizing Data ? Dealing with the Missing Data ? Sample Data Set ? Getting Info on Null Data ? Dropping a Column ? Interpolating Missing Data in pandas ? Replacing the Missing Values with the Mean Value ? Scaling (Normalizing) the Data ? Data Preprocessing with scikit-learn ? Scaling with the scale() Function ? The MinMaxScaler Object ? Summary Descriptive Statistics Computing Features in Python ? Descriptive Statistics ? Non-uniformity of a Probability Distribution ? Using NumPy for Calculating Descriptive Statistics Measures ? Finding Min and Max in NumPy ? Using pandas for Calculating Descriptive Statistics Measures ? Correlation ? Regression and Correlation ? Covariance ? Getting Pairwise Correlation and Covariance Measures ? Finding Min and Max in pandas DataFrame ? Summary Data Aggregation and Grouping ? Data Aggregation and Grouping ? Sample Data Set ? The pandas.core.groupby.SeriesGroupBy Object ? Grouping by Two or More Columns ? Emulating the SQL's WHERE Clause ? The Pivot Tables ? Cross-Tabulation ? Summary Data Visualization with matplotlib ? Data Visualization ? What is matplotlib? ? Getting Started with matplotlib ? The Plotting Window ? The Figure Options ? The matplotlib.pyplot.plot() Function ? The matplotlib.pyplot.bar() Function ? The matplotlib.pyplot.pie () Function ? Subplots ? Using the matplotlib.gridspec.GridSpec Object ? The matplotlib.pyplot.subplot() Function ? Hands-on Exercise ? Figures ? Saving Figures to File ? Visualization with pandas ? Working with matplotlib in Jupyter Notebooks ? Summary Data Science and ML Algorithms in scikit-learn ? Data Science, Machine Learning, AI? ? Types of Machine Learning ? Terminology: Features and Observations ? Continuous and Categorical Features (Variables) ? Terminology: Axis ? The scikit-learn Package ? scikit-learn Estimators ? Models, Estimators, and Predictors ? Common Distance Metrics ? The Euclidean Metric ? The LIBSVM format ? Scaling of the Features ? The Curse of Dimensionality ? Supervised vs Unsupervised Machine Learning ? Supervised Machine Learning Algorithms ? Unsupervised Machine Learning Algorithms ? Choose the Right Algorithm ? Life-cycles of Machine Learning Development ? Data Split for Training and Test Data Sets ? Data Splitting in scikit-learn ? Hands-on Exercise ? Classification Examples ? Classifying with k-Nearest Neighbors (SL) ? k-Nearest Neighbors Algorithm ? k-Nearest Neighbors Algorithm ? The Error Rate ? Hands-on Exercise ? Dimensionality Reduction ? The Advantages of Dimensionality Reduction ? Principal component analysis (PCA) ? Hands-on Exercise ? Data Blending ? Decision Trees (SL) ? Decision Tree Terminology ? Decision Tree Classification in Context of Information Theory ? Information Entropy Defined ? The Shannon Entropy Formula ? The Simplified Decision Tree Algorithm ? Using Decision Trees ? Random Forests ? SVM ? Naive Bayes Classifier (SL) ? Naive Bayesian Probabilistic Model in a Nutshell ? Bayes Formula ? Classification of Documents with Naive Bayes ? Unsupervised Learning Type: Clustering ? Clustering Examples ? k-Means Clustering (UL) ? k-Means Clustering in a Nutshell ? k-Means Characteristics ? Regression Analysis ? Simple Linear Regression Model ? Linear vs Non-Linear Regression ? Linear Regression Illustration ? Major Underlying Assumptions for Regression Analysis ? Least-Squares Method (LSM) ? Locally Weighted Linear Regression ? Regression Models in Excel ? Multiple Regression Analysis ? Logistic Regression ? Regression vs Classification ? Time-Series Analysis ? Decomposing Time-Series ? Summary Lab Exercises Lab 1 - Learning the Lab Environment Lab 2 - Using Jupyter Notebook Lab 3 - Repairing and Normalizing Data Lab 4 - Computing Descriptive Statistics Lab 5 - Data Grouping and Aggregation Lab 6 - Data Visualization with matplotlib Lab 7 - Data Splitting Lab 8 - k-Nearest Neighbors Algorithm Lab 9 - The k-means Algorithm Lab 10 - The Random Forest Algorithm

CertNexus Data Science for Business Professionals (DSBIZ)
By Nexus Human
Duration 0.5 Days 3 CPD hours This course is intended for This course is designed for business leaders and decision makers, including C-level executives, project managers, HR leaders, Marketing and Sales leaders, and technical sales consultants, who want to increase their knowledge of and familiarity with concepts surrounding data science. Other individuals who want to know more about basic data science concepts are also candidates for this course. This course is also designed to assist learners in preparing for the CertNexus DSBIZ⢠(Exam DSZ-110) credential. Overview In this course, you will identify how data science supports business decisions. You will: Explain the fundamentals of data science Describe common implementations of data science. Identify the impact data science can have on a business The ability to identify and respond to changing trends is a hallmark of a successful business. Whether those trends are related to customers and sales or to regulatory and industry standards, businesses are wise to keep track of the variables that can affect the bottom line. In today's business landscape, data comes from numerous sources and in diverse forms. By leveraging data science concepts and technologies, businesses can mold all of that raw data into information that facilitates decisions to improve and expand the success of the business. Data Science Fundamentals What is Data Science? Types of Data Data Science Roles Data Science Implementation The Data Science Lifecycle Data Acquisition and Preparation Data Modeling and Visualization The Impact of Data Science Benefits of Data Science Challenges of Data Science Business Use Cases for Data Science Additional course details: Nexus Humans CertNexus Data Science for Business Professionals (DSBIZ) training program is a workshop that presents an invigorating mix of sessions, lessons, and masterclasses meticulously crafted to propel your learning expedition forward. This immersive bootcamp-style experience boasts interactive lectures, hands-on labs, and collaborative hackathons, all strategically designed to fortify fundamental concepts. Guided by seasoned coaches, each session offers priceless insights and practical skills crucial for honing your expertise. Whether you're stepping into the realm of professional skills or a seasoned professional, this comprehensive course ensures you're equipped with the knowledge and prowess necessary for success. While we feel this is the best course for the CertNexus Data Science for Business Professionals (DSBIZ) course and one of our Top 10 we encourage you to read the course outline to make sure it is the right content for you. Additionally, private sessions, closed classes or dedicated events are available both live online and at our training centres in Dublin and London, as well as at your offices anywhere in the UK, Ireland or across EMEA.
CertNexus Certified Data Science Practitioner (CDSP)
By Nexus Human
Duration 5 Days 30 CPD hours This course is intended for This course is designed for business professionals who leverage data to address business issues. The typical student in this course will have several years of experience with computing technology, including some aptitude in computer programming. However, there is not necessarily a single organizational role that this course targets. A prospective student might be a programmer looking to expand their knowledge of how to guide business decisions by collecting, wrangling, analyzing, and manipulating data through code; or a data analyst with a background in applied math and statistics who wants to take their skills to the next level; or any number of other data-driven situations. Ultimately, the target student is someone who wants to learn how to more effectively extract insights from their work and leverage that insight in addressing business issues, thereby bringing greater value to the business. Overview In this course, you will learn to: Use data science principles to address business issues. Apply the extract, transform, and load (ETL) process to prepare datasets. Use multiple techniques to analyze data and extract valuable insights. Design a machine learning approach to address business issues. Train, tune, and evaluate classification models. Train, tune, and evaluate regression and forecasting models. Train, tune, and evaluate clustering models. Finalize a data science project by presenting models to an audience, putting models into production, and monitoring model performance. For a business to thrive in our data-driven world, it must treat data as one of its most important assets. Data is crucial for understanding where the business is and where it's headed. Not only can data reveal insights, it can also inform?by guiding decisions and influencing day-to-day operations. This calls for a robust workforce of professionals who can analyze, understand, manipulate, and present data within an effective and repeatable process framework. In other words, the business world needs data science practitioners. This course will enable you to bring value to the business by putting data science concepts into practice Addressing Business Issues with Data Science Topic A: Initiate a Data Science Project Topic B: Formulate a Data Science Problem Extracting, Transforming, and Loading Data Topic A: Extract Data Topic B: Transform Data Topic C: Load Data Analyzing Data Topic A: Examine Data Topic B: Explore the Underlying Distribution of Data Topic C: Use Visualizations to Analyze Data Topic D: Preprocess Data Designing a Machine Learning Approach Topic A: Identify Machine Learning Concepts Topic B: Test a Hypothesis Developing Classification Models Topic A: Train and Tune Classification Models Topic B: Evaluate Classification Models Developing Regression Models Topic A: Train and Tune Regression Models Topic B: Evaluate Regression Models Developing Clustering Models Topic A: Train and Tune Clustering Models Topic B: Evaluate Clustering Models Finalizing a Data Science Project Topic A: Communicate Results to Stakeholders Topic B: Demonstrate Models in a Web App Topic C: Implement and Test Production Pipelines
Python for Data Science: Hands-on Technical Overview (TTPS4873)
By Nexus Human
Duration 2 Days 12 CPD hours This course is intended for This introductory-level course is intended for Business Analysts and Data Analysts (or anyone else in the data science realm) who are already comfortable working with numerical data in Excel or other spreadsheet environments. No prior programming experience is required, and a browser is the only tool necessary for the course. Overview This course is approximately 50% hands-on, combining expert lecture, real-world demonstrations and group discussions with machine-based practical labs and exercises. Our engaging instructors and mentors are highly experienced practitioners who bring years of current 'on-the-job' experience into every classroom. Throughout the hands-on course students, will learn to leverage Python scripting for data science (to a basic level) using the most current and efficient skills and techniques. Working in a hands-on learning environment, guided by our expert team, attendees will learn about and explore (to a basic level): How to work with Python interactively in web notebooks The essentials of Python scripting Key concepts necessary to enter the world of Data Science via Python This course introduces data analysts and business analysts (as well as anyone interested in Data Science) to the Python programming language, as it?s often used in Data Science in web notebooks. This goal of this course is to provide students with a baseline understanding of core concepts that can serve as a platform of knowledge to follow up with more in-depth training and real-world practice. An Overview of Python Why Python? Python in the Shell Python in Web Notebooks (iPython, Jupyter, Zeppelin) Demo: Python, Notebooks, and Data Science Getting Started Using variables Builtin functions Strings Numbers Converting among types Writing to the screen Command line parameters Flow Control About flow control White space Conditional expressions Relational and Boolean operators While loops Alternate loop exits Sequences, Arrays, Dictionaries and Sets About sequences Lists and list methods Tuples Indexing and slicing Iterating through a sequence Sequence functions, keywords, and operators List comprehensions Generator Expressions Nested sequences Working with Dictionaries Working with Sets Working with files File overview Opening a text file Reading a text file Writing to a text file Reading and writing raw (binary) data Functions Defining functions Parameters Global and local scope Nested functions Returning values Essential Demos Sorting Exceptions Importing Modules Classes Regular Expressions The standard library Math functions The string module Dates and times Working with dates and times Translating timestamps Parsing dates from text Formatting dates Calendar data Python and Data Science Data Science Essentials Pandas Overview NumPy Overview SciKit Overview MatPlotLib Overview Working with Python in Data Science Additional course details: Nexus Humans Python for Data Science: Hands-on Technical Overview (TTPS4873) training program is a workshop that presents an invigorating mix of sessions, lessons, and masterclasses meticulously crafted to propel your learning expedition forward. This immersive bootcamp-style experience boasts interactive lectures, hands-on labs, and collaborative hackathons, all strategically designed to fortify fundamental concepts. Guided by seasoned coaches, each session offers priceless insights and practical skills crucial for honing your expertise. Whether you're stepping into the realm of professional skills or a seasoned professional, this comprehensive course ensures you're equipped with the knowledge and prowess necessary for success. While we feel this is the best course for the Python for Data Science: Hands-on Technical Overview (TTPS4873) course and one of our Top 10 we encourage you to read the course outline to make sure it is the right content for you. Additionally, private sessions, closed classes or dedicated events are available both live online and at our training centres in Dublin and London, as well as at your offices anywhere in the UK, Ireland or across EMEA.
Data Science for Marketing Analytics
By Nexus Human
Duration 3 Days 18 CPD hours This course is intended for Data Science for Marketing Analytics is designed for developers and marketing analysts looking to use new, more sophisticated tools in their marketing analytics efforts. It'll help if you have prior experience of coding in Python and knowledge of high school level mathematics. Some experience with databases, Excel, statistics, or Tableau is useful but not necessary. Overview By the end of this course, you will be able to build your own marketing reporting and interactive dashboard solutions. The course starts by teaching you how to use Python libraries, such as pandas and Matplotlib, to read data from Python, manipulate it, and create plots, using both categorical and continuous variables. Then, you'll learn how to segment a population into groups and use different clustering techniques to evaluate customer segmentation.As you make your way through the course, you'll explore ways to evaluate and select the best segmentation approach, and go on to create a linear regression model on customer value data to predict lifetime value. In the concluding sections, you'll gain an understanding of regression techniques and tools for evaluating regression models, and explore ways to predict customer choice using classification algorithms. Finally, you'll apply these techniques to create a churn model for modeling customer product choices. Data Preparation and Cleaning Data Models and Structured Data pandas Data Manipulation Data Exploration and Visualization Identifying the Right Attributes Generating Targeted Insights Visualizing Data Unsupervised Learning: Customer Segmentation Customer Segmentation Methods Similarity and Data Standardization k-means Clustering Choosing the Best Segmentation Approach Choosing the Number of Clusters Different Methods of Clustering Evaluating Clustering Predicting Customer Revenue Using Linear Regression Understanding Regression Feature Engineering for Regression Performing and Interpreting Linear Regression Other Regression Techniques and Tools for Evaluation Evaluating the Accuracy of a Regression Model Using Regularization for Feature Selection Tree-Based Regression Models Supervised Learning: Predicting Customer Churn Classification Problems Understanding Logistic Regression Creating a Data Science Pipeline Fine-Tuning Classification Algorithms Support Vector Machine Decision Trees Random Forest Preprocessing Data for Machine Learning Models Model Evaluation Performance Metrics Modeling Customer Choice Understanding Multiclass Classification Class Imbalanced Data Additional course details: Nexus Humans Data Science for Marketing Analytics training program is a workshop that presents an invigorating mix of sessions, lessons, and masterclasses meticulously crafted to propel your learning expedition forward. This immersive bootcamp-style experience boasts interactive lectures, hands-on labs, and collaborative hackathons, all strategically designed to fortify fundamental concepts. Guided by seasoned coaches, each session offers priceless insights and practical skills crucial for honing your expertise. Whether you're stepping into the realm of professional skills or a seasoned professional, this comprehensive course ensures you're equipped with the knowledge and prowess necessary for success. While we feel this is the best course for the Data Science for Marketing Analytics course and one of our Top 10 we encourage you to read the course outline to make sure it is the right content for you. Additionally, private sessions, closed classes or dedicated events are available both live online and at our training centres in Dublin and London, as well as at your offices anywhere in the UK, Ireland or across EMEA.
Practical Data Science with Amazon SageMaker
By Nexus Human
Duration 1 Days 6 CPD hours This course is intended for This course is intended for: A technical audience at an intermediate level Overview Using Amazon SageMaker, this course teaches you how to: Prepare a dataset for training. Train and evaluate a machine learning model. Automatically tune a machine learning model. Prepare a machine learning model for production. Think critically about machine learning model results In this course, learn how to solve a real-world use case with machine learning and produce actionable results using Amazon SageMaker. This course teaches you how to use Amazon SageMaker to cover the different stages of the typical data science process, from analyzing and visualizing a data set, to preparing the data and feature engineering, down to the practical aspects of model building, training, tuning and deployment. Day 1 Business problem: Churn prediction Load and display the dataset Assess features and determine which Amazon SageMaker algorithm to use Use Amazon Sagemaker to train, evaluate, and automatically tune the model Deploy the model Assess relative cost of errors Additional course details: Nexus Humans Practical Data Science with Amazon SageMaker training program is a workshop that presents an invigorating mix of sessions, lessons, and masterclasses meticulously crafted to propel your learning expedition forward. This immersive bootcamp-style experience boasts interactive lectures, hands-on labs, and collaborative hackathons, all strategically designed to fortify fundamental concepts. Guided by seasoned coaches, each session offers priceless insights and practical skills crucial for honing your expertise. Whether you're stepping into the realm of professional skills or a seasoned professional, this comprehensive course ensures you're equipped with the knowledge and prowess necessary for success. While we feel this is the best course for the Practical Data Science with Amazon SageMaker course and one of our Top 10 we encourage you to read the course outline to make sure it is the right content for you. Additionally, private sessions, closed classes or dedicated events are available both live online and at our training centres in Dublin and London, as well as at your offices anywhere in the UK, Ireland or across EMEA.
R Programming for Data Science (v1.0)
By Nexus Human
Duration 5 Days 30 CPD hours This course is intended for This course is designed for students who want to learn the R programming language, particularly students who want to leverage R for data analysis and data science tasks in their organization. The course is also designed for students with an interest in applying statistics to real-world problems. A typical student in this course should have several years of experience with computing technology, along with a proficiency in at least one other programming language. Overview In this course, you will use R to perform common data science tasks.You will: Set up an R development environment and execute simple code. Perform operations on atomic data types in R, including characters, numbers, and logicals. Perform operations on data structures in R, including vectors, lists, and data frames. Write conditional statements and loops. Structure code for reuse with functions and packages. Manage data by loading and saving datasets, manipulating data frames, and more. Analyze data through exploratory analysis, statistical analysis, and more. Create and format data visualizations using base R and ggplot2. Create simple statistical models from data. In our data-driven world, organizations need the right tools to extract valuable insights from that data. The R programming language is one of the tools at the forefront of data science. Its robust set of packages and statistical functions makes it a powerful choice for analyzing data, manipulating data, performing statistical tests on data, and creating predictive models from data. Likewise, R is notable for its strong data visualization tools, enabling you to create high-quality graphs and plots that are incredibly customizable. This course will teach you the fundamentals of programming in R to get you started. It will also teach you how to use R to perform common data science tasks and achieve data-driven results for the business. Lesson 1: Setting Up R and Executing Simple Code Topic A: Set Up the R Development Environment Topic B: Write R Statements Lesson 2: Processing Atomic Data Types Topic A: Process Characters Topic B: Process Numbers Topic C: Process Logicals Lesson 3: Processing Data Structures Topic A: Process Vectors Topic B: Process Factors Topic C: Process Data Frames Topic D: Subset Data Structures Lesson 4: Writing Conditional Statements and Loops Topic A: Write Conditional Statements Topic B: Write Loops Lesson 5: Structuring Code for Reuse Topic A: Define and Call Functions Topic B: Apply Loop Functions Topic C: Manage R Packages Lesson 6: Managing Data in R Topic A: Load Data Topic B: Save Data Topic C: Manipulate Data Frames Using Base R Topic D: Manipulate Data Frames Using dplyr Topic E: Handle Dates and Times Lesson 7: Analyzing Data in R Topic A: Examine Data Topic B: Explore the Underlying Distribution of Data Topic C: Identify Missing Values Lesson 8: Visualizing Data in R Topic A: Plot Data Using Base R Functions Topic B: Plot Data Using ggplot2 Topic C: Format Plots in ggplot2 Topic D: Create Combination Plots Lesson 9: Modeling Data in R Topic A: Create Statistical Models in R Topic B: Create Machine Learning Models in R