- Professional Development
- Medicine & Nursing
- Arts & Crafts
- Health & Wellbeing
- Personal Development
577 Data Analyst courses in London delivered Online
ChatGPT Masterclass: A Complete ChatGPT Zero to Hero!
By NextGen Learning
ChatGPT Masterclass: A Complete ChatGPT Zero to Hero! Course Overview The ChatGPT Masterclass: A Complete ChatGPT Zero to Hero! course is designed to guide learners from basic understanding to advanced proficiency in using ChatGPT. This course covers a wide range of topics, from the fundamentals of ChatGPT to its integration for business scaling and its applications in specific industries like Excel professionals and students. By the end of the course, learners will have a comprehensive understanding of ChatGPT’s capabilities, how to leverage its potential for various tasks, and how to improve productivity and creativity using this powerful tool. Whether you are looking to enhance your business, excel in academic pursuits, or integrate AI into your work, this course provides the knowledge and skills necessary to succeed. Course Description This course offers an in-depth exploration of ChatGPT, covering its fundamental features and uses across different sectors. Learners will be introduced to ChatGPT’s functionalities, followed by more specialised modules, including its applications for developers, students, and professionals working with Excel. Participants will gain valuable insights into how ChatGPT can be used to automate tasks, enhance business operations, and create innovative content. They will also explore the integration of Dall-E 2 for generating graphic art and the best tools and extensions to improve ChatGPT's functionality. The course is structured to ensure learners gain a clear understanding of how to effectively use ChatGPT for various personal and professional goals. ChatGPT Masterclass: A Complete ChatGPT Zero to Hero! Curriculum Module 01: Getting Started Module 02: ChatGPT – Basic Module 03: ChatGPT for Developers Module 04: Build, and Scale your Business Using ChatGPT Module 05: ChatGPT for Students Module 06: The Power of ChatGPT Module 07: ChatGPT for Excel professionals Module 08: Generate Incredible Graphic Art with Dall-E 2 Module 09: The Best Tools and Extensions using ChatGPT (See full curriculum) Who is this course for? Individuals seeking to improve productivity through AI. Professionals aiming to leverage ChatGPT for business growth. Beginners with an interest in learning AI technologies. Developers looking to integrate ChatGPT into applications. Students seeking to optimise learning and research tasks. Career Path AI Integration Specialist Business Automation Expert Developer specialising in AI tools Digital Content Creator Data Analyst using AI tools Academic Support Professional Graphic Designer using AI for art generation

Python Programming: Beginner To Expert
By NextGen Learning
Python Programming: Beginner To Expert Course Overview The "Python Programming: Beginner to Expert" course provides a comprehensive learning journey from the basics of Python to advanced programming techniques. Designed to equip learners with the skills necessary to become proficient Python developers, this course covers a broad range of essential topics, including data types, operators, functions, error handling, and object-oriented programming (OOP). By the end of the course, learners will gain the expertise needed to develop complex applications and tackle real-world problems using Python. The course is ideal for those looking to deepen their understanding of programming and advance their careers in software development, data science, or automation. Course Description This course delves deeply into Python programming, beginning with the fundamentals and progressing to advanced concepts. Learners will explore core programming techniques, including control flow, functions, and error handling, as well as specialized topics such as object-oriented programming (OOP) and libraries like NumPy and Pandas. The course also covers career development topics, such as how to start a career in Python programming. Students will gain a solid understanding of Python’s capabilities and how to apply them across a variety of programming contexts, from scripting to data analysis and more. With its structured modules and clear guidance, learners will finish the course ready to take on more advanced programming projects and pursue roles in the field. Python Programming: Beginner To Expert Curriculum Module 01: Introduction to Python Programming from A-Z Module 02: Getting Familiar with Python Module 03: Basic Data Types Module 04: Python Operators Module 05: Advanced Data Types Module 06: Control Flow Part 1 Module 07: Control Flow Part 2 Module 08: Python Functions Module 09: User Input and Error Handling Module 10: Python Advanced Functions Module 11: Python Scripting and Libraries Module 12: NumPy Module 13: Pandas Module 14: Introduction to OOP Module 15: Advanced OOP Module 16: Starting a Career in Python (See full curriculum) Who is this course for? Individuals seeking to start a career in Python programming. Professionals aiming to enhance their programming skills for career development. Beginners with an interest in software development, data science, or automation. Those looking to expand their programming knowledge in a structured and progressive way. Career Path Python Developer Software Engineer Data Analyst Data Scientist Automation Specialist Web Developer Backend Developer

Diploma in Data Analysis Fundamentals
By NextGen Learning
Diploma in Data Analysis Fundamentals Course Overview The Diploma in Data Analysis Fundamentals provides a comprehensive introduction to the core principles and techniques used in data analysis. Throughout this course, learners will explore various data analysis tools and methods, such as Pareto charts, histograms, and control charts, to gain insights into processes and performance. By focusing on key data analysis skills, including identifying variation and interpreting results, this course empowers learners to use data-driven approaches to improve business processes. Upon completion, learners will have the ability to assess and present data effectively, enabling informed decision-making in a wide range of industries. Course Description This course covers essential topics in data analysis, including the principles of process management, tools for data analysis, and methods to interpret and present performance data. Learners will delve into key techniques such as Pareto charts, histograms, run charts, and control charts, focusing on how to use these tools to identify patterns, variations, and areas for improvement. The course also includes a structured approach to performance measurement and provides exercises to reinforce the theoretical knowledge gained. By the end of the course, learners will be equipped with the skills to analyse data, identify trends, and contribute to process improvement initiatives within their organisations. Diploma in Data Analysis Fundamentals Curriculum Module 01: Introduction Module 02: Agenda and Principles of Process Management Module 03: The Voice of the Process Module 04: Working as One Team for Improvement Module 05: Exercise: The Voice of the Customer Module 06: Tools for Data Analysis Module 07: The Pareto Chart Module 08: The Histogram Module 09: The Run Chart Module 10: Exercise: Presenting Performance Data Module 11: Understanding Variation Module 12: The Control Chart Module 13: Control Chart Example Module 14: Control Chart Special Cases Module 15: Interpreting the Control Chart Module 16: Control Chart Exercise Module 17: Strategies to Deal with Variation Module 18: Using Data to Drive Improvement Module 19: A Structure for Performance Measurement Module 20: Data Analysis Exercise Module 21: Course Project Module 22: Test your Understanding (See full curriculum) Who is this course for? Individuals seeking to enhance their data analysis skills. Professionals aiming to improve decision-making through data insights. Beginners with an interest in process improvement and business analysis. Data enthusiasts looking to build a solid foundation in analysis techniques. Career Path Data Analyst Business Intelligence Analyst Process Improvement Specialist Operations Analyst Quality Control Analyst

Excel Data Analysis
By NextGen Learning
Excel Data Analysis Course Overview The Excel Data Analysis course is designed to equip learners with the essential skills needed to analyse and interpret data using Microsoft Excel. This course covers a range of tools and techniques that are vital for processing, summarising, and visualising data. Learners will explore functions, pivot tables, charts, and data manipulation strategies that will enable them to work efficiently with data sets. By the end of the course, learners will be able to transform raw data into meaningful insights, making it an invaluable skill for professionals across various industries. Whether you're looking to improve your data skills or progress in your career, this course offers the foundational knowledge required for data analysis in Excel. Course Description This course delves into the core aspects of Excel Data Analysis, starting with basic functions and advancing to complex data manipulation techniques. Learners will explore how to create and manage pivot tables, perform data filtering, and apply functions such as VLOOKUP and INDEX MATCH. Visualisation tools like charts and graphs will be covered, enabling learners to present their findings in a clear and impactful way. Additionally, learners will be introduced to data modelling, conditional formatting, and advanced formula techniques that will enhance their data analysis capabilities. The course is structured to provide a comprehensive understanding of Excel’s data analysis features, building competency for a wide range of practical applications in both personal and professional settings. Excel Data Analysis Curriculum Module 01: Introduction to Excel for Data Analysis Module 02: Using Excel Functions for Data Manipulation Module 03: Working with Pivot Tables and Pivot Charts Module 04: Data Visualisation: Creating Charts and Graphs Module 05: Advanced Excel Functions for Complex Data Analysis Module 06: Data Filtering and Sorting Techniques Module 07: Conditional Formatting for Data Insights Module 08: Introduction to Data Modelling and Forecasting Module 09: Data Analysis Best Practices and Case Studies (See full curriculum) Who is this course for? Individuals seeking to enhance their data analysis skills. Professionals aiming to advance in data-centric roles. Beginners with an interest in data analysis and Excel. Anyone looking to improve their Excel knowledge for career development. Career Path Data Analyst Business Analyst Financial Analyst Marketing Analyst Operations Manager Administrative Assistant Project Manager Research and Development Analyst

Microsoft Power BI Masterclass 2021
By NextGen Learning
Microsoft Power BI Masterclass 2021 Course Overview: The "Microsoft Power BI Masterclass 2021" provides learners with the skills to become proficient in data analysis and visualization using Power BI. This comprehensive course covers the core functionalities of Power BI, from data preparation and transformation to creating impactful reports and dashboards. Learners will gain valuable insights into data modelling, visualisation, and the use of DAX for advanced calculations. By the end of the course, participants will be able to apply their knowledge to real-world projects, improving their ability to communicate data-driven insights effectively. This course is ideal for professionals and beginners who want to leverage Power BI to unlock the potential of their data. Course Description: This masterclass delves into the essential features of Microsoft Power BI, guiding learners through every stage of data analysis. Starting with project setup and data transformation in the Query Editor, the course progresses to advanced topics such as DAX functions and data storytelling. Learners will explore how to build data models, create dashboards, and employ Python in Power BI to enhance their reports. The course also covers Power BI Service for cloud-based analytics, row-level security for data protection, and integrating additional data sources. With a focus on empowering users to communicate insights clearly, the course ensures learners gain the expertise to manage data efficiently, make informed decisions, and stay up to date with evolving tools and features. Microsoft Power BI Masterclass 2021 Curriculum: Module 01: Introduction Module 02: Preparing our Project Module 03: Data Transformation - The Query Editor Module 04: Data Transformation - Advanced Module 05: Creating a Data Model Module 06: Data Visualization Module 07: Power BI & Python Module 08: Storytelling with Data Module 09: DAX - The Essentials Module 10: DAX - The CALCULATE function Module 11: Power BI Service - Power BI Cloud Module 12: Row-Level Security Module 13: More data sources Module 14: Next steps to improve & stay up to date (See full curriculum) Who is this course for? Individuals seeking to enhance their data analysis skills. Professionals aiming to advance their data visualization expertise. Beginners with an interest in data science or business analytics. Business analysts or data professionals looking to upskill in Power BI. Career Path: Data Analyst Business Intelligence Analyst Data Scientist Power BI Developer Reporting Analyst Data Visualisation Expert
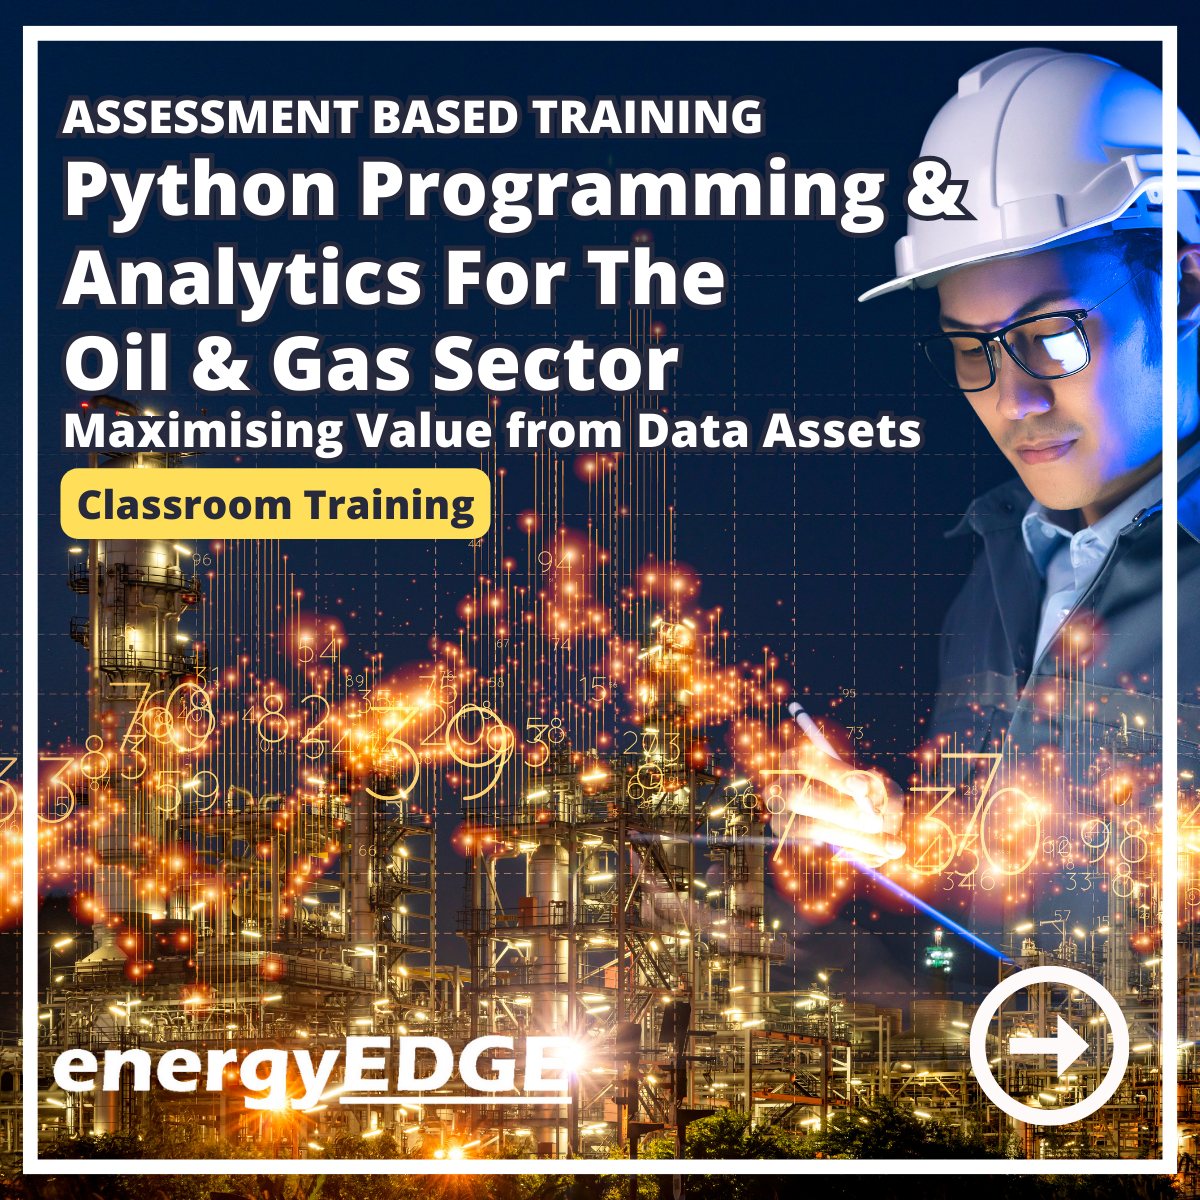
Assessment Based Training - Python Programming & Analytics for the Oil & Gas Sector - Maximising Value from Data Assets
By EnergyEdge - Training for a Sustainable Energy Future
Maximize the value of data assets in the oil and gas sector with EnergyEdge's assessment-based training course on Python programming and analytics.
DP-203T00 Data Engineering on Microsoft Azure
By Nexus Human
Duration 4 Days 24 CPD hours This course is intended for The primary audience for this course is data professionals, data architects, and business intelligence professionals who want to learn about data engineering and building analytical solutions using data platform technologies that exist on Microsoft Azure. The secondary audience for this course includes data analysts and data scientists who work with analytical solutions built on Microsoft Azure. In this course, the student will learn how to implement and manage data engineering workloads on Microsoft Azure, using Azure services such as Azure Synapse Analytics, Azure Data Lake Storage Gen2, Azure Stream Analytics, Azure Databricks, and others. The course focuses on common data engineering tasks such as orchestrating data transfer and transformation pipelines, working with data files in a data lake, creating and loading relational data warehouses, capturing and aggregating streams of real-time data, and tracking data assets and lineage. Prerequisites Successful students start this course with knowledge of cloud computing and core data concepts and professional experience with data solutions. AZ-900T00 Microsoft Azure Fundamentals DP-900T00 Microsoft Azure Data Fundamentals 1 - Introduction to data engineering on Azure What is data engineering Important data engineering concepts Data engineering in Microsoft Azure 2 - Introduction to Azure Data Lake Storage Gen2 Understand Azure Data Lake Storage Gen2 Enable Azure Data Lake Storage Gen2 in Azure Storage Compare Azure Data Lake Store to Azure Blob storage Understand the stages for processing big data Use Azure Data Lake Storage Gen2 in data analytics workloads 3 - Introduction to Azure Synapse Analytics What is Azure Synapse Analytics How Azure Synapse Analytics works When to use Azure Synapse Analytics 4 - Use Azure Synapse serverless SQL pool to query files in a data lake Understand Azure Synapse serverless SQL pool capabilities and use cases Query files using a serverless SQL pool Create external database objects 5 - Use Azure Synapse serverless SQL pools to transform data in a data lake Transform data files with the CREATE EXTERNAL TABLE AS SELECT statement Encapsulate data transformations in a stored procedure Include a data transformation stored procedure in a pipeline 6 - Create a lake database in Azure Synapse Analytics Understand lake database concepts Explore database templates Create a lake database Use a lake database 7 - Analyze data with Apache Spark in Azure Synapse Analytics Get to know Apache Spark Use Spark in Azure Synapse Analytics Analyze data with Spark Visualize data with Spark 8 - Transform data with Spark in Azure Synapse Analytics Modify and save dataframes Partition data files Transform data with SQL 9 - Use Delta Lake in Azure Synapse Analytics Understand Delta Lake Create Delta Lake tables Create catalog tables Use Delta Lake with streaming data Use Delta Lake in a SQL pool 10 - Analyze data in a relational data warehouse Design a data warehouse schema Create data warehouse tables Load data warehouse tables Query a data warehouse 11 - Load data into a relational data warehouse Load staging tables Load dimension tables Load time dimension tables Load slowly changing dimensions Load fact tables Perform post load optimization 12 - Build a data pipeline in Azure Synapse Analytics Understand pipelines in Azure Synapse Analytics Create a pipeline in Azure Synapse Studio Define data flows Run a pipeline 13 - Use Spark Notebooks in an Azure Synapse Pipeline Understand Synapse Notebooks and Pipelines Use a Synapse notebook activity in a pipeline Use parameters in a notebook 14 - Plan hybrid transactional and analytical processing using Azure Synapse Analytics Understand hybrid transactional and analytical processing patterns Describe Azure Synapse Link 15 - Implement Azure Synapse Link with Azure Cosmos DB Enable Cosmos DB account to use Azure Synapse Link Create an analytical store enabled container Create a linked service for Cosmos DB Query Cosmos DB data with Spark Query Cosmos DB with Synapse SQL 16 - Implement Azure Synapse Link for SQL What is Azure Synapse Link for SQL? Configure Azure Synapse Link for Azure SQL Database Configure Azure Synapse Link for SQL Server 2022 17 - Get started with Azure Stream Analytics Understand data streams Understand event processing Understand window functions 18 - Ingest streaming data using Azure Stream Analytics and Azure Synapse Analytics Stream ingestion scenarios Configure inputs and outputs Define a query to select, filter, and aggregate data Run a job to ingest data 19 - Visualize real-time data with Azure Stream Analytics and Power BI Use a Power BI output in Azure Stream Analytics Create a query for real-time visualization Create real-time data visualizations in Power BI 20 - Introduction to Microsoft Purview What is Microsoft Purview? How Microsoft Purview works When to use Microsoft Purview 21 - Integrate Microsoft Purview and Azure Synapse Analytics Catalog Azure Synapse Analytics data assets in Microsoft Purview Connect Microsoft Purview to an Azure Synapse Analytics workspace Search a Purview catalog in Synapse Studio Track data lineage in pipelines 22 - Explore Azure Databricks Get started with Azure Databricks Identify Azure Databricks workloads Understand key concepts 23 - Use Apache Spark in Azure Databricks Get to know Spark Create a Spark cluster Use Spark in notebooks Use Spark to work with data files Visualize data 24 - Run Azure Databricks Notebooks with Azure Data Factory Understand Azure Databricks notebooks and pipelines Create a linked service for Azure Databricks Use a Notebook activity in a pipeline Use parameters in a notebook Additional course details: Nexus Humans DP-203T00 Data Engineering on Microsoft Azure training program is a workshop that presents an invigorating mix of sessions, lessons, and masterclasses meticulously crafted to propel your learning expedition forward. This immersive bootcamp-style experience boasts interactive lectures, hands-on labs, and collaborative hackathons, all strategically designed to fortify fundamental concepts. Guided by seasoned coaches, each session offers priceless insights and practical skills crucial for honing your expertise. Whether you're stepping into the realm of professional skills or a seasoned professional, this comprehensive course ensures you're equipped with the knowledge and prowess necessary for success. While we feel this is the best course for the DP-203T00 Data Engineering on Microsoft Azure course and one of our Top 10 we encourage you to read the course outline to make sure it is the right content for you. Additionally, private sessions, closed classes or dedicated events are available both live online and at our training centres in Dublin and London, as well as at your offices anywhere in the UK, Ireland or across EMEA.

Are you ready to be at the helm, steering the ship into a realm where data is the new gold? In the infinite world of data, where information spirals at breakneck speed, lies a universe rich in potential and discovery: the domain of Data Science and Visualisation. This 'Certificate in Data Science and Visualisation with Machine Learning at QLS Level 3' course unravels the wonders of extracting meaningful insights using Python, the worldwide leading language of data experts. Harnessing the strength of Python, you'll delve deep into data analysis, experience the finesse of visualisation tools, and master the art of Machine Learning. The need to understand, interpret, and act on this data has become paramount, with vast amounts of data increasing the digital sphere. Envision a canvas where raw numbers are transformed into visually compelling stories, and machine learning models foretell future trends. This course provides a meticulous pathway for anyone eager to learn the data representation paradigms backed by Python's robust libraries. Dive into a curriculum rich with analytical explorations, visual artistry, and machine learning predictions. Learning Outcomes Understanding the foundations and functionalities of Python, focusing on its application in data science. Applying various Python libraries like NumPy and Pandas for effective data analysis. Demonstrating proficiency in creating detailed visual narratives using tools like matplotlib, Seaborn, and Plotly. Implementing Machine Learning algorithms in Python using scikit-learn, ranging from regression models to clustering techniques. Designing and executing a holistic data analysis and visualisation project, encapsulating all learned techniques. Exploring advanced topics, encompassing recommender systems and natural language processing with Python. Attaining the confidence to independently analyse complex data sets and translate them into actionable insights. Video Playerhttps://studyhub.org.uk/wp-content/uploads/2021/03/Data-Science-and-Visualisation-with-Machine-Learning.mp400:0000:0000:00Use Up/Down Arrow keys to increase or decrease volume. Why buy this Certificate in Data Science and Visualisation with Machine Learning at QLS Level 3? Unlimited access to the course for a lifetime. Opportunity to earn a certificate accredited by the CPD Quality Standards after completing this course. Structured lesson planning in line with industry standards. Immerse yourself in innovative and captivating course materials and activities. Assessments are designed to evaluate advanced cognitive abilities and skill proficiency. Flexibility to complete the Certificate in Data Science and Visualisation with Machine Learning at QLS Level 3 Course at your own pace, on your own schedule. Receive full tutor support throughout the week, from Monday to Friday, to enhance your learning experience. Who is this Certificate in Data Science and Visualisation with Machine Learning at QLS Level 3 course for? Aspiring data scientists aiming to harness the power of Python. Researchers keen to enrich their analytical and visualisation skills. Analysts aiming to add machine learning to their toolkit. Developers striving to integrate data analytics into applications. Business professionals desiring data-driven decision-making capabilities. Career path Data Scientist: £55,000 - £85,000 Per Annum Machine Learning Engineer: £60,000 - £90,000 Per Annum Data Analyst: £30,000 - £50,000 Per Annum Data Visualisation Specialist: £45,000 - £70,000 Per Annum Natural Language Processing Specialist: £65,000 - £95,000 Per Annum Business Intelligence Developer: £40,000 - £65,000 Per Annum Prerequisites This Certificate in Data Science and Visualisation with Machine Learning at QLS Level 3 does not require you to have any prior qualifications or experience. You can just enrol and start learning. This Certificate in Data Science and Visualisation with Machine Learning at QLS Level 3 was made by professionals and it is compatible with all PC's, Mac's, tablets and smartphones. You will be able to access the course from anywhere at any time as long as you have a good enough internet connection. Certification After studying the course materials, there will be a written assignment test which you can take at the end of the course. After successfully passing the test you will be able to claim the pdf certificate for £4.99 Original Hard Copy certificates need to be ordered at an additional cost of £8. Endorsed Certificate of Achievement from the Quality Licence Scheme Learners will be able to achieve an endorsed certificate after completing the course as proof of their achievement. You can order the endorsed certificate for only £85 to be delivered to your home by post. For international students, there is an additional postage charge of £10. Endorsement The Quality Licence Scheme (QLS) has endorsed this course for its high-quality, non-regulated provision and training programmes. The QLS is a UK-based organisation that sets standards for non-regulated training and learning. This endorsement means that the course has been reviewed and approved by the QLS and meets the highest quality standards. Please Note: Studyhub is a Compliance Central approved resale partner for Quality Licence Scheme Endorsed courses. Course Curriculum Welcome, Course Introduction & overview, and Environment set-up Welcome & Course Overview 00:07:00 Set-up the Environment for the Course (lecture 1) 00:09:00 Set-up the Environment for the Course (lecture 2) 00:25:00 Two other options to setup environment 00:04:00 Python Essentials Python data types Part 1 00:21:00 Python Data Types Part 2 00:15:00 Loops, List Comprehension, Functions, Lambda Expression, Map and Filter (Part 1) 00:16:00 Loops, List Comprehension, Functions, Lambda Expression, Map and Filter (Part 2) 00:20:00 Python Essentials Exercises Overview 00:02:00 Python Essentials Exercises Solutions 00:22:00 Python for Data Analysis using NumPy What is Numpy? A brief introduction and installation instructions. 00:03:00 NumPy Essentials - NumPy arrays, built-in methods, array methods and attributes. 00:28:00 NumPy Essentials - Indexing, slicing, broadcasting & boolean masking 00:26:00 NumPy Essentials - Arithmetic Operations & Universal Functions 00:07:00 NumPy Essentials Exercises Overview 00:02:00 NumPy Essentials Exercises Solutions 00:25:00 Python for Data Analysis using Pandas What is pandas? A brief introduction and installation instructions. 00:02:00 Pandas Introduction 00:02:00 Pandas Essentials - Pandas Data Structures - Series 00:20:00 Pandas Essentials - Pandas Data Structures - DataFrame 00:30:00 Pandas Essentials - Handling Missing Data 00:12:00 Pandas Essentials - Data Wrangling - Combining, merging, joining 00:20:00 Pandas Essentials - Groupby 00:10:00 Pandas Essentials - Useful Methods and Operations 00:26:00 Pandas Essentials - Project 1 (Overview) Customer Purchases Data 00:08:00 Pandas Essentials - Project 1 (Solutions) Customer Purchases Data 00:31:00 Pandas Essentials - Project 2 (Overview) Chicago Payroll Data 00:04:00 Pandas Essentials - Project 2 (Solutions Part 1) Chicago Payroll Data 00:18:00 Python for Data Visualization using matplotlib Matplotlib Essentials (Part 1) - Basic Plotting & Object Oriented Approach 00:13:00 Matplotlib Essentials (Part 2) - Basic Plotting & Object Oriented Approach 00:22:00 Matplotlib Essentials (Part 3) - Basic Plotting & Object Oriented Approach 00:22:00 Matplotlib Essentials - Exercises Overview 00:06:00 Matplotlib Essentials - Exercises Solutions 00:21:00 Python for Data Visualization using Seaborn Seaborn - Introduction & Installation 00:04:00 Seaborn - Distribution Plots 00:25:00 Seaborn - Categorical Plots (Part 1) 00:21:00 Seaborn - Categorical Plots (Part 2) 00:16:00 Seborn-Axis Grids 00:25:00 Seaborn - Matrix Plots 00:13:00 Seaborn - Regression Plots 00:11:00 Seaborn - Controlling Figure Aesthetics 00:10:00 Seaborn - Exercises Overview 00:04:00 Seaborn - Exercise Solutions 00:19:00 Python for Data Visualization using pandas Pandas Built-in Data Visualization 00:34:00 Pandas Data Visualization Exercises Overview 00:03:00 Panda Data Visualization Exercises Solutions 00:13:00 Python for interactive & geographical plotting using Plotly and Cufflinks Plotly & Cufflinks - Interactive & Geographical Plotting (Part 1) 00:19:00 Plotly & Cufflinks - Interactive & Geographical Plotting (Part 2) 00:14:00 Plotly & Cufflinks - Interactive & Geographical Plotting Exercises (Overview) 00:11:00 Plotly & Cufflinks - Interactive & Geographical Plotting Exercises (Solutions) 00:37:00 Capstone Project - Python for Data Analysis & Visualization Project 1 - Oil vs Banks Stock Price during recession (Overview) 00:15:00 Project 1 - Oil vs Banks Stock Price during recession (Solutions Part 1) 00:18:00 Project 1 - Oil vs Banks Stock Price during recession (Solutions Part 2) 00:18:00 Project 1 - Oil vs Banks Stock Price during recession (Solutions Part 3) 00:17:00 Project 2 (Optional) - Emergency Calls from Montgomery County, PA (Overview) 00:03:00 Python for Machine Learning (ML) - scikit-learn - Linear Regression Model Introduction to ML - What, Why and Types.. 00:15:00 Theory Lecture on Linear Regression Model, No Free Lunch, Bias Variance Tradeoff 00:15:00 scikit-learn - Linear Regression Model - Hands-on (Part 1) 00:17:00 scikit-learn - Linear Regression Model Hands-on (Part 2) 00:19:00 Good to know! How to save and load your trained Machine Learning Model! 00:01:00 scikit-learn - Linear Regression Model (Insurance Data Project Overview) 00:08:00 scikit-learn - Linear Regression Model (Insurance Data Project Solutions) 00:30:00 Python for Machine Learning - scikit-learn - Logistic Regression Model Theory: Logistic Regression, conf. mat., TP, TN, Accuracy, Specificityetc. 00:10:00 scikit-learn - Logistic Regression Model - Hands-on (Part 1) 00:17:00 scikit-learn - Logistic Regression Model - Hands-on (Part 2) 00:20:00 scikit-learn - Logistic Regression Model - Hands-on (Part 3) 00:11:00 scikit-learn - Logistic Regression Model - Hands-on (Project Overview) 00:05:00 scikit-learn - Logistic Regression Model - Hands-on (Project Solutions) 00:15:00 Python for Machine Learning - scikit-learn - K Nearest Neighbors Theory: K Nearest Neighbors, Curse of dimensionality . 00:08:00 scikit-learn - K Nearest Neighbors - Hands-on 00:25:00 scikt-learn - K Nearest Neighbors (Project Overview) 00:04:00 scikit-learn - K Nearest Neighbors (Project Solutions) 00:14:00 Python for Machine Learning - scikit-learn - Decision Tree and Random Forests Theory: D-Tree & Random Forests, splitting, Entropy, IG, Bootstrap, Bagging. 00:18:00 scikit-learn - Decision Tree and Random Forests - Hands-on (Part 1) 00:19:00 scikit-learn - Decision Tree and Random Forests (Project Overview) 00:05:00 scikit-learn - Decision Tree and Random Forests (Project Solutions) 00:15:00 Python for Machine Learning - scikit-learn -Support Vector Machines (SVMs) Support Vector Machines (SVMs) - (Theory Lecture) 00:07:00 scikit-learn - Support Vector Machines - Hands-on (SVMs) 00:30:00 scikit-learn - Support Vector Machines (Project 1 Overview) 00:07:00 scikit-learn - Support Vector Machines (Project 1 Solutions) 00:20:00 scikit-learn - Support Vector Machines (Optional Project 2 - Overview) 00:02:00 Python for Machine Learning - scikit-learn - K Means Clustering Theory: K Means Clustering, Elbow method .. 00:11:00 scikit-learn - K Means Clustering - Hands-on 00:23:00 scikit-learn - K Means Clustering (Project Overview) 00:07:00 scikit-learn - K Means Clustering (Project Solutions) 00:22:00 Python for Machine Learning - scikit-learn - Principal Component Analysis (PCA) Theory: Principal Component Analysis (PCA) 00:09:00 scikit-learn - Principal Component Analysis (PCA) - Hands-on 00:22:00 scikit-learn - Principal Component Analysis (PCA) - (Project Overview) 00:02:00 scikit-learn - Principal Component Analysis (PCA) - (Project Solutions) 00:17:00 Recommender Systems with Python - (Additional Topic) Theory: Recommender Systems their Types and Importance 00:06:00 Python for Recommender Systems - Hands-on (Part 1) 00:18:00 Python for Recommender Systems - - Hands-on (Part 2) 00:19:00 Python for Natural Language Processing (NLP) - NLTK - (Additional Topic) Natural Language Processing (NLP) - (Theory Lecture) 00:13:00 NLTK - NLP-Challenges, Data Sources, Data Processing .. 00:13:00 NLTK - Feature Engineering and Text Preprocessing in Natural Language Processing 00:19:00 NLTK - NLP - Tokenization, Text Normalization, Vectorization, BoW. 00:19:00 NLTK - BoW, TF-IDF, Machine Learning, Training & Evaluation, Naive Bayes 00:13:00 NLTK - NLP - Pipeline feature to assemble several steps for cross-validation 00:09:00 Resources Resources - Data Science and Visualisation with Machine Learning 00:00:00 Order your QLS Endorsed Certificate Order your QLS Endorsed Certificate 00:00:00

Learn Python, JavaScript, and Microsoft SQL for Data science
By NextGen Learning
Course Overview This comprehensive course offers a deep dive into three essential technologies for data science: Python, JavaScript, and Microsoft SQL. Learners will gain foundational knowledge and practical skills in each of these key areas, which are crucial for handling data, creating interactive websites, and working with databases. By the end of the course, students will be proficient in writing Python code for data analysis, creating dynamic web content with JavaScript, and managing data with Microsoft SQL. The course is designed to equip learners with the technical skills needed to succeed in data science, making it a valuable investment for anyone looking to excel in this growing field. Course Description In this course, learners will explore the core principles of Python, JavaScript, and Microsoft SQL, all tailored to the needs of data science professionals. The curriculum covers Python’s data structures, functions, and libraries essential for data analysis, while JavaScript introduces students to web development skills, including client-side validation and data visualisation. The Microsoft SQL section focuses on data management, including filtering, joining, and structuring queries. Learners will develop a solid understanding of these technologies, which will enable them to manipulate data, automate processes, and design interactive applications. The course also includes real-world applications, ensuring learners are well-prepared for future opportunities in data science and web development. Course Modules: Module 01: JavaScript Getting Started Module 02: JavaScript Fundamentals Module 03: JavaScript Strings Module 04: JavaScript Operators Module 05: JavaScript Conditional Statements Module 06: JavaScript Control Flow Statements Module 07: JavaScript Functions Module 08: Data Visualization (Google Charts) Module 09: JavaScript Error Handling Module 10: JavaScript Client-Side Validations Module 11: Python Introduction Module 12: Python Basic Module 13: Python Strings Module 14: Python Operators Module 15: Python Data Structures Module 16: Python Conditional Statements Module 17: Python Control Flow Statements Module 18: Python Core Games Module 19: Python Functions Module 20: Python Args, KW Args for Data Science Module 21: Python Project Module 22: Publish Your Website for Live Module 23: MS SQL Statements Module 24: MS SQL Filtering Data Module 25: MS SQL Functions Module 26: MS SQL Joins Module 27: MS SQL Advanced Commands Module 28: MS SQL Structure and Keys Module 29: MS SQL Queries Module 30: MS SQL Structure Queries Module 31: MS SQL Constraints Module 32: MS SQL Backup and Restore (See full curriculum) Who is this course for? Individuals seeking to enhance their skills in data science. Professionals aiming to expand their knowledge in programming and database management. Beginners with an interest in Python, JavaScript, and SQL. Anyone looking to enter the field of data science or web development. Career Path Data Scientist Web Developer Database Administrator Data Analyst Front-End Developer Full Stack Developer Data Engineer