- Professional Development
- Medicine & Nursing
- Arts & Crafts
- Health & Wellbeing
- Personal Development
212 Dash courses delivered Live Online
Data Analysis and Visualization with Microsoft Excel
By Nexus Human
Duration 2 Days 12 CPD hours This course is intended for This course is designed for students who already have foundational knowledge and skills in Excel and who wish to perform robust and advanced data and statistical analysis with Microsoft Excel using PivotTables, use tools such as Power Pivot and the Data Analysis ToolPak to analyze data, and visualize data and insights using advanced visualizations in charts and dashboards in Excel. To ensure success, you should have baseline skill using Microsoft Excel worksheets, particularly in creating workbooks with formulas and function Overview #NAME? Analyzing data to find issues, insights and opportunities, is now a critical part of many job roles. Beyond the analysis, data analysts in all job roles must be able to effectively present and communicate their findings in visually compelling ways. Microsoft© Excel© is designed for this purpose. Excel can connect to a wide range of data sources, perform robust data analysis and create diverse and robust data-backed visualizations to show insights, trends, and create reports. These capabilities enable people who use Excel for data analysis to turn data into thoughtful action. 1 - DATA ANALYSIS FUNDAMENTALS Introduction to Data Science Create and Modify Tables Sort and Filter Data 2 - VISUALIZING DATA WITH EXCEL Visualize Data with Charts Modify and Format Charts Apply Best Practices in Chart Design 3 - ANALYZING DATA WITH FORMULAS AND FUNCTIONS Analyze Data with Formulas and Named Ranges Analyze Data with Functions Implement Data Validation, Forms, and Controls Create Conditional Visualizations with Lookup Functions 4 - ANALYZING DATA WITH PIVOTTABLES Create a PivotTable Analyze PivotTable Data 5 - PRESENTING VISUAL INSIGHTS WITH DASHBOARDS IN EXCEL Visualize Data with PivotCharts Filter Data Using Slicers and Timelines Create a Dashboard in Excel 6 - CREATING GEOSPATIAL VISUALIZATIONS WITH EXCEL Create Map Charts in Excel Customize Map Charts in Excel 7 - PERFORMING STATISTICAL ANALYSIS Visualize Trendlines and Sparklines with Excel Analyze Data with the Data Analysis ToolPa 8 - GETTING AND TRANSFORMING DATA Connect to Data with Queries Clean and Combine Data Shape and Transform Data 9 - MODELING AND ANALYZING DATA WITH POWER PIVOT Install Power Pivot in Excel Create Data Models with Power Pivot Create Power Pivots Perform Advanced Data Analysis and Visualization 10 - PRESENTING INSIGHTS WITH REPORTS (OPTIONAL) Plan a Report Create a Report

Microsoft Power BI Desktop (live online classes)
By Microsoft Office Training
This course will allow you to explore the potential of self-service business intelligence using Power BI Desktop to analyse and connect to different sources of data, creating Relationships between those different datasets, Query the data using Shaping and data Modelling, to create Visualizations, and publish Reports to different platforms . Course Objectives At the end of this course you will be able to: Connect to data from different sources. Use the Query Editor Perform Power BI desktop data Shaping and Transformation. Create Power BI desktop Modelling. Create Power BI desktop Visualizations and Reports. ' 1 year email support service Take a closer look at the consistent excellent feedback from our growing corporate clients visiting our site ms-officetraining co uk With more than 20 years experience, we deliver courses on all levels of the Desktop version of Microsoft Office and Office 365; ranging from Beginner, Intermediate, Advanced to the VBA level and Business Intelligence. Our trainers are Microsoft certified professionals with a proven track record with several years experience in delivering public, one to one, tailored and bespoke course Tailored training courses: in in company training, you can choose to run the course exactly as they are outlined by us or we can customise it so that it meets your specific needs. A tailored or bespoke course will follow the standard outline but may be adapted to your specific organisational needs. Please visit our site (ms-officetraining co uk) to get a feel of the excellent feedback our courses have had and look at other courses you might be interested in. Introduction to Power BI Power BI Jargon explained A quick look at Power BI Desktop A quick look at the Power BI service Helpful resources Power BI and Excel Introduction to using Excel data in Power BI Upload Excel data to Power BI Import Power View and Power Pivot to Power BI Getting started with Power BI Desktop Overview of Power BI Desktop Accessing Help and Helpful resources Connect to data sources in Power BI Desktop Shaping and Transforming Data with Query Editor Introduction to the Query Editor Data Sources Power BI Desktop can Connect to Introduction to Steps and M code Combining Data Using Merge and Append Queries Data Type Properties Working with Delimiters Clean and transform your data with the Query Editor Text Specific Transformation Tools Number Specific Transformation Tools Date Specific Transformation Tools Split and Merge columns Creating an Index Column Adding Conditional Columns Columns From Examples Grouping and Aggregating data Pivoting and Unpivoting Using filters Modeling the data Introduction to modeling your data How to manage your data relationships Create calculated columns Optimizing data models Create calculated measures Show Values As and Quick Measures Create calculated tables Explore your time-based data Introduction to DAX DAX calculation types DAX functions Visualizations Introduction to visuals in Power BI Create and customize simple visualizations Modify colors in charts and visuals Shapes, text boxes, and images Page layout and formatting Group interactions among visualizations Visual hierarchies and drill-down Using custom visualizations Create a KPI Visualization Geo-Data and Maps Reports, Publishing and Sharing Introduction to the Power BI service Quick insights in Power BI Create and configure a dashboard Ask questions of your data with natural language Create custom Q&A suggestions Share dashboards with your organization Introduction to content packs, security, and groups Publish Power BI Desktop reports Print and export dashboards and reports Create groups in Power BI Use content packs Update content packs Publish to web Who is this course for? Who is this course for? This course facilitates you with knowledge on the potential for Power BI Desktop to analyse and connect to different sources of data, creating Relationships between those different datasets, Query the data using Shaping and data Modelling, and to create Visualizations, and publish Reports to different platforms. Requirements Requirements Before attending this course, delegates should have: - A general knowledge of database concepts (fields, records and relationships) - Familiarity with Excel. Career path Career path Business Intelligence Data Analysis ETL & Data Warehousing

Microsoft Project Level 1 and 2
By Nexus Human
Duration 2 Days 12 CPD hours This course is intended for Delegates should be PC literate, i.e., familiar with PC'S/Laptops and have used a mouse and keyboard; be able to launch and close programs; navigate to information stored on the computer; manage files and folders and be comfortable using Microsoft Office applications such as MS Excel, MS Word etc. Overview The purpose of this course is to provide delegates with the practical skills to build and manage project schedules. It is designed to provide techniques and tips that will help users of the software apply it as a powerful tool to develop competent and unambiguous schedules - while avoiding some of the traps associated with the incorrect application of scheduling features. Techniques learned will also facilitate communicating deliverables and milestones to project stakeholders. This course covers management practices and methodologies and an in-depth knowledge of MS Project functionality. Delegates will be able to create and manage project schedules during the course and reinforce attained skills through practical applications. Project Management Overview Concepts of project management and scheduling The project lifecycle and phases Fundamental importance of defining ? and agreeing ? project scope Developing a Work Breakdown Structure (WBS) to define project scope 4 steps to create a schedule based on the WBS Understanding task dependencies Understanding the concept of the project baseline Developing a Project Schedule Setting the ?Scheduling Mode? Creating Tasks, Recurring Tasks (e.g. progress or review meetings) and Milestones Defining task Dependencies Applying Lag and Lead Time Working with the Critical Path Managing Tasks in the schedule Add Notes and attach project documents to tasks Setting and removing task Constraints and Deadlines Applying the ?Task Path? feature to view dependencies Working with Resources Creating a Resource Pool Working with Resource Calendars Creating Team/Group Calendars Understanding Effort Driven and Non-Effort Driven scheduling Assigning Resources to tasks Working with Project Costs Managing Project Information Applying Field, Tables and Views Applying Filters and Groups Creating custom Fields, Tables and Views (Drop-down menus, Traffic Light reports, Flag Fields) Using the ?Organiser? feature for customised elements Communicating Project Information Applying formats to Views and Tables Using the ?Copy Picture? command Create and Print Project Reports Exporting to Excel Managing Resources Finding Resource Overallocations Resolving Overallocations (reassigning, splitting tasks, utilising float, changing work contours) Applying Resource Levelling features Tracking Progress Setting the Project Baseline Applying the Tracking Gantt and Tracking Table Using the ?Mark on Track? and ?Update Tasks? features Working with Dashboards and Burndown Reports Programme Management Methods to consolidate multiple Project Files Resource sharing - setting up a Master Resource Pool Creating and managing Master Project Files
Microsoft Power BI Desktop In-company (now with live online classes)
By Microsoft Office Training
This course will allow you to explore the potential of self-service business intelligence using Power BI Desktop to analyse and connect to different sources of data, creating Relationships between those different datasets, Query the data using Shaping and data Modelling, to create Visualizations, and publish Reports to different platforms . Course Objectives At the end of this course you will be able to: Connect to data from different sources. Use the Query Editor Perform Power BI desktop data Shaping and Transformation. Create Power BI desktop Modelling. Create Power BI desktop Visualizations and Reports. ' 1 year email support service Take a closer look at the consistent excellent feedback from our growing corporate clients visiting our site ms-officetraining co uk With more than 20 years experience, we deliver courses on all levels of the Desktop version of Microsoft Office and Office 365; ranging from Beginner, Intermediate, Advanced to the VBA level and Business Intelligence. Our trainers are Microsoft certified professionals with a proven track record with several years experience in delivering public, one to one, tailored and bespoke courses. Our competitive rates start from £550.00 per day of training Tailored training courses: You can choose to run the course exactly as they are outlined by us or we can customise it so that it meets your specific needs. A tailored or bespoke course will follow the standard outline but may be adapted to your specific organisational needs. Please visit our site (ms-officetraining co uk) to get a feel of the excellent feedback our courses have had and look at other courses you might be interested in. Introduction to Power BI Power BI Jargon explained A quick look at Power BI Desktop A quick look at the Power BI service Helpful resources Power BI and Excel Introduction to using Excel data in Power BI Upload Excel data to Power BI Import Power View and Power Pivot to Power BI Getting started with Power BI Desktop Overview of Power BI Desktop Accessing Help and Helpful resources Connect to data sources in Power BI Desktop Shaping and Transforming Data with Query Editor Introduction to the Query Editor Data Sources Power BI Desktop can Connect to Introduction to Steps and M code Combining Data Using Merge and Append Queries Data Type Properties Working with Delimiters Clean and transform your data with the Query Editor Text Specific Transformation Tools Number Specific Transformation Tools Date Specific Transformation Tools Split and Merge columns Creating an Index Column Adding Conditional Columns Columns From Examples Grouping and Aggregating data Pivoting and Unpivoting Using filters Modeling the data Introduction to modeling your data How to manage your data relationships Create calculated columns Optimizing data models Create calculated measures Show Values As and Quick Measures Create calculated tables Explore your time-based data Introduction to DAX DAX calculation types DAX functions Visualizations Introduction to visuals in Power BI Create and customize simple visualizations Modify colors in charts and visuals Shapes, text boxes, and images Page layout and formatting Group interactions among visualizations Visual hierarchies and drill-down Using custom visualizations Create a KPI Visualization Geo-Data and Maps Reports, Publishing and Sharing Introduction to the Power BI service Quick insights in Power BI Create and configure a dashboard Ask questions of your data with natural language Create custom Q&A suggestions Share dashboards with your organization Introduction to content packs, security, and groups Publish Power BI Desktop reports Print and export dashboards and reports Create groups in Power BI Use content packs Update content packs Publish to web Who is this course for? Who is this course for? This course facilitates you with knowledge on the potential for Power BI Desktop to analyse and connect to different sources of data, creating Relationships between those different datasets, Query the data using Shaping and data Modelling, and to create Visualizations, and publish Reports to different platforms. Requirements Requirements Before attending this course, delegates should have: - A general knowledge of database concepts (fields, records and relationships) - Familiarity with Excel. Career path Career path Business Intelligence Data Analysis ETL & Data Warehousing
Advanced Visualization with Power BI (AVIAD)
By Online Productivity Training
OVERVIEW Prerequisites—DIAD training or equivalent working experience This one-day course will cover Power BI report layouts and structure the agile process to creating Power BI data visualizations. It will help attendees to understand the art behind visualizations, the implications behind choosing the right charts, the impact of color, shape, and size, and finally the use of Power BI custom visuals. The course includes various design patterns of dashboards and reports, as well as best practices for authoring great reports and dashboards for business users. The course content is managed by the Power BI engineering team at Microsoft. There is no exam associated with the course. COURSE BENEFITS: Understand the need for storytelling with data Understand the agile process to creating Power BI data visualizations Understand the art behind visualizations Gain familiarity with Power BI report layouts and structure Understand implications behind choosing the right charts Gain familiarity with using Power BI custom visuals WHO IS THE COURSE FOR? Power BI report developers who wish to improve the aesthetic quality of their reports Power BI and other BI practitioners who would like to understand more about the theory of data visualization BI practitioners who wish to create reports that communicate the meaning behind the data more clearly Power BI users who would like to explore the types of chart and visual available that answer different types of business question COURSE OUTLINE Module 1 What Is Storytelling With Data? Volume, Velocity and Variety The importance of business questions What is a story in this context? Module 2 The Science Behind Data Visualization Basic problems to avoid Memory and visualization Ways to spark iconic, short-term and long-term memory Module 3 The Process Behind Data Visualization Using an agile approach to report development Data structure and data grain Converting the story to a data model Module 4 Dashboards And Reports Terminology and definitions Dashboard layout and structure Report layout and structure Storyboarding Drill-through, bookmarks, toggles and tooltips Module 5 Chart Selection Charts for comparison Time series Proportions Constructing effective tables, cards and slicers Scatterplots Module 6 Accessibility And Custom Visuals Report accessibility checklists Custom visuals Creating a custom R visual Charticulator Module 7 Publishing And Formatting Colour schemes Making a Power BI theme Use of fonts, icons and symbols Sizing dashboard and report tiles Sparklines, hyperlinks and images Module 8 Report Authoring - Best Practices Design thought process The audience Defining the platform environment The user experience Visualization Implementation and testing Optimization Module 9 Dashboard And Goals Design Tips and tricks Best practices for dashboard design Tracking business metrics with goals

Grammar Essentials
By Nexus Human
Duration 1 Days 6 CPD hours This course is intended for This course is intended for working professionals in various job roles, both native and non-native English speakers, who use formal and informal written communications in the course of business, and who seek to improve their grammar usage. Overview Upon successful completion of this course, students will be able to: ?Examine nouns, pronouns, and verbs. ?Identify adjectives and adverbs. ?Identify prepositions, conjunctions, and interjections. ?Identify some important rules of grammar and some commonly made grammatical errors. ?Identify grammar rules regarding correct punctuation. ?Identify problematic sentence fragments, run-ons, and comma splices, as well as effective methods of rewriting sentences so that they are clear and complete. ?Identify methods for improving word choices. ?Identify methods for building effective sentences. ?Identify methods for editing text effectively. You learned the rules of grammar in school, but now you'd like to refresh and refine your grammar usage for your professional life. You need to state your ideas clearly and concisely in written communications and present yourself in a professional manner. In this course, you will review the rules of grammar, identify common grammar errors, and refine your business writing style. Improving your grammar will help you deliver polished and professional written communications. Correct grammar and a refined, concise writing style can help you clearly express your ideas to others, streamline the directions and instructions that you deliver, and create impressive presentations and reports. 1 - Identifying Nouns, Pronouns, and Verbs Identify Parts of Speech Identify Nouns Identify Pronouns Identify Verbs 2 - Identifying Adjectives and Adverbs Use Adjectives Use Adverbs 3 - Identifying Prepositions, Conjunctions, and Interjections Use Prepositions Use Conjunctions Use Interjections 4 - Identifying Rules Monitor Sentence Structure Monitor Modifiers Avoid Common Errors 5 - Identifying Correct Punctuation Use Parentheses Correctly Use Commas, Semicolons, Colons, Em Dashes, and Quotation Marks Correctly Use Numbers, Symbols, and Capitalization Correctly 6 - Identifying Sentence Fragments, Run-ons, and Comma Splices Identify and Resolve Sentence Fragments Identify Run-ons, Comma Splices, and Solutions 7 - Improving Word Choices Identify Commonly Misused Words Identify Synonyms, Antonyms, and Homonyms 8 - Building Effective Sentences Write with Purpose Consider the Audience Consider the Context 9 - Editing Effectively Use Correct Spelling Check Your Work
Power BI for Data-driven Decision Makers
By Nexus Human
Duration 1 Days 6 CPD hours This course is intended for This course is designed for professionals in a variety of job roles who receive Power BI data visualizations and reports from data analysts or from data visualization engineers. These data report recipients want to use the features and capabilities of Power BI to fully explore the visualizations and initial analyses provided to them in reports, perform additional analysis to ask next-level questions of the data, and to customize and create new visualizations and dashboards in order to share new insights and create compelling reports. Overview Explore Power BI reports. Analyze data to get answers and insights. Sort and group data for analysis and reporting. Filter visualizations. Prepare reports. Troubleshoot, collaborate, and share reports. As data acquisition, access, analysis, and reporting are interwoven with our businesses and lives, more and more data is collected about business and personal activities. This abundance of data and the computing power to analyze it has increased the use of data analysis and data visualization across a broad range of job roles. Decision makers of all types, including managers and executives, must interact with, interpret, and develop reports based on data and analysis provided to them. Microsoft Power BI software is designed for data analysis and the creation of visualizations. Data analysts prepare data, perform initial analysis, and create visualizations that are then passed to business data decision makers. These decision makers can use Power BI's tools to explore the data, perform further analysis to find new insights, make decisions, and create customized reports to share their findings. Prerequisites To ensure your success in this course, you have experience managing data with Microsoft Excel or Google Sheets 1. Exploring Power BI Reports Topic A: Data Analysis Workflow with Power BI Topic B: Explore Reports in the Power BI Service Topic C: Edit Reports 2. Analyzing Data to Get Answers and Insights Topic A: Configure Data Visualizations Topic B: Ask New Questions by Changing Aggregation Topic C: Find Answers with Calculations 3. Sorting and Grouping Data for Analysis and Reporting Topic A: Sort Data Topic B: Group Data 4. Filtering Visualizations Topic A: Filter Data to Refine Analysis Topic B: Create Slicers for Reports 5. Preparing Reports Topic A: Format and Annotate Reports Topic B: Emphasize Data in Reports 6. Troubleshooting, Sharing, and Collaborating Topic A: Troubleshoot Data Issues Topic B: Collaborate in Power BI Topic C: Collaborate with Non-Power BI Users
Excel Module 2 - Data Analysis and Pivot Tables
By Underscore Group
Expand your Excel knowledge and learn how to structure and analyse large data sets.
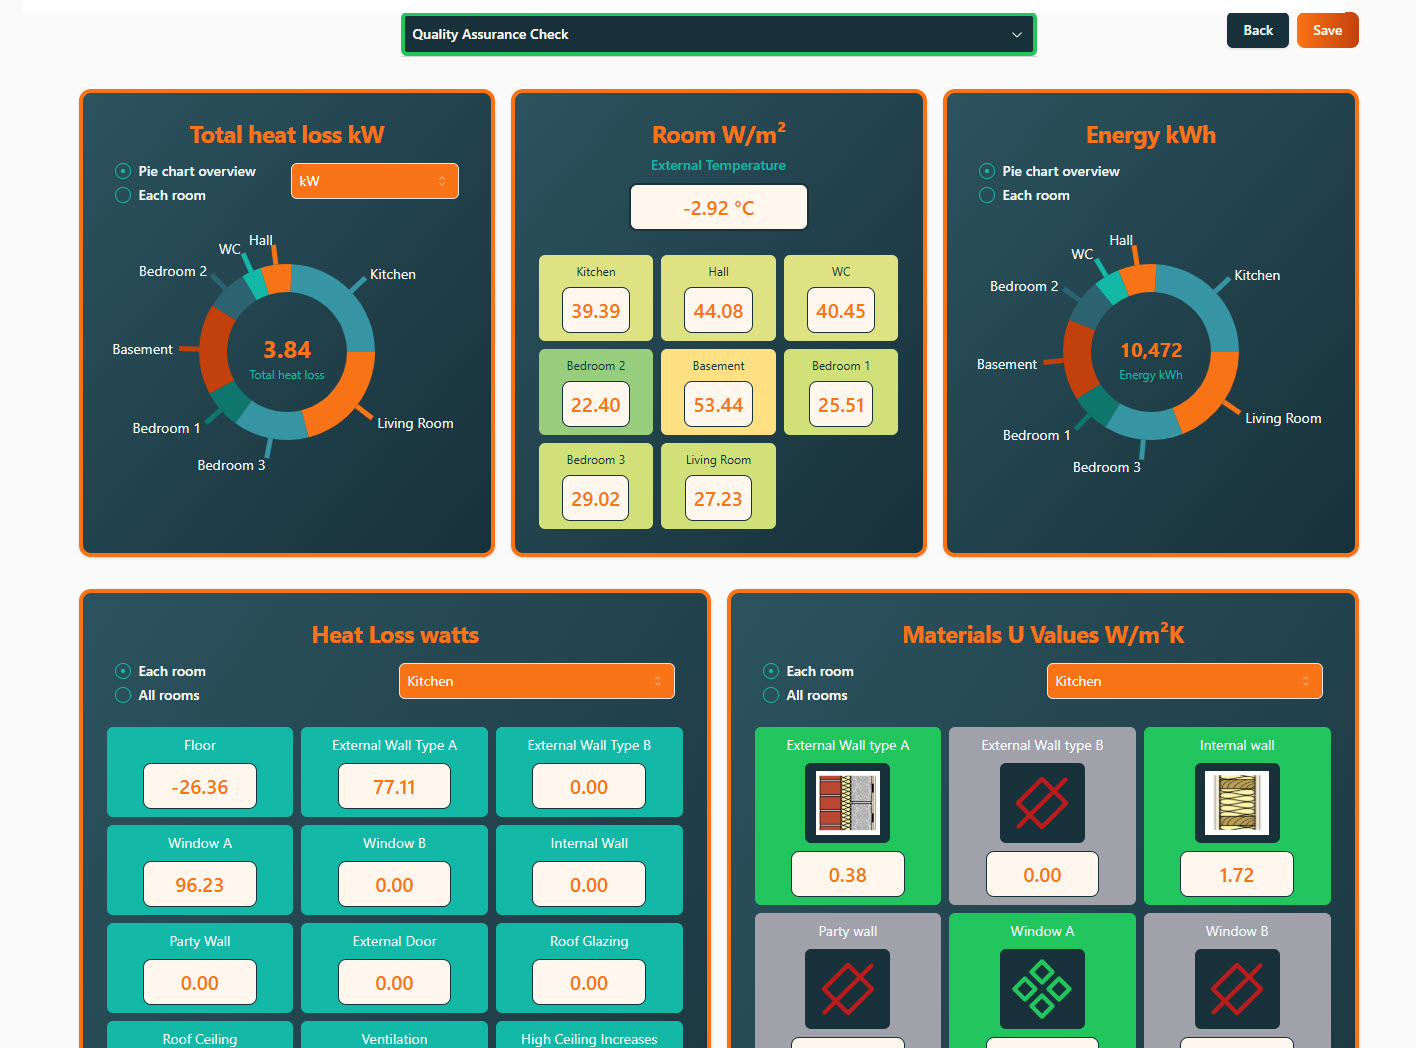
For new users and the curious. Hello, For new users and the curious. IMPORTANT: Firstly, once you are signed up, send us your requests on what you would like to see within the demonstration and learn on the course. We will then cater for your needs and answer them during the session. This is designed to be an introduction into how to start a room by room survey using the Heat Engineer app, then sending this survey to the online dashboard. We will then go through the different steps to complete this heat loss report. Optional pages will also be worked through and shown. Examples of how to select the flow temperature and the heat source (heat pumps and boilers) will be presented once the heat loss result is completed.
Data Analysis and Visualization with Microsoft Excel
By Mpi Learning - Professional Learning And Development Provider
This course is designed for students who already have foundational knowledge and skills in Excel and who wish to perform robust and advanced data and statistical analysis with Microsoft Excel using PivotTables, use tools such as Power Pivot and the Data Analysis ToolPak to analyze data and visualize data and insights using advanced visualizations in charts and dashboards in Excel.