- Professional Development
- Medicine & Nursing
- Arts & Crafts
- Health & Wellbeing
- Personal Development
352 Computing courses in Sutton Coldfield
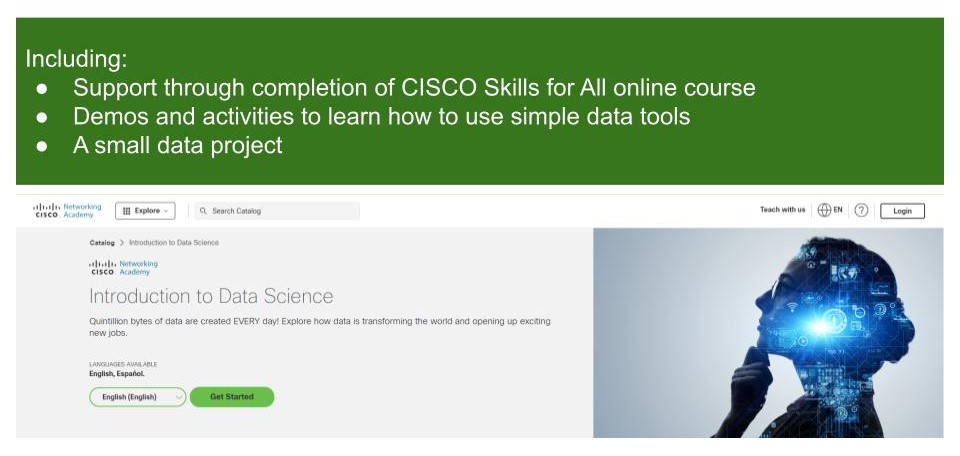
Introduction to Data Science
By futureCoders SE
Learn the basics of Data Science, combining a supported #CISCO Skills for All online course with practical learning and a project to help consolidate the learning.


Microsoft Excel in Depth: In-House Training
By IIL Europe Ltd
Microsoft Excel® in Depth: In-House Training The goal of this course is to provide a deeper understanding of Excel and its intricacies and a new ability to use it efficiently producing the best solutions for your projects. This practical course provides a solid background of the features of Excel and a deeper understanding of its features, benefits and uses. This is not a beginner's course in Excel. You will learn some advanced features such as Pivot Tables, Charting, Tables, Sorting, Filtering and Functions. The goal of this course is to provide a deeper understanding of Excel and its intricacies and a new ability to use it efficiently producing the best solutions for your projects. What you Will Learn You'll learn how to: Use functions like IF, AVERAGE, SUMIF, SUMIFS, SUMPRODUCT, INDEX, MATCH, CHOOSE, DATE, and many more Create meaningful charts Use pivot tables Use Conditional Formatting, Data Validation Take advantage of using Named ranges, do sorting, filtering, tables Getting Started The building blocks of Excel, built-in functions, will be examined The basics of formatting your data will be examined Shortcuts and data manipulation will be explored Built-in features like those mentioned in the 'What you will learn' section above will be explored in detail Excel Functions - VLOOKUP, IF, INDEX, MATCH, CHOOSE, SUMIF, SUMIFS, SUMPRODUCT, DATE, so many more Using Named ranges, Data Validation, Sorting, and Filtering Learn the Name manager; Learn the difference between local and global names; Ensure correct access to linked workbooks; Ensure data accuracy; Learn how to use cascading data validation (for example, once a user chooses 'cars', another cell allows only Ford, Toyota, etc.); Sorting by more than 3 fields; Filtering by font, pattern, or value; See your data based on things like dates in the 3rd quarter, or fields where quantity x price is greater than some fixed value Conditional formatting and data formatting Make relevant data stand out Isolate highs and lows Make error cells invisible Learn about Data bars, Icon sets, and Color scales Highlight differences between worksheets Learn all the codes in the Format/Number list Using cell Styles Learn all about alignment, protection, borders, colors and more Pivot Tables Learn how to summarize large amounts of data with a few clicks Learn various ways of presenting the data Learn the various pivot table tools Learn how to customize and format a pivot table to suit your needs Learn how to group data Learn how to use the various options to present your data Charts Learn how to create a chart with one keystroke! Learn the 11 types of built-in charts Learn how to create a chart with one keystroke! Learn how to customize the charts to make the information tell the right story Learn how to use the design, layout, and formatting available to charts in Excel 2007 Learn embedded charts versus chart sheets Learn how to use modify all the pieces of a chart Array formulas Learn how to use the most powerful formulas in Excel Learn how to combine many formulas into one compact array-formula Learn the real power of these formulas and why regular formulas can't do the job Learn how to use built-in array formulas, like TREND or TRANSPOSE

AI For Leaders
By Mpi Learning - Professional Learning And Development Provider
In the past, popular thought treated artificial intelligence (AI) as if it were the domain of science fiction or some far-flung future. In the last few years, however, AI has been given new life. The business world has especially given it renewed interest. However, AI is not just another technology or process for the business to consider - it is a truly disruptive force.

Software management - the business perspective (In-House)
By The In House Training Company
Software comes in a variety of guises - application software, firmware, middleware, system software. Increasingly, however, it doesn't necessarily present that way, especially as the boundaries between software, data and source code are becoming more and more blurred. And as software becomes more complex and more difficult to disentangle, so it becomes harder to manage and to value. But as it becomes more integral to every aspect of a business, so it is ever more important to keep on top of the technical, legal and commercial issues that arise, issues such as: To address these issues, organisations need a process for evaluating their current situation from all perspectives and for identifying the key actions they need to take to ensure holistic management of their software. This very practical programme will help set your organisation on the right path. Note: this is an indicative agenda, to be used as a starting point for a conversation between client and consultant, depending on the organisation's specific situation and requirements. This programme is designed to give you a deeper understanding of: The technical, legal and commercial risks associated with software development, procurement, use and commercial exploitation The most appropriate processes and responsibilities for managing those risks Note: this is an indicative agenda, to be used as a starting point for a conversation between client and consultant, depending on the organisation's specific situation and requirements. 1 Software business model What is the software business model? What options exist? Has the software business model been thoroughly reviewed to ensure its viability? This means fully understanding the market opportunity, the business environment and customer and end-user expectations. 2 Technology What are the technologies? How has the technology selection been validated considering the competitiveness, structure, and potential for future innovation? 3 UI and UX What is the UI and UX? How to best articulate this? Has the user interface and user experience been studied from both a subjective and objective view to give insight into customer behaviour? 4 Legal framework / commercial aspects Has the necessary legal framework or commercial aspects that may impact upon use or operation of the software been understood and risks identified and mitigated? 5 Software development What is the software development process? Are both the business management and development team's processes resilient in order to improve the company's capability and the maturity of the software? 6 Software quality What is quality? What are the metrics around software quality? What is the maturity level, based around a qualitative and quantitative assessment? 7 Intellectual property associated What IP should be considered when it comes to software? Does the company understand both the intellectual property risks and potential opportunities associated with this software? 8 Security What does software security mean in this context? How is it being addressed? 9 An holistic approach Review of roles and responsibilities to ensure appropriate management and protection

FULL STACK JAVA
By London School of Emerging Technology
Full Stack Development encompasses the complete creation of end-to-end development of both the front-end and back-end of an application. LSET Bridges The Gap Between Education And Employment

Cyber security courses in Dubai
By Edoxi Training Institute
Boost your cyber security skills with Edoxi's Cyber Security courses in Dubai. Learn how to safeguard networks and data from cyber threats. With Edoxi’s cyber security courses upskill your knowledge in the areas such as Security Engineering, System Security, Software Security, cyberattacks, Security Software, Software Testing, and more.

Visual Analytics Best Practice
By Tableau Training Uk
This course is very much a discussion, so be prepared to present and critically analyse your own and class mates work. You will also need to bring a few examples of work you have done in the past. Learning and applying best practice visualisation principles will improve effective discussions amongst decision makers throughout your organisation. As a result more end-users of your dashboards will be able to make better decisions, more quickly. This 2 Day training course is aimed at analysts with good working knowledge of BI tools (we use Tableau to present, but attendees can use their own software such as Power BI or Qlik Sense). It is a great preparation for taking advanced certifications, such as Tableau Certified Professional. Contact us to discuss the Visual Analytics Best Practice course Email us if you are interested in an on-site course, or would be interested in different dates and locations This Tableau Desktop training intermediate course is designed for the professional who has a solid foundation with Tableau and is looking to take it to the next level. Attendees should have a good understanding of the fundamental concepts of building Tableau worksheets and dashboards typically achieved from having attended our Tableau Desktop Foundation Course. At the end of this course you will be able to communicate insights more effectively, enabling your organisation to make better decisions, quickly. The Tableau Desktop Analyst training course is aimed at people who are used to working with MS Excel or other Business Intelligence tools and who have preferably been using Tableau already for basic reporting. The course includes the following topics: WHAT IS VISUAL ANALYSIS? Visual Analytics Visual Analytics Process Advantages of Visual Analysis Exercise: Interpreting Visualisations HOW DO WE PROCESS VISUAL INFORMATION? Memory and Processing Types Exercise: Identifying Types of Processing Cognitive Load Exercise: Analysing Cognitive Load Focus and Guide the Viewer Remove Visual Distractions Organise Information into Chunks Design for Proximity Exercise: Reducing Cognitive Load SENSORY MEMORY Pre-attentive Attributes Quantitatively-Perceived Attributes Categorically-Perceived Attributes Exercise: Analysing Pre-attentive Attributes Form & Attributes Exercise: Using Form Effectively Colour & Attributes Exercise: Using Colour Effectively Position & Attributes Exercise: Using Position Effectively ENSURING VISUAL INTEGRITY Informing without Misleading Gestalt Principles Visual Area Axis & Scale Colour Detail Exercise: Informing without Misleading CHOOSING THE RIGHT VISUALISATION Comparing and Ranking Categories Comparing Measures Comparing Parts to Whole Viewing Data Over Time Charts Types for Mapping Viewing Correlation Viewing Distributions Viewing Specific Values DASHBOARDS AND STORIES Exercise: Picking the Chart Type Exercise: Brainstorming Visual Best Practice Development Process for Dashboards and Stories Plan the Visualisation Create the Visualisation Test the Visualisation Exercise: Designing Dashboards and Stories This training course includes over 20 hands-on exercises to help participants “learn by doing” and to assist group discussions around real-life use cases. Each attendee receives an extensive training manual which covers the theory, practical applications and use cases, exercises and solutions together with a USB with all the materials required for the training. The course starts at 09:30 on the first day and ends at 17:00. On the second day the course starts at 09:00 and ends at 17:00. Students must bring their own laptop with an active version of Tableau Desktop 10.5 (or later) pre-installed. What People Are Saying About This Course "Steve was willing to address questions arising from his content in a full and understandable way"Lisa L. "Really enjoyed the course and feel the subject and the way it was taught was very close to my needs"James G. "The course tutor Steve was incredibly helpful and taught the information very well while making the two days very enjoyable."Bradd P. "The host and his courses will give you the tools and confidence that you need to be comfortable with Tableau."Jack S. "Steve was fantastic with his knowledge and knowhow about the product. Where possible he made sure you could put demonstrations in to working practice, to give the audience a clear understanding."Tim H. "This was a very interesting and helpful course, which will definitely help me produce smarter, cleaner visualisations that will deliver more data-driven insights within our business."Richard A. "Steve is very open to questions and will go out of his way to answer any query. Thank you"Wasif N. "Steve was willing to address questions arising from his content in a full and understandable way"Lisa L. "Really enjoyed the course and feel the subject and the way it was taught was very close to my needs"James G.

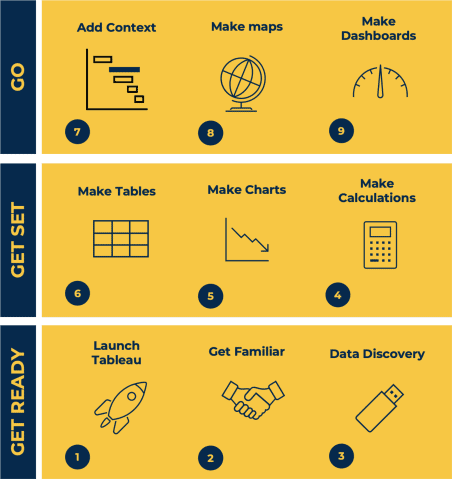
Tableau Desktop Training - Foundation
By Tableau Training Uk
This Tableau Desktop Training course is a jumpstart to getting report writers and analysts with little or no previous knowledge to being productive. It covers everything from connecting to data, through to creating interactive dashboards with a range of visualisations in two days of your time. For Private options, online or in-person, please send us details of your requirements: This Tableau Desktop Training course is a jumpstart to getting report writers and analysts with little or no previous knowledge to being productive. It covers everything from connecting to data, through to creating interactive dashboards with a range of visualisations in two days of your time. Having a quick turnaround from starting to use Tableau, to getting real, actionable insights means that you get a swift return on your investment of time and money. This accelerated approach is key to getting engagement from within your organisation so everyone can immediately see and feel the impact of the data and insights you create. This course is aimed at someone who has not used Tableau in earnest and may be in a functional role, eg. in sales, marketing, finance, operations, business intelligence etc. The course is split into 3 phases and 9 modules: PHASE 1: GET READY MODULE 1: LAUNCH TABLEAU Check Install & Setup Why is Visual Analytics Important MODULE 2: GET FAMILIAR What is possible How does Tableau deal with data Know your way around How do we format charts Dashboard Basics – My First Dashboard MODULE 3: DATA DISCOVERY Connecting to and setting up data in Tableau How Do I Explore my Data – Filters & Sorting How Do I Structure my Data – Groups & Hierarchies, Visual Groups How Tableau Deals with Dates – Using Discrete and Continuous Dates, Custom Dates Phase 2: GET SET MODULE 4: MAKE CALCULATIONS How Do I Create Calculated Fields & Why MODULE 5: MAKE CHARTS Charts that Compare Multiple Measures – Measure Names and Measure Values, Shared Axis Charts, Dual Axis Charts, Scatter Plots Showing Relational & Proportional Data – Pie Charts, Donut Charts, Tree Maps MODULE 6: MAKE TABLES Creating Tables – Creating Tables, Highlight Tables, Heat Maps Phase 3: GO MODULE 7: ADD CONTEXT Reference Lines and Bands MODULE 8: MAKE MAPS Answering Spatial Questions – Mapping, Creating a Choropleth (Filled) Map MODULE 9: MAKE DASHBOARDS Using the Dashboard Interface Dashboard Actions This training course includes over 25 hands-on exercises and quizzes to help participants “learn by doing” and to assist group discussions around real-life use cases. Each attendee receives a login to our extensive training portal which covers the theory, practical applications and use cases, exercises, solutions and quizzes in both written and video format. Students must use their own laptop with an active version of Tableau Desktop 2018.2 (or later) pre-installed. What People Are Saying About This Course “Excellent Trainer – knows his stuff, has done it all in the real world, not just the class room.”Richard L., Intelliflo “Tableau is a complicated and powerful tool. After taking this course, I am confident in what I can do, and how it can help improve my work.”Trevor B., Morrison Utility Services “I would highly recommend this course for Tableau beginners, really easy to follow and keep up with as you are hands on during the course. Trainer really helpful too.”Chelsey H., QVC “He is a natural trainer, patient and very good at explaining in simple terms. He has an excellent knowledge base of the system and an obvious enthusiasm for Tableau, data analysis and the best way to convey results. We had been having difficulties in the business in building financial reports from a data cube and he had solutions for these which have proved to be very useful.”Matthew H., ISS Group