- Professional Development
- Medicine & Nursing
- Arts & Crafts
- Health & Wellbeing
- Personal Development
81 Analytics courses in Borehamwood
Tableau Desktop Training - Analyst
By Tableau Training Uk
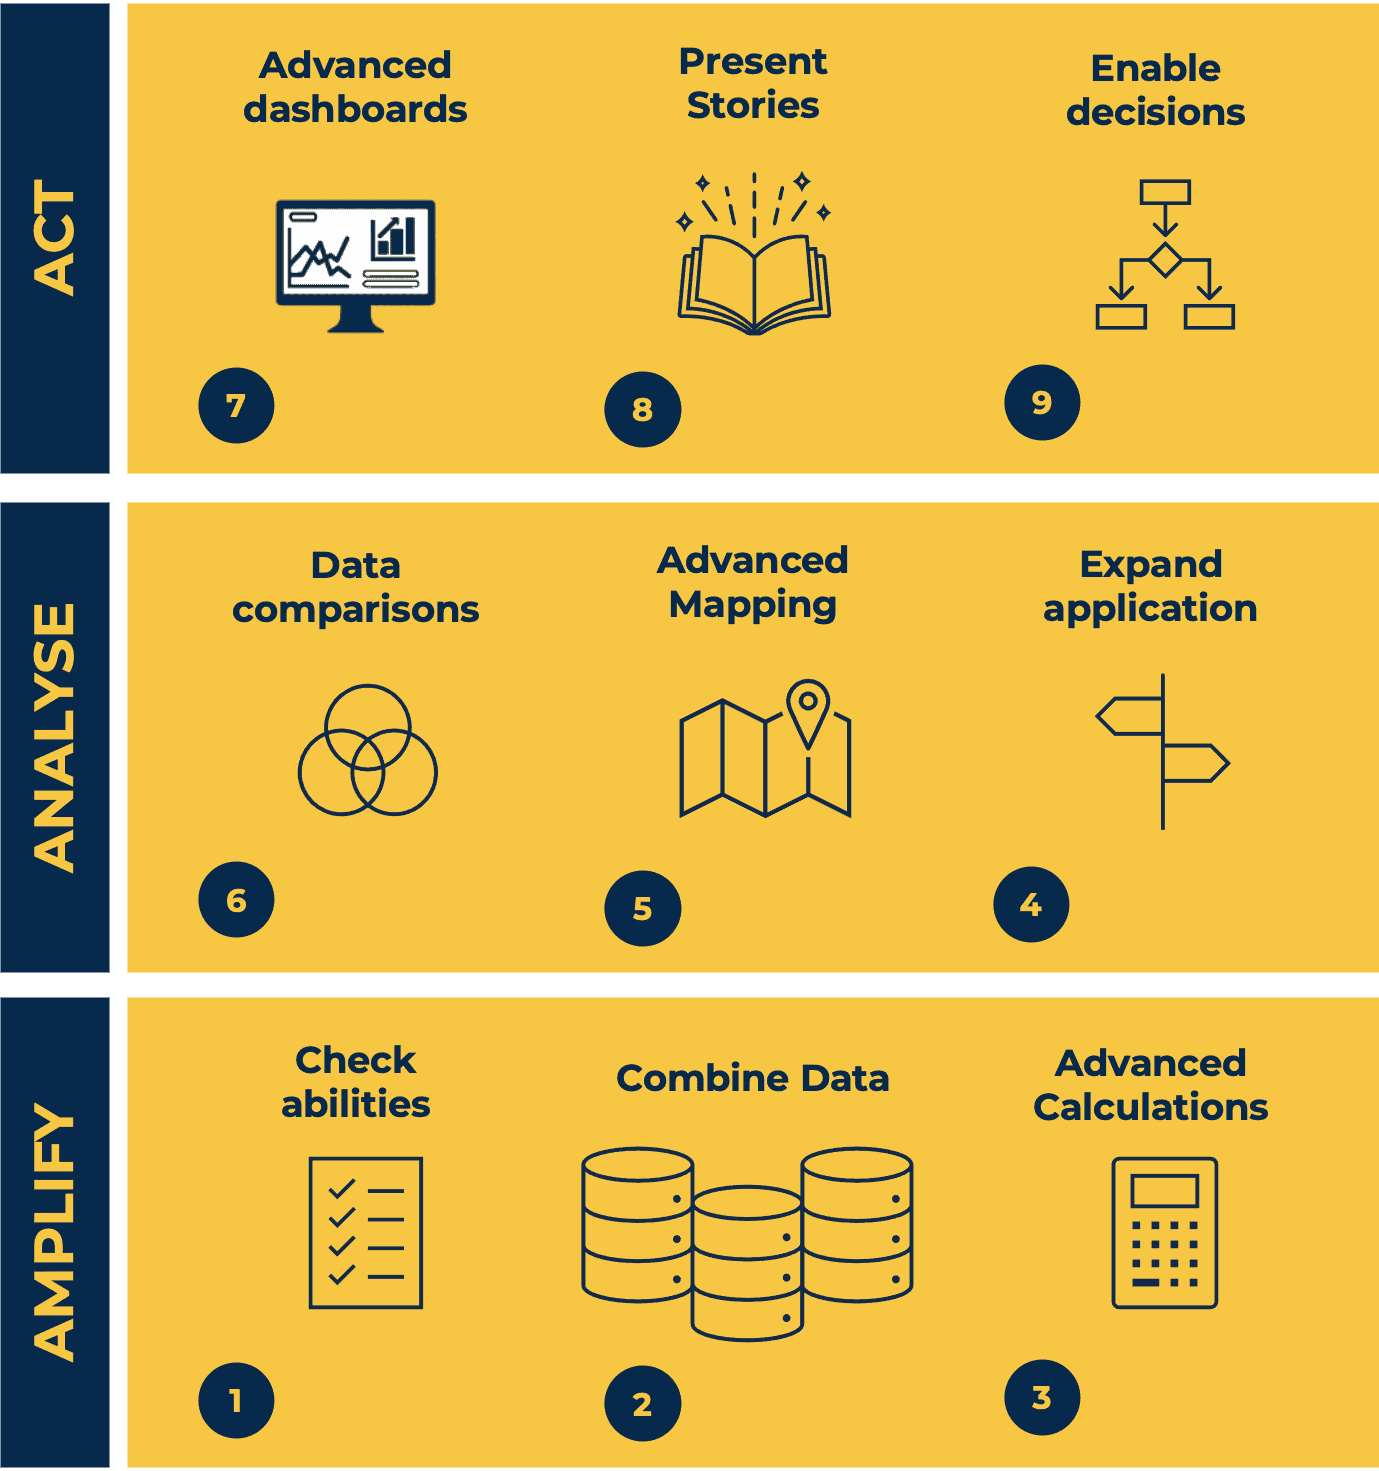
This Tableau Desktop Training intermediate course is designed for the professional who has a solid foundation with Tableau and is looking to take it to the next level. For Private options, online or in-person, please send us details of your requirements: This Tableau Desktop training intermediate course is designed for the professional who has a solid foundation with Tableau and is looking to take it to the next level. Attendees should have a good understanding of the fundamental concepts of building Tableau worksheets and dashboards typically achieved from having attended our Tableau Desktop Foundation Course. At the end of this course you will be able to communicate insights more effectively, enabling your organisation to make better decisions, quickly. The Tableau Desktop Analyst training course is aimed at people who are used to working with MS Excel or other Business Intelligence tools and who have preferably been using Tableau already for basic reporting. The course is split into 3 phases and 9 modules: Phase 1: AMPLIFY MODULE 1: CHECK ABILITIES Revision – What I Should Know What is possibleHow does Tableau deal with dataKnow your way aroundHow do we format chartsHow Tableau deals with datesCharts that compare multiple measuresCreating Tables MODULE 2: COMBINE DATA Relationships Joining Tables – Join Types, Joining tables within the same database, cross database joins, join calculations Blending – How to create a blend with common fields, Custom defined Field relationships and mismatched element names, Calculated fields in blended data sources Unions – Manual Unions and mismatched columns, Wildcard unions Data Extracts – Creating & Editing Data extracts MODULE 3: ADVANCED CALCULATIONS Row Level v Aggregations Aggregating dimensions in calculations Changing the Level of Detail (LOD) of calculations – What, Why, How Adding Table Calculations Phase 2: ANALYSE MODULE 4: EXPAND APPLICATION Making things dynamic with parameters Sets Trend Lines How do we format charts Forecasting MODULE 5: ADVANCED MAPPING Using your own images for spatial analysis Mapping with Spatial files MODULE 6: DATA COMPARISONS Advanced Charts Bar in Bar charts Bullet graphs Creating Bins and Histograms Creating a Box & Whisker plot Phase 3: ACT MODULE 7: ADVANCED DASHBOARDS Using the dashboard interface and Device layout Dashboard Actions and Viz In tooltips Horizontal & Vertical containers Navigate between dashboards MODULE 8: PRESENT STORIES Telling data driven stories MODULE 9: ENABLE DECISIONS What is Tableau Server Publishing & Permissions How can your users engage with content This training course includes over 25 hands-on exercises and quizzes to help participants “learn by doing” and to assist group discussions around real-life use cases. Each attendee receives a login to our extensive training portal which covers the theory, practical applications and use cases, exercises, solutions and quizzes in both written and video format. Students must bring their own laptop with an active version of Tableau Desktop 2018.2 (or later) pre-installed. What People Are Saying About This Course “Course was fantastic, and completely relevant to the work I am doing with Tableau. I particularly liked Steve’s method of teaching and how he applied the course material to ‘real-life’ use-cases.”Richard W., Dashboard Consulting Ltd “This course was extremely useful and excellent value. It helped me formalise my learning and I have taken a lot of useful tips away which will help me in everyday work.” Lauren M., Baillie Gifford “I would definitely recommend taking this course if you have a working knowledge of Tableau. Even the little tips Steve explains will make using Tableau a lot easier. Looking forward to putting what I’ve learned into practice.”Aron F., Grove & Dean “Steve is an excellent teacher and has a vast knowledge of Tableau. I learned a huge amount over the two days that I can immediately apply at work.”John B., Mporium “Steve not only provided a comprehensive explanation of the content of the course, but also allowed time for discussing particular business issues that participants may be facing. That was really useful as part of my learning process.”Juan C., Financial Conduct Authority “Course was fantastic, and completely relevant to the work I am doing with Tableau. I particularly liked Steve’s method of teaching and how he applied the course material to ‘real-life’ use-cases.”Richard W., Dashboard Consulting Ltd “This course was extremely useful and excellent value. It helped me formalise my learning and I have taken a lot of useful tips away which will help me in everyday work.” Lauren M., Baillie Gifford “I would definitely recommend taking this course if you have a working knowledge of Tableau. Even the little tips Steve explains will make using Tableau a lot easier. Looking forward to putting what I’ve learned into practice.”Aron F., Grove & Dean “Steve is an excellent teacher and has a vast knowledge of Tableau. I learned a huge amount over the two days that I can immediately apply at work.”John B., Mporium
Power BI - dashboards (1 day) (In-House)
By The In House Training Company
Power BI is a powerful data visualisation program that allows businesses to monitor data, analyse trends, and make decisions. This course is designed to provide a solid understanding of the reporting side of Power BI, the dashboards, where administrators, and end users can interact with dynamic visuals that communicates information. This course focuses entirely on the creation and design of visualisations in dashboards, including a range of chart types, engaging maps, and different types of tables. Designing dashboards with KPI's (key performance indicators), heatmaps, flowcharts, sparklines, and compare multiple variables with trendlines. This one-day programme focuses entirely on creating dashboards, by using the many visualisation tools available in Power BI. You will learn to build dynamic, user-friendly interfaces in both Power BI Desktop and Power BI Service. 1 Introduction Power BI ecosystem Things to keep in mind Selecting dashboard colours Importing visuals into Power BI Data sources for your analysis Joining tables in Power BI 2 Working with data Utilising a report theme Table visuals Matrix visuals Drilling into hierarchies Applying static filters Group numbers with lists Group numbers with bins 3 Creating visuals Heatmaps in Power BI Visualising time-intelligence trends Ranking categorical totals Comparing proportions View trends with sparklines 4 Comparing variables Insert key performance indicators (KPI) Visualising trendlines as KPI Forecasting with trendlines Visualising flows with Sankey diagrams Creating a scatter plot 5 Mapping options Map visuals Using a filled map Mapping with latitude and longitude Mapping with ArcGIS or ESRI 6 Creating dashboards High-level dashboard Migration analysis dashboard Adding slicers for filtering Promote interaction with nudge prompts Searching the dashboard with a slicer Creating dynamic labels Highlighting key points on the dashboard Customised visualisation tooltips Syncing slicers across pages 7 Sharing dashboards Setting up and formatting phone views Exporting data Creating PDF files Uploading to the cloud Share dashboards in SharePoint online

Microsoft Excel Intermediate (now with live online classes) One-to-One Training
By Microsoft Office Training
Course Objectives The goal of this course is to provide you with the knowledge required to use more advanced functions and formulas and work with various tools to analyse and present data in spreadsheets, such as sorting, filtering, applying conditional formatting and charting the data. ' Customer Feedback Really useful and engaging course. Learnt a lot that will be very beneficial in my job. Trainer was great. Kelly Moreley - TACT Very happy with the course. Worked as a good refresher from what I knew already and enhanced my knowledge further in formulas + vlookup and shortcut keys. Jenny Price - Acer 1 year email support service Take a look at the consistent excellent feedback from our corporate clients visiting our site ms-officetraining co uk With more than 20 years experience, we deliver courses on all levels of the Desktop version of Microsoft Office and Office 365; ranging from Beginner, Intermediate, Advanced to the VBA level. Our trainers are Microsoft certified professionals with a proven track record with several years experience in delivering classroom, one to one, tailored and bespoke courses. Tailored In company training: You can choose to run the course exactly as they are outlined by us or we can customise it so that it meets your specific needs. A tailored or bespoke course will follow the standard outline but may be adapted to your specific organisational needs. Please visit our site (ms-officetraining co uk) to get a feel of the excellent feedback our courses have had and look at other courses you might be interested in. Recap on Excel formulas and calculations Overview of formulas in Excel Relative, Absolute and Mixed cell references Group editing worksheets Autofill and Flash Fill Changing Excel’s environment Options Changing the default number of sheets Creating an Autofill Custom List Adding tools to the Quick Access Toolbar Mastering Excel Tables Introducing Excel Tables Formatting a Table Creating Calculated Columns Using Slicers to filter your data Using Totals to get statistics out of your data Removing duplicates Converting Tables back to normal Ranges Using names Ranges In Excel formulas As a way of navigating through the workbook Advanced Formulas Simple IF examples Using IF to check if a cell is blank Nested IFs VLOOKUP HLOOKUP Text Functions Date Functions Conditional formatting Apply Conditional Formatting Customising Conditional Formatting Using Icons in Conditional Formatting Using Formulas to conditionally format cells Linking spreadsheets and workbooks Making a reference to another worksheet Making a reference to another workbook Editing links Troubleshooting links Analysing databases Quick analysis Sorting a database Apply filters to a database Advance filter Sorting and Filtering by Conditional Formats Charts Analyse trends in data using Sparklines Creating charts from start to finish Exploring the different Chart Types Apply Chart Styles Formatting Chart Elements Filtering Charts by Series or Categories Adding a Trendline to a Chart Create a Chart Template Attaching security to a spreadsheet and workbook Protect Cells Protect Structure of worksheets Protect a Workbook by adding passwords Introduction to Pivot Tables What are Pivot Tables? Using recommended pivot tables to analyse your data Who is this course for? Who is this course for? For those who want to explore in more detail formulas and functions, data analysis and data presentation. Requirements Requirements Preferably, delegates would have attended the Excel Introduction course. Career path Career path Excel know-how can instantly increase your job prospects as well as your salary. 80 percent of job openings require spreadsheet and word-processing software skills

Overview This is a 2 day applied course on XVA for anyone interested in going beyond merely a conceptual understanding of XVA and wants practical examples of Monte Carlo simulation of market risk factors to create exposure distributions and profiles for derivatives used for XVA pricing Learn how to do Monte Carlo simulation of key market risk factors across major asset classes to create exposure distributions and profiles (with and without collateral) for derivatives used for XVA pricing. Learn how to calculate each XVA. Learn sensitivities of each XVA and how XVA desks manage these. Learn regulatory capital treatment of counterparty credit risk (both for CCR and CVA volatility) and how to stress test this within ICAAP or system-wide external, supervisor-led capital stress test. Who the course is for Anyone involved in OTC derivatives XVA traders XVA quants Derivatives traders and salespeople Risk management Treasury staff Internal audit and finance Course Content To learn more about the day by day course content please click here To learn more about schedule, pricing & delivery options, book a meeting with a course specialist now

For all of our courses go to tunneys.co.uk
By Tunneys
professional financial modelling and data analysis courses

AI For Leaders
By Mpi Learning - Professional Learning And Development Provider
In the past, popular thought treated artificial intelligence (AI) as if it were the domain of science fiction or some far-flung future. In the last few years, however, AI has been given new life. The business world has especially given it renewed interest. However, AI is not just another technology or process for the business to consider - it is a truly disruptive force.

Excel - introduction (In-House)
By The In House Training Company
This one-day workshop is designed to give you an awareness of the fundamentals of Microsoft Excel and, in particular, to give you the confidence needed to efficiently create, edit and manage spreadsheets. This course will help participants: Create tables Use functions Manage rows and columns Write formulas Manage sheets Use content formats Handle larger tables Create reports and charts 1 Creating a table Creating an Excel table from scratch Wrapping text in cells Speeding up data entry using AutoFill Sorting columns 2 Inserting function Inserting function calculators Using AutoSum to sum numbers Statistical calculations AVERAGE, MAX and MIN 3 Table rows and columns Inserting and deleting rows and columns Adjusting multiple column widths and row heights Hiding and unhiding rows and columns 4 Formula writing The basics of formula writing Understanding mathematical symbols Using multiple mathematical symbols in a formula When to use brackets Troubleshooting calculation errors 5 Managing sheets Inserting, renaming, moving and deleting sheets Copying a worksheet to another file Copying a table to another sheet 6 Managing content formats Applying data formats Managing number formats Controlling formats with the Format Painter 7 Managing larger tables Applying freeze panes to lock tables when scrolling Sorting on multiple columns Using filters to extract table information 8 Creating and modifying charts Creating a pie chart Creating a column chart Inserting chart titles and data labels Controlling chart formatting Changing chart types 9 Printing Previewing and printing tables and charts Modifying page orientation Adjusting print margins Printing a selection 10 Calculating with absolute reference The difference between a relative and absolute formula Changing a relative formula to an absolute Using $ signs to lock cells when copying formulas 11 Pivot tables Create a pivot table report Insert a pivot chart into a report
Excel - advanced (In-House)
By The In House Training Company
Most people only use a fraction of Excel's capabilities. This workshop shows what you've been missing! This course will help participants: Nest formulas Get the most from pivot tables Use conditional formatting Write array formulas Explore the lookup functions Calculate by criteria Use 'goal seek' and 'scenario manager' for what-if analysis Record macros 1 Nesting formulas Principles of nesting formulas together Using IF with AND or OR to answer questions Nesting an AND function in an IF Nesting an OR function in an IF 2 Advanced pivot table reports Grouping dates, numerical and text items Running percentage analyse Running analyses to compare data Inserting Field calculations Finishing off with a user-friendly dashboard 3 Advanced conditional formatting Colour table rows based on criteria in it Applying colour to approaching dates Exploring the different rule types 4 Lookup functions Going beyond the VLOOKUP function Lookups that retrieve data from left or right The versatile INDEX and MATCH functions Retrieving data from columns with duplicates 5 Calculate by criteria Using SUMIFS to sum by criteria Finding an average by criteria with AVERAGEIFS Use SUMPRODUCT to multiply then add different values 6 What-if analysis Use Goal Seek to meet targets Forecast reports with the Scenario Manager 7 Recording Macros Macro security Understanding a Relative References macro Recording, running and editing macros Saving files as Macro Enabled Workbooks Introduction to VBA code Making macros available across workbooks Add a macro button to the Quick Access toolbar
Excel - intermediate (In-House)
By The In House Training Company
This one-day course focuses on issues such as writing formulas and accessing help while writing them, and taking formulas to the next level by nesting one inside another for a powerful formula result. It also looks at ways of analysing data with reports, summarised by varying criteria. A range of time-saving tips and tricks are shared. This course will help participants: Calculate with absolute reference Group worksheets Link to tables Use the function library effectively Get to grips with the logical IF function Use conditional formatting Create pivot table reports Use data validation Master the VLOOKUP function 1 Calculating with absolute reference The difference between a relative and absolute formula Changing a relative formula to an absolute Using $ signs to lock cells when copying formulas 2 Grouping worksheets Grouping sheets together Inputting data into multiple sheets Writing a 3D formula to sum tables across sheets 3 Linking to tables Linking to a source table Using paste link to link a table to another file Using edit links to manage linked tables 4 The function library Benefits of writing formulas in the function library Finding the right formula using insert function Outputting statistics with COUNTA and COUNTBLANK Counting criteria in a list with COUNTIFS 5 Logical IF Function Outputting results from tests Running multiple tests for multiple results The concept of outputting results from numbers 6 Conditional formatting Enabling text and numbers to standout Applying colour to data using rules Managing rules Copying rules with the format painter 7 View side by side Comparing two Excel tables together Comparing two sheets together in the same file 8 Pivot table reports Analysing data with pivot tables Managing a pivot table's layout Outputting statistical reports Controlling number formats Visualising reports with pivot charts Inserting slicers for filtering data 9 Data validation Restricting data input with data validation Speeding up data entry with data validation 10 VLOOKUP function Best practices for writing a VLOOKUP A false type lookup A true type lookup Enhance formula results with IFNA 11 Print options Getting the most from print Printing page titles across pages Scaling content for print