- Professional Development
- Medicine & Nursing
- Arts & Crafts
- Health & Wellbeing
- Personal Development
54 Courses
Overview This comprehensive course on Complete Microsoft Power BI 2021 will deepen your understanding on this topic. After successful completion of this course you can acquire the required skills in this sector. This Complete Microsoft Power BI 2021 comes with accredited certification from CPD, which will enhance your CV and make you worthy in the job market. So enrol in this course today to fast track your career ladder. How will I get my certificate? You may have to take a quiz or a written test online during or after the course. After successfully completing the course, you will be eligible for the certificate. Who is This course for? There is no experience or previous qualifications required for enrolment on this Complete Microsoft Power BI 2021. It is available to all students, of all academic backgrounds. Requirements Our Complete Microsoft Power BI 2021 is fully compatible with PC's, Mac's, Laptop, Tablet and Smartphone devices. This course has been designed to be fully compatible with tablets and smartphones so you can access your course on Wi-Fi, 3G or 4G. There is no time limit for completing this course, it can be studied in your own time at your own pace. Career Path Learning this new skill will help you to advance in your career. It will diversify your job options and help you develop new techniques to keep up with the fast-changing world. This skillset will help you to- Open doors of opportunities Increase your adaptability Keep you relevant Boost confidence And much more! Course Curriculum 15 sections • 140 lectures • 14:25:00 total length •Welcome!: 00:01:00 •What is Power BI?: 00:03:00 •Download & Installing Power BI Desktop: 00:04:00 •Getting to know the interface: 00:03:00 •Mini Project: Transform Data: 00:07:00 •Mini Project: Visualize Data: 00:05:00 •Mini Project: Creating a Data Model: 00:07:00 •Course Outline: What will you learn in this course?: 00:05:00 •How to learn best with this course?: 00:03:00 •Creating our initial project file: 00:04:00 •Working with the attached project files: 00:04:00 •Exploring the Query Editor: 00:06:00 •Connecting to our data source: 00:07:00 •Editing rows: 00:08:00 •Changing data types: 00:08:00 •Replacing values: 00:03:00 •Close & Apply: 00:03:00 •Connecting to a csv file: 00:03:00 •Connecting to a web page: 00:05:00 •Extracting characters: 00:06:00 •Splitting & merging columns: 00:09:00 •Creating conditional columns: 00:06:00 •Creating columns from examples: 00:09:00 •Merging Queries: 00:17:00 •Pivoting & Unpivoting: 00:06:00 •Appending Queries: 00:08:00 •Practice & Solution: Population table: 00:15:00 •The Fact-Dimension-Model: 00:09:00 •Practice: Load the dimension table: 00:04:00 •Organizing our queries in groups: 00:03:00 •Entering data manually: 00:05:00 •Creating an index column: 00:03:00 •Workflow & more transformations: 00:05:00 •Module summary: 00:05:00 •Exercise 1 - Instruction: 00:02:00 •Exercise 1 - Exercise Solution: 00:11:00 •Advanced Editor - Best practices: 00:09:00 •Performance: References vs. Duplicating: 00:10:00 •Performance: Enable / Disable Load & Report Refresh: 00:05:00 •Group by: 00:05:00 •Mathematical Operations: 00:05:00 •Run R Script: 00:15:00 •Using Parameters to dynamically transform data: 00:06:00 •M formula language: Basics: 00:07:00 •M formula language: Values, Lists & Tables: 00:14:00 •M formula language: Functions: 00:13:00 •M formula language: More functions & steps: 00:05:00 •Exercise 2 - Instructions: 00:01:00 •Exercise 2 - solution: 00:05:00 •Understanding the relationship: 00:05:00 •Create & edit relationships: 00:06:00 •One-to-many & one-to-one relationship: 00:06:00 •Many-to-many (m:n) relationship: 00:08:00 •Cross filter direction: 00:06:00 •Activate & deactivate relationships: 00:06:00 •Model summary: 00:03:00 •Exercise 3 Create Model: 00:02:00 •Exercise 3 Solution: 00:02:00 •Our first visual: 00:08:00 •The format tab: 00:12:00 •Understanding tables: 00:10:00 •Conditional formatting: 00:09:00 •The Pie Chart: 00:06:00 •All about the filter visual: 00:13:00 •The filter pane for developers: 00:09:00 •Cross filtering & edit interactions: 00:04:00 •Syncing slicers across pages: 00:07:00 •Creating drill downs: 00:08:00 •Creating drill throughs: 00:07:00 •The tree map visual: 00:07:00 •The decomposition tree: 00:05:00 •Understanding the matrix visual: 00:05:00 •Editing pages: 00:07:00 •Buttons & Actions: 00:09:00 •Bookmarks to customize your report: 00:10:00 •Analytics and Forecasts with line charts: 00:10:00 •Working with custom visuals: 00:07:00 •Get data using R Script & R Script visual: 00:08:00 •Asking questions - Q&A visual: 00:04:00 •Wrap up - data visualization: 00:08:00 •Python in Power BI - Plan of attack: 00:03:00 •Setting up Python for Power BI: 00:03:00 •Transforming data using Python: 00:11:00 •Creating visualizations using Python: 00:08:00 •Violin plots, pair plots & ridge plots using Python: 00:15:00 •Machine learning (BayesTextAnalyzer) using Python: 00:00:00 •Performance & Troubleshooting: 00:03:00 •Introduction: 00:01:00 •Show Empathy & Identify the Requirement: 00:03:00 •Finding the Most Suitable KPI's: 00:02:00 •Choose an Effective Visualization: 00:04:00 •Make Use of Natural Reading Pattern: 00:03:00 •Tell a Story Using Visual Cues: 00:05:00 •Avoid Chaos & Group Information: 00:02:00 •Warp Up - Storytelling with Data: 00:02:00 •Introduction: 00:03:00 •The project data: 00:04:00 •Measures vs. Calculated Columns: 00:15:00 •Automatically creating a date table in DAX: 00:08:00 •CALENDAR: 00:05:00 •Creating a complete date table with features: 00:04:00 •Creating key measure table: 00:03:00 •Aggregation functions: 00:06:00 •The different versions of COUNT: 00:14:00 •SUMX - Row based calculations: 00:09:00 •CALCULATE - The basics: 00:11:00 •Changing the context with FILTER: 00:07:00 •ALL: 00:08:00 •ALL SELECTED: 00:03:00 •ALL EXCEPT: 00:07:00 •How to go on now?: 00:03:00 •Power BI Pro vs Premium & Signing up: 00:04:00 •Exploring the interface: 00:04:00 •Discovering your workspace: 00:03:00 •Connecting Power BI Desktop & Cloud: 00:04:00 •Understanding datasets & reports: 00:03:00 •Working on reports: 00:04:00 •Updating reports from Power BI Desktop: 00:04:00 •Creating and working with workspaces: 00:07:00 •Installing & using a data gateway: 00:13:00 •Get Quick Insights: 00:03:00 •Creating dashboards: 00:04:00 •Sharing our results through Apps: 00:10:00 •Power BI Mobile App: 00:05:00 •Creating the layout for the Mobile App: 00:04:00 •Wrap up - Power BI Cloud: 00:07:00 •Introduction: 00:03:00 •Creating a Row-Level Security: 00:05:00 •Row-Level Security in the Cloud: 00:04:00 •Row-Level Security & Data Model: 00:05:00 •Dynamic Row-Level Security: 00:07:00 •Dynamic Many-to-Many RLS: 00:04:00 •Hierarchical Row-Level Security: 00:13:00 •JSON & REST API: 00:10:00 •Setting up a local MySQL database: 00:14:00 •Connecting to a MySQL database in Power BI: 00:05:00 •Connecting to a SQL database (PostgreSQL): 00:05:00 •Congratulations & next steps: 00:06:00 •The End: 00:01:00 •Resources - Complete Microsoft Power BI 2021: 00:00:00

Kick Start Your Career with CompTIA's Data Analysis Certification - Live Classes
(1)By Media Tek Training Solutions Ltd
Get job ready with CompTIA's Data Analysis Certification. Live Classes - Career Guidance - Exam Included.
Course Overview: Data analysis is a hot skill in today's job market. According to a recent study by LinkedIn, demand for data analysts is growing 15 times faster than the average for all occupations. And the salaries are good too. The average salary for a data analyst in the UK is £40,000. If you're looking to get ahead in your career or learn a new skill that's in high demand, then the Data Analysis in Excel Level 3 Course is for you. In this course, you'll learn how to use Excel to analyse data like a pro. You'll learn how to clean, format, and analyse data using various Excel tools and techniques. You'll also learn how to create charts and graphs to visualise your data. This course won't merely make you adept at Excel. It will mould you into a data wizard, wielding Excel as a potent tool to make data sing and secrets reveal themselves. Enrol Today and Start Learning! Key Features of the Course: Embark on your data analysis journey with us and discover these exciting features: A CPD Certificate to validate your newfound skills. 24/7 Learning Assistance for any hour inspiration strikes. Engaging learning materials to ensure an enriching learning experience. Who is This Course For? Our Data Analysis in Excel Level 3 Course caters to ambitious individuals with a basic understanding of Excel, eager to take their skills to new heights. This course welcomes everything from budding data enthusiasts to established business analysts seeking to fortify their analytical toolkits. What You Will Learn: Dive deep into the labyrinth of data as you master essential modules such as 'Search for and Replace Data,' 'Sort and Filter Data,' and 'Query Data with Database Functions.' Venture further into data exploration with our 'Outline and Subtotal Data' module, where you'll learn to summarise your data for a more organised view efficiently. The journey continues with modules like 'Create Charts' and 'Modify and Format Charts,' enabling you to translate complex data into easy-to-understand visuals. Furthermore, our dedicated modules on 'Creating a PivotTable' and 'Analysing PivotTable Data' promise a comprehensive understanding of one of Excel's most powerful tools. Why Enrol in This Course: Rated as a top-reviewed course and constantly updated to keep up with the latest trends, our Data Analysis in Excel Level 3 Course equips you with sought-after skills like data forecasting, creating sparklines, using advanced chart features, and more. Requirements: While no specific prerequisites are required, a basic understanding of Excel and an eagerness to explore the fascinating world of data analysis would be beneficial. Career Path: On completion of this Data Analysis in Excel Level 3 Course course, you'll be ready to step into diverse roles such as: Data Analyst (£30,000-£35,000) Business Intelligence Analyst (£32,000-£37,000) Market Research Analyst (£28,000-£33,000) Operations Analyst (£31,000-£36,000) Financial Analyst (£35,000-£40,000) Supply Chain Analyst (£30,000-£35,000) Sales Analyst (£29,000-£34,000) Certification: Upon successful completion of the course, you'll be awarded a prestigious CPD Certificate, demonstrating your expertise in data analysis using Excel. So, are you ready to discover the hidden stories in data and revolutionise decision-making? Enrol in our Data Analysis in Excel Level 3 Course and start your journey today! Course Curriculum 11 sections • 32 lectures • 04:43:00 total length •Insert, Delete, and Adjust Cells, Columns, and Rows: 00:10:00 •Search for and Replace Data: 00:09:00 •Use Proofing and Research Tools: 00:07:00 •Sort Data: 00:10:00 •Filter Data: 00:10:00 •Query Data with Database Functions: 00:09:00 •Outline and Subtotal Data: 00:09:00 •Apply Intermediate Conditional Formatting: 00:07:00 •Apply Advanced Conditional Formatting: 00:05:00 •Create Charts: 00:13:00 •Modify and Format Charts: 00:12:00 •Use Advanced Chart Features: 00:12:00 •Create a PivotTable: 00:13:00 •Analyze PivotTable Data: 00:12:00 •Present Data with PivotCharts: 00:07:00 •Filter Data by Using Timelines and Slicers: 00:11:00 •Use Links and External References: 00:12:00 •Use 3-D References: 00:06:00 •Consolidate Data: 00:05:00 •Use Lookup Functions: 00:12:00 •Trace Cells: 00:09:00 •Watch and Evaluate Formulas: 00:08:00 •Apply Data Validation: 00:13:00 •Search for Invalid Data and Formulas with Errors: 00:04:00 •Work with Macros: 00:18:00 •Create Sparklines: 00:07:00 •MapData: 00:07:00 •Determine Potential Outcomes Using Data Tables: 00:08:00 •Determine Potential Outcomes Using Scenarios: 00:09:00 •Use the Goal Seek Feature: 00:04:00 •Forecasting Data Trends: 00:05:00 •Assignment - Data Analysis in Excel Level 3 Course: 00:00:00

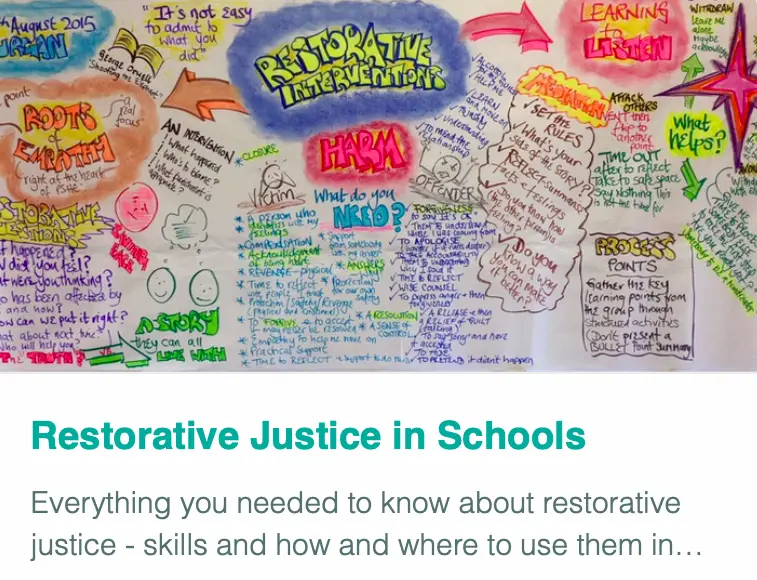
Restorative Justice
By Inclusive Solutions
Restorative Interventions in Schools A “Restorative Solution” is a non-adversarial approach to conflict resolution where the person who has done something wrong in a given situation becomes accountable to those s/he has harmed. This person is then given the opportunity to “make up” for their inappropriate behaviour through agreement and reparation. An intervention can involve a formal conference, or it can be a simple conversation on a corridor or playground. Restorative Interventions work with all ages of young people, and the techniques can be used in parental meetings, can prevent exclusions and challenge poor behaviour. Our feedback tells us that when problems between young people are addressed in this way, those problems rarely reoccur. Course Category Behaviour and Relationships Teaching and Learning Description Restorative Interventions in Schools A “Restorative Solution” is a non-adversarial approach to conflict resolution where the person who has done something wrong in a given situation becomes accountable to those s/he has harmed. This person is then given the opportunity to “make up” for their inappropriate behaviour through agreement and reparation. An intervention can involve a formal conference, or it can be a simple conversation on a corridor or playground. Restorative Interventions work with all ages of young people, and the techniques can be used in parental meetings, can prevent exclusions and challenge poor behaviour. Our feedback tells us that when problems between young people are addressed in this way, those problems rarely reoccur. Also Available on line– self paced learning… give it a try! Testimonials ‘Interesting. A different approach. Another ‘weapon’ in the armoury. Will try to use.’ ‘Made me think how I can approach confrontations differently. Useful, reminded me where my focus should be and that things will be difficult at times, but that’s no excuse to stay in the comfort zone!’ ‘Excellent day. Lots of ideas to take away and use on a daily basis. Thanks.’ ‘Nice to do some work on behaviour without sanctions and restraints in mind’ Learning Objectives To introduce participants to Restorative Interventions To develop understanding of value and role in developing inclusive practice of Restorative Interventions To develop and practise Restorative Intervention skills processes Opportunity to reflect on professional practice Mutual support established with other ‘front line’ practitioners Who Is It For ? Multi Agency Teams Social workers CAMHS teams Year Managers Primary and secondary staff Early Years and School based Practitioners Heads and Deputies SENCOs Advanced Skills Teachers Primary and secondary teachers Local Authority Support Services Course Content This can be introduced in one day or as a workshop but is better offered over a series of sessions. The course answers the questions: What should we do if rewards and punishments do not work? Can we find an alternative process to recommending permanent exclusion or special unit or school placement? Struggling with a child for whom praise and sanctions seem ineffective? Want to develop a more restorative school or team? I need a process which works with relationships not just behaviour. What will work for our relationships policy? This day’s training will enable participants to facilitate Short Restorative Conferences, and will suggest ways of working with young people and others that will help to repair broken relationships, and challenge some difficult behaviour. Including all those affected by an incident in its resolution is a powerful way of producing significant improvements in behaviour. We will cover: What are restorative solutions? Background and detailed teaching of processes Inclusion values underpinning this work Processes modelled and opportunities to try process out Practical setting up of restorative conferences Stories and outcomes
Online Options
Show all 51Introduction to DAX for Power BI
By Nexus Human
Duration 2 Days 12 CPD hours This course is intended for This course is intended for business users who have been using Power BI to build analytic solutions and are ready to take advantage of the power and flexibility that DAX provides. Learning DAX is a very common 'next step' for experienced Power BI users. Overview At course completion, you should be able to describe DAX syntax, data types, and errors use DAX to create calculated columns, measures, and tables explain how DAX calculations are evaluated, along with the differences between row context and filter context configure and use Time Intelligence to perform common time-based calculations, for example to-date calculations, year-over-year analysis, moving averages, etc. create calculated columns and measures that use data from multiple tables in the data model write measures that handle error conditions gracefully use DAX to enhance the Power BI user experience use DAX Studio to connect to a Power BI data model and execute simple queries Welcome to Introduction to DAX for Power BI. This two-day instructor-led course is intended for business users who have been using Power BI and want to use DAX to create custom calculations in their data models. In this class, you will be introduced to using Data Analysis Expressions (DAX), which is the expression language that is used to create custom calculations in the Power BI Data model. The course covers some of the theoretical underpinnings of the data model and the DAX language, but the emphasis is on using DAX to solve common business problems. You will learn how to write your own calculated columns, measures, and tables, how to visualize the way Power BI computes DAX calculations, and how to troubleshoot custom code. MODULE 1: GETTING STARTED WITH DAX INTRODUCTION TODAX CREATING OBJECTS WITHDAX CONTEXT AND RULES OF EVALUATION VARIABLES,COMMENTS,AND TESTING MODULE 2: PERFORMING BASIC CALCULATIONS GETTING STARTED IMPLICIT MEASURES ADDING QUICK MEASURES WORKING WITH DAX DATA TYPES . DOING BASIC MATH USING LOGIC IN YOUR CALCULATIONS USING THE IF() FUNCTION NESTED IF() USING THE SWITCH() FUNCTION ADVANCED SWITCH() LOGICAL OPERATORS & FUNCTIONS: ||, OR(), &&, AND(), NOT() AGGREGATING AND SUMMARIZING DATA THE SUM() FUNCTION MODULE 3: WORKING WITH CONTEXT IN THE DATA MODEL CONTEXT DEFINED DATA MODELING BASICS INTRODUCTION TO DIMENSIONAL MODELING RELATIONSHIPS AND THEIR EFFECT ON THE EVALUATION CONTEXT GETTING DATA FROM OTHER TABLES USING RELATED() AND RELATEDTABLE LOOKING UP DATA WITHOUT USING RELATIONSHIPS MODIFYING THE CONTEXT USING CALCULATE() MODULE 4: PERFORMING MORE ADVANCED CALCULATIONS THE DAX ITERATOR FUNCTIONS USING TABLE MANIPULATION FUNCTIONS MODULE 5: WORKING WITH TIME PERFORMING DATE CALCULATIONS WORKING WITH DATE TABLES GENERATING A DATE TABLE WITH THE CALENDAR() FUNCTION DEFINING CUSTOM OPERATING PERIODS YTD, QTD, AND MTD CALCULATIONS CUSTOM TO-DATE CALCULATIONS FINDING YEAR-OVER-YEAR CHANGE FINDING MOVING AVERAGES MODULE 6: ENHANCING THE USER EXPERIENCE CONTROLLING VISIBILITYOF YOUR MEASURES USING WHAT-IF PARAMETERS ADDING BANDING USING DAX TO PROVIDE ROW-LEVEL SECURITY

DAX In A Day (DAXIAD)
By Online Productivity Training
OVERVIEW Prerequisites—DIAD training and Advanced Data Modeling and Shaping training or equivalent working experience This course has been designed specifically for experienced model developers and gives a more advanced treatment of DAX formulas than either DIAD or the PL-300 course. We recommend that attendees have prior experience working with Power BI Desktop to create data models. During this course you will review: Writing DAX formulas. Defining calculated tables and columns. Defining measures. Using DAX iterator functions. Modifying filter context. Using DAX time intelligence functions. After completing this training, the attendees should be able to work with Data Analysis Expressions (DAX), perform calculations and define common business calculations for use in reports, address performance and functionality concerns. COURSE BENEFITS: Understand Analytic queries in Power BI Create calculated tables, calculated columns and measures Use DAX functions and operators to build DAX formulas Use DAX iterator functions Create formulas that manipulate the filter context Use DAX time intelligence functions WHO IS THE COURSE FOR? Analysts with experience of Power BI wishing to develop more advanced formulas in DAX Power BI developers who wish to deepen their understanding of the process of calculating formulas so as to make development faster and more reliable LAB OUTLINE Lab 1 Setup Connect to data and understand the objectives of the future labs Lab 2 Write DAX Formulas For Power BI Create a measure Use variables in the measure definition Lab 3 Add Calculated Table And Columns Duplicate a table Create a hierarchy Create a date table Add calculated columns Lab 4 Add Measures To Power BI Desktop Models Add an implicit measure to a report Add an explicit measure Add a compound measure Add a quick measure Lab 5 Use DAX Iterator Functions In A Power BI Desktop Model Complex summarization Higher grain summarization Create ranking measure Lab 6 Modify DAX Filter Context In Power BI Desktop Models Apply Boolean expression filter Remove filters: use ALL Remove filters: use AllSelected Preserve filters: use KeepFilters HASONEVALUE ISINSCOPE Context transition Lab 7 Use DAX Time Intelligence Functions In Power BI Desktop Models TOTALYTD SAMEPERIODLASTYEAR Calculate new occurrences Snapshot calculations

Power BI Masterclass 8 -Python, Finance, and Advanced DAX
By Packt
This comprehensive training program covers many concepts in Microsoft Power BI. From beginner to advanced levels, learn data visualization, advanced DAX expression, Python integration, custom visuals, data preparation, and collaboration in Power BI service. Develop expertise in Power BI and position yourself for a successful career in data analytics.

Mastering the Power BI Key Fundamentals
By Packt
This course teaches the fundamental concepts of DAX in Power BI. If you have the questions: How do I learn DAX? What is the best way to learn DAX fast?-then this is the best course for you. This course teaches fundamental concepts and does not cover visualization or various advanced DAX patterns for specific questions.
Power BI Masterclass 2023
By Packt
This comprehensive course delves deep into Power BI, guiding you through essential skills such as interactive reporting, DAX calculations, and advanced data modelling. From enabling interactive features to crafting insightful reports, gain the expertise needed to harness Power BI's full potential and excel in data analysis and visualization.

Power BI Masterclass
By Packt
An intermediate-level course that will help you improve your Power BI skills and become an expert data analyst or data scientist. The course is carefully structured to provide an in-depth understanding of Microsoft Power BI and its features, along with some important tips and tricks.
Advanced Data Modelling and Shaping (MSIAD)
By Online Productivity Training
OVERVIEW Prerequisites—DIAD training or equivalent working experience This one-day course will cover using Power BI Desktop to import and shape data from a variety of sources. It will also walk through Power BI capabilities you can use to enhance the data model for your business users. The course covers key aspects of how to create a great data model to meet your business needs, various features in Power BI used to enhance data models so you can build great reports, and an introduction to DAX to create calculations. After completing this training, the attendees should be able to import data from a variety of data sources into Power BI, shape the data, create the data model, and write DAX functions to the Power BI model. COURSE BENEFITS: Understand the Power BI Desktop data model, its components and most effective schemas Describe concepts of calculated columns and measures Create queries using M Create calculations with DAX Understand the use of functions Create and optimize a data model Understand the consequences of data model design decisions WHO IS THE COURSE FOR? Power BI report developers who wish to improve the structure of their data models Power BI report developers who wish to use advanced features like parameters and M coding in Power Query Power BI practitioners who wish to optimise their models more effectively Attendees wishing to prepare thoroughly for the DAX In A Day course COURSE OUTLINE Module 1 Getting And Shaping The Data Understand what is meant by data model in the context of Power BI Understand the consequences of data model design decisions Understand consequences of Power BI’s data type handling Understand data connection options Module 2 Basic Data Modelling Understand basic data modelling Understand basic data model types Explore dimension tables and fact tables Explore data connections Module 3 Getting Started With M (Power Query Language) Get introduced to M Understand key components and syntax Module 4 Understanding Logic Operators Understand Transformations Understand Join operation Module 5 Introduction To DAX Get introduced to DAX and how can it be used Understand working with parameters and DAX (lab combining the previous module) Module 6 Working With Functions - DAX CALCULATE And More Understand working with functions Understand the basics of the CALCULATE formula Module 7 Modelling With Power BI & DAX Best Practice Gain familiarity with basic data modelling for business scenarios Learn some best practices for working with Power BI

Power BI Data Analyst (PL300)
By Online Productivity Training
OVERVIEW This official Microsoft Power BI training course will teach you how to connect to data from many sources, clean and transform it using Power Query, create a data model consisting of multiple tables connected with relationships and build visualisations and reports to show the patterns in the data. The course will explore formulas created using the DAX language, including the use of advanced date intelligence calculations. Additional visualisation features including interactivity between the elements of a report page are covered as well as parameters and row-level security, which allows a report to be tailored according to who is viewing it. The course will also show how to publish reports and dashboards to a workspace on the Power BI Service. COURSE BENEFITS: Learn how to clean, transform, and load data from many sources Use database queries in Power Query to combine tables using append and merge Create and manage a data model in Power BI consisting of multiple tables connected with relationships Build Measures and other calculations in the DAX language to plot in reports Manage advanced time calculations using date tables Optimise report calculations using the Performance Analyzer Manage and share report assets to the Power BI Service Prepare for the official Microsoft PL-300 exam using Microsoft Official Courseware WHO IS THE COURSE FOR? Data Analysts with little or no experience of Power BI who wish to upgrade their knowledge to include Business Intelligence Management Consultants who need to conduct rapid analysis of their clients’ data to answer specific business questions Analysts who need to upgrade their organisation from a simple Excel or SQL-based management reporting system to a dynamic BI system Data Analysts who wish to develop organisation-wide reporting in the form of web reports or phone apps Marketers in data-intensive organisations who wish to build visually appealing, dynamic charts for their stakeholders to use COURSE OUTLINE Module 1 Getting Started With Microsoft Data Analytics Data analytics and Microsoft Getting Started with Power BI Module 2 Get Data In Power BI Get data from various data sources Optimize performance Resolve data errors Lab: Prepare Data in Power BI Desktop Module 3 Clean, Transform And Load Data In Power BI Data shaping Data profiling Enhance the data structure Lab: Load Data in Power BI Desktop Module 4 Design A Data Model In Power BI Introduction to data modelling Working with Tables Dimensions and Hierarchies Lab: Model Data in Power BI Desktop Module 5 Create Model Calculations Using DAX In Power BI Introduction to DAX Real-time Dashboards Advanced DAX Lab 1: Create DAX Calculations in Power BI Desktop, Part 1 Lab 2: Create DAX Calculations in Power BI Desktop, Part 2 Module 6 Optimize Model Performance Optimize the data model for performance Optimize DirectQuery models Module 7 Create Reports Design a Report Enhance the Report Lab 1: Design a Report in Power BI Desktop, Part 1 Lab 2: Design a Report in Power BI Desktop, Part 2 Module 8 Create Dashboards Create a Dashboard Real-time Dashboards Enhance a Dashboard Lab: Create a Power BI Dashboard Module 9 Perform Advanced Analytics Advanced analytics Data Insights through AI Visuals Lab: Perform Data Analysis in Power BI Desktop Module 10 Create And Manage Workspaces Creating Workspaces Sharing and managing assets Module 11 Manage Datasets In Power BI Parameters Datasets Module 12 Row-Level Security Security in Power BI Lab: Enforce Row-Level Security