- Professional Development
- Medicine & Nursing
- Arts & Crafts
- Health & Wellbeing
- Personal Development
6127 Courses
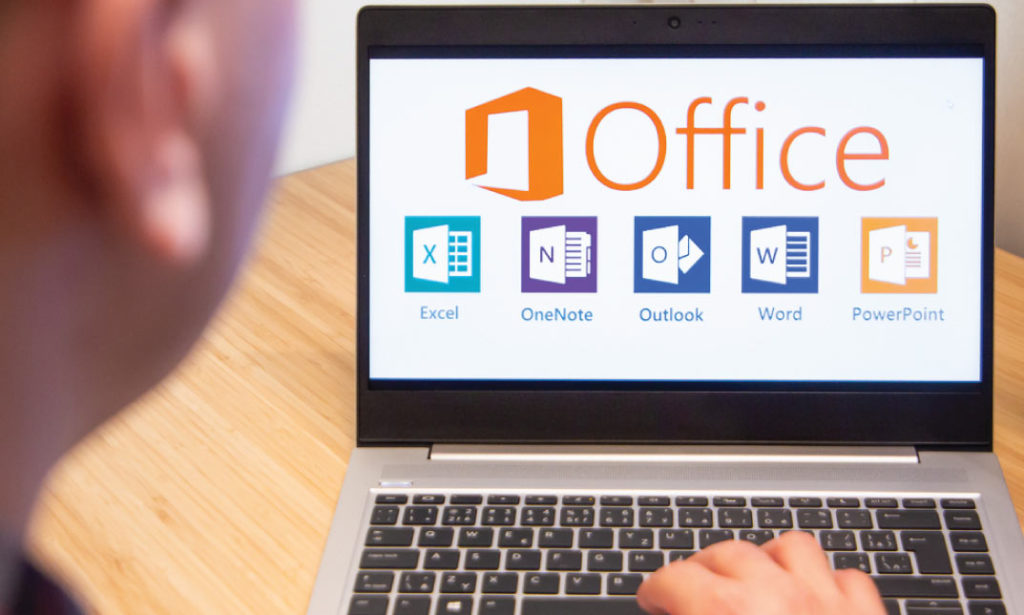
Description: This Microsoft Office 2016 PowerPoint Beginners - Complete Video Course covers the basic functions and features of PowerPoint 2016. This series begins with an introduction in developing a PowerPoint presentation. Here, you will learn about advanced text editing, utilizing graphical elements, manipulate an existing PowerPoint presentation, create a new presentation based on a template and design a blank presentation selecting various slide layouts. Learn to print a presentation using special print options, modify a presentation using different outline views, edit and delete text in the title and bulleted placeholders etc. If you want to know more in details, join this course. You will get all the basic knowledge from this course. Assessment: At the end of the course, you will be required to sit for an online MCQ test. Your test will be assessed automatically and immediately. You will instantly know whether you have been successful or not. Before sitting for your final exam you will have the opportunity to test your proficiency with a mock exam. Certification: After completing and passing the course successfully, you will be able to obtain an Accredited Certificate of Achievement. Certificates can be obtained either in hard copy at a cost of £39 or in PDF format at a cost of £24. Who is this Course for? Microsoft Office 2016 PowerPoint Beginner - Complete Video Course is certified by CPD Qualifications Standards and CiQ. This makes it perfect for anyone trying to learn potential professional skills. As there is no experience and qualification required for this course, it is available for all students from any academic background. Requirements Our Microsoft Office 2016 PowerPoint Beginner - Complete Video Course is fully compatible with any kind of device. Whether you are using Windows computer, Mac, smartphones or tablets, you will get the same experience while learning. Besides that, you will be able to access the course with any kind of internet connection from anywhere at any time without any kind of limitation. Career Path After completing this course you will be able to build up accurate knowledge and skills with proper confidence to enrich yourself and brighten up your career in the relevant job market. Module 01 Navigate the PowerPoint Environment FREE 00:28:00 View and Navigate a Presentation 00:15:00 Create and Save a PowerPoint Presentation 00:13:00 Use PowerPoint Help 00:10:00 Module 02 Select a Presentation Type 00:08:00 Edit Text 00:13:00 Build a Presentation 00:27:00 Module 03 Format Characters 00:11:00 Format Paragraphs 00:16:00 Format Text Boxes 00:09:00 Module 04 Insert Images 00:10:00 Insert Shapes 00:15:00 Module 05 Edit Objects 00:16:00 Format Objects 00:06:00 Group Objects 00:04:00 Arrange Objects 00:07:00 Animate Objects 00:07:00 Module 06 Create a Table 00:09:00 Format a Table 00:03:00 Insert a Table from Other Microsoft Office Applications 00:06:00 Module 07 Create a Chart 00:10:00 Format a Chart 00:10:00 Insert a Chart from Microsoft Excel 00:05:00 Module 08 Review Your Presentation 00:11:00 Apply Transitions 00:05:00 Print Your Presentation 00:05:00 Deliver Your Presentation 00:08:00 Mock Exam Mock Exam- Microsoft Office 2016 PowerPoint Beginner - Complete Video Course 00:20:00 Final Exam Final Exam- Microsoft Office 2016 PowerPoint Beginner - Complete Video Course 00:20:00 Certificate and Transcript Order Your Certificates and Transcripts 00:00:00

Description: For the individuals who are as of now acquainted with the basics of PowerPoint, they will begin thinking to pass on information unmistakably without much glamour. But, the secret of success is lying on how quick you can change a basic introduction into an expert one. Get ready to take your presentations to the advance level! In this course, we'll unlock the secrets to make you a PowerPoint expert. Students will learn how to deal with the advanced features of Microsoft PowerPoint. They will be shown a practical way of learning with a hands-on and customisable approach. They will get a chance to experience some of the new features that are offered in PowerPoint. In this course you will learn the necessary skills, knowledge and information of Microsoft PowerPoint. Who is this course for? Professionals who use PowerPoint on a daily basis to build content heavy, professional presentations on pitching business. This course would be ideal for individuals who wish to develop their skills of using Microsoft PowerPoint application. Entry Requirement: This course is available to all learners, of all academic backgrounds. Learners should be aged 16 or over to undertake the qualification. Good understanding of English language, numeracy and ICT are required to attend this course. Assessment: At the end of the course, you will be required to sit an online multiple-choice test. Your test will be assessed automatically and immediately so that you will instantly know whether you have been successful. Before sitting for your final exam you will have the opportunity to test your proficiency with a mock exam. Certification: After you have successfully passed the test, you will be able to obtain an Accredited Certificate of Achievement. You can however also obtain a Course Completion Certificate following the course completion without sitting for the test. Certificates can be obtained either in hardcopy at a cost of £39 or in PDF format at a cost of £24. PDF certificate's turnaround time is 24 hours and for the hardcopy certificate, it is 3-9 working days. Why choose us? Affordable, engaging & high-quality e-learning study materials; Tutorial videos/materials from the industry leading experts; Study in a user-friendly, advanced online learning platform; Efficient exam systems for the assessment and instant result; The UK & internationally recognised accredited qualification; Access to course content on mobile, tablet or desktop from anywhere anytime; The benefit of career advancement opportunities; 24/7 student support via email. Career Path: The Microsoft PowerPoint Advanced Level will be very beneficial and helpful, especially to the following professionals: Admin Assistant PA Secretary Administrator Office Manager Microsoft PowerPoint Advanced Level Module One - Getting Started 00:30:00 Module Two - Working with Shapes 01:00:00 Module Three - Working with Text Boxes 01:00:00 Module Four - Adding SmartArt 01:00:00 Module Five - Advanced Drawing Tasks 01:00:00 Module Six - Adding Tables 01:00:00 Module Seven - Inserting Audio and Video 01:00:00 Module Eight - PowerPoint's Research Tools 01:00:00 Module Nine - Preparing for Your Presentation 01:00:00 Module Ten - Using Slide Masters 01:00:00 Module Eleven - Advanced Presentation Tasks 01:00:00 Module Twelve - Wrapping Up 00:30:00 Activities Activities-Microsoft PowerPoint Advanced Level 00:00:00 Mock Exam Mock Exam- Microsoft PowerPoint Advanced Level 00:20:00 Final Exam Final Exam- Microsoft PowerPoint Advanced Level 00:20:00 Order Your Certificate and Transcript Order Your Certificates and Transcripts 00:00:00
Description: Microsoft PowerPoint is one of the most abundantly used presentation program. The 2016 version has some revolutionary features that has made this program effortless to work with. Microsoft PowerPoint 2016 Beginner to Advanced will teach you all the aspects for making the best presentation. In this course, you will learn about the interface of the PowerPoint. After that, you will get accustomed on developing a PowerPoint Presentation, Performing advanced text editing, adding graphical elements to your presentation, modify objects, adding tables and charts and preparing to deliver your presentation. Advanced topics include customizing design templates and slide shows, working with media and animations, collaborating, securing and distributing a presentation. These skills will help you get most of the software. Learning Outcomes: Utilize the PowerPoint user interface, creating and saving presentations, and using help Making presentations through presentation options like selecting types, building it, layouts, text editing, viewing and navigation Discover methods for formatting characters, paragraphs, and text boxes Adding images, screenshots, screen recordings, shapes and WordArt Modifying options for objects and animation features Creating and formatting a table and integrating data from other Microsoft Office applications Create format and manipulate a chart PowerPoint environment and how to modify it according to needs Customizing user interface and setting up options Create and manage sections, modify slide masters and slide layouts, add headers and footers, modify notes master and handout master Creating and modifying SmartArt Adding audio video to presentations and customizing animations and transitions to enhance presentation Better collaboration by adding comments, reviews, storing and sharing presentations on the web Setting up and creating custom slide shows, adding hyperlink and action buttons, and recording a presentation Security and distribution of presentations through various outlets Assessment: At the end of the course, you will be required to sit for an online MCQ test. Your test will be assessed automatically and immediately. You will instantly know whether you have been successful or not. Before sitting for your final exam you will have the opportunity to test your proficiency with a mock exam. Certification: After completing and passing the course successfully, you will be able to obtain an Accredited Certificate of Achievement. Certificates can be obtained either in hard copy at a cost of £39 or in PDF format at a cost of £24. Who is this Course for? Microsoft PowerPoint 2016 Beginner to Advanced is certified by CPD Qualifications Standards and CiQ. This makes it perfect for anyone trying to learn potential professional skills. As there is no experience and qualification required for this course, it is available for all students from any academic background. Requirements Our Microsoft PowerPoint 2016 Beginner to Advanced is fully compatible with any kind of device. Whether you are using Windows computer, Mac, smartphones or tablets, you will get the same experience while learning. Besides that, you will be able to access the course with any kind of internet connection from anywhere at any time without any kind of limitation. Career Path After completing this course you will be able to build up accurate knowledge and skills with proper confidence to enrich yourself and brighten up your career in the relevant job market. PowerPoint Beginner Navigate the PowerPoint Environment 00:30:00 ACTIVITY - NAVIGATING THE POWERPOINT 2016 USER INTERFACE 00:05:00 Create and Save a PowerPoint Presentation 00:15:00 ACTIVITY - CREATING AND SAVING A POWERPOINT PRESENTATION 00:05:00 Use Help 00:15:00 ACTIVITY - USING POWERPOINT HELP 00:05:00 Select a Presentation Type 00:15:00 ACTIVITY - SELECTING A PRESENTATION TYPE 00:05:00 Build a Presentation 00:15:00 ACTIVITY - BUILDING A PRESENTATION 00:05:00 Lay Out a Presentation 00:15:00 ACTIVITY - LAYING OUT A PRESENTATION 00:05:00 Edit Text 00:15:00 ACTIVITY - EDITING TEXT 00:05:00 View and Navigate a Presentation 00:15:00 ACTIVITY - VIEWING A PRESENTATION 00:05:00 Format Characters 00:15:00 ACTIVITY - FORMATTING CHARACTERS 00:05:00 Format Paragraphs 00:30:00 ACTIVITY - FORMATTING PARAGRAPHS 00:05:00 Format Text Boxes 00:15:00 ACTIVITY - FORMATTING TEXT BOXES 00:05:00 Insert Images 00:30:00 ACTIVITY - INSERTING IMAGES 00:05:00 Insert Shapes 00:15:00 ACTIVITY - INSERTING SHAPES 00:05:00 Insert WordArt 00:15:00 ACTIVITY - INSERT WORDART 00:05:00 Edit Objects 00:30:00 ACTIVITY - EDITING OBJECTS 00:05:00 Format Objects 00:15:00 ACTIVITY - FORMATTING OBJECTS 00:05:00 Group Objects 00:15:00 ACTIVITY - GROUPING OBJECTS 00:05:00 Arrange Objects 00:15:00 ACTIVITY - ARRANGING OBJECTS 00:05:00 Animate Objects 00:15:00 ACTIVITY - ANIMATING OBJECTS 00:05:00 Create a Table 00:15:00 ACTIVITY - CREATING A TABLE 00:05:00 Format a Table 00:15:00 ACTIVITY - FORMATTING A TABLE 00:05:00 Insert a Table from Other Microsoft Office Applications 00:15:00 ACTIVITY - INSERTING A TABLE FROM MICROSOFT EXCEL 00:05:00 Create a Chart 00:15:00 ACTIVITY - CREATING A CHART 00:05:00 Format a Chart 00:15:00 ACTIVITY - FORMATTING A CHART 00:05:00 Manipulate a Chart 00:15:00 ACTIVITY - MANIPULATING A CHART 00:05:00 Insert a Chart from Microsoft Excel 00:15:00 ACTIVITY - INSERTING A CHART FROM MICROSOFT EXCEL 00:05:00 Review Your Presentation 00:30:00 ACTIVITY - REVIEWING YOUR PRESENTATION 00:05:00 Apply Transitions 00:15:00 ACTIVITY - APPLYING TRANSITIONS 00:05:00 Print Your Presentation 00:15:00 ACTIVITY - PRINTING YOUR PRESENTATION 00:05:00 Deliver Your Presentation 01:00:00 ACTIVITY - DELIVERING YOUR PRESENTATION 00:05:00 PowerPoint Intermediate Customize the User Interface 01:30:00 Set PowerPoint 2016 Options 00:45:00 Create and Manage Sections 01:00:00 Modify Slide Masters and Slide Layouts 01:15:00 Add Headers and Footers 00:30:00 Modify the Notes Master and the Handout Master 00:45:00 Create SmartArt 00:45:00 Modify SmartArt 01:00:00 Add Audio to a Presentation 00:45:00 Add Video to a Presentation 01:00:00 Customize Animations and Transitions 01:00:00 Add Comments to a Presentation 00:45:00 Store and Share Presentations on the Web 01:30:00 Annotate a Presentation 00:45:00 Set Up a Slide Show 00:45:00 Create a Custom Slide Show 00:30:00 Add Hyperlinks and Action Buttons 00:45:00 Record a Presentation 00:15:00 Secure a Presentation 01:30:00 Present a Slide Show Online 01:00:00 Create a Video or a CD 00:45:00 Certificate and Transcript Order Your Certificates and Transcripts 00:00:00

Description: This Microsoft Office 2013 PowerPoint Beginners - Complete Video Course covers the basic functions and features of PowerPoint 2013. This series begins with an introduction in developing a PowerPoint presentation. With this course you will learn about advanced text editing and how to utilize graphical elements, manipulate an existing PowerPoint presentation, create a new presentation based on a template, design a blank presentation selecting various slide layouts, print a presentation using special print options, modify a presentation using different outline views, edit and delete text in the title and bulleted placeholders, modify the presentation through choosing a color scheme and formatting the background, change all slides using the slide master, change alignment, header, footer and objects with the slides, work with drawing, sizing, moving and grouping objects, and much more. If you want to know more detail you have to be a part of this course. You will get all the basic knowledge from this course. Assessment: At the end of the course, you will be required to sit for an online MCQ test. Your test will be assessed automatically and immediately. You will instantly know whether you have been successful or not. Before sitting for your final exam you will have the opportunity to test your proficiency with a mock exam. Certification: After completing and passing the course successfully, you will be able to obtain an Accredited Certificate of Achievement. Certificates can be obtained either in hard copy at a cost of £39 or in PDF format at a cost of £24. Who is this Course for? Microsoft Office 2013 PowerPoint Beginners - Complete Video Course is certified by CPD Qualifications Standards and CiQ. This makes it perfect for anyone trying to learn potential professional skills. As there is no experience and qualification required for this course, it is available for all students from any academic background. Requirements Our Microsoft Office 2013 PowerPoint Beginners - Complete Video Course is fully compatible with any kind of device. Whether you are using Windows computer, Mac, smartphones or tablets, you will get the same experience while learning. Besides that, you will be able to access the course with any kind of internet connection from anywhere at any time without any kind of limitation. Career Path After completing this course you will be able to build up accurate knowledge and skills with proper confidence to enrich yourself and brighten up your career in the relevant job market. Getting Started with PowerPoint Navigate the PowerPoint Environment FREE 00:17:00 Create and Save a PowerPoint Presentation 00:09:00 Use Help 00:04:00 Developing a PowerPoint Presentation Select a Presentation Type 00:07:00 View and Navigate a Presentation 00:10:00 Edit Text 00:16:00 Building a Presentation 00:21:00 Performing Advanced Text Editing Format Characters 00:14:00 Format Paragraphs 00:19:00 Format Text Boxes 00:10:00 Adding Graphical Elements to Your Presentation Insert Clip Art and Images 00:09:00 Insert Shapes 00:11:00 Modifying Objects in Your Presentation Edit Objects 00:16:00 Format Objects 00:07:00 Group Objects 00:05:00 Arrange Objects 00:07:00 Animate Objects 00:06:00 Adding Tables to Your Presentation Create a Table 00:05:00 Format a Table 00:06:00 Insert a Table from Other Microsoft Office Applications 00:05:00 Adding Charts to Your Presentation Create a Chart 00:07:00 Format a Chart 00:09:00 Insert a Chart from Microsoft Excel 00:04:00 Preparing to Deliver Your Presentation Review Your Presentation 00:08:00 Applying Transitions 00:05:00 Print Your Presentation 00:05:00 Deliver Your Presentation 00:07:00 Mock Exam Mock Exam- Microsoft Office 2013 PowerPoint Beginners - Complete Video Course 00:20:00 Final Exam Final Exam- Microsoft Office 2013 PowerPoint Beginners - Complete Video Course 00:20:00 Certificate and Transcript Order Your Certificates and Transcripts 00:00:00
Description: Microsoft PowerPoint is considered as the most powerful presentation for presenting visual and graphical items. This program can help you to create handouts and even developing an animated presentation with audio. Through this course, you will know you will learn all the skills, knowledge, and information about the PowerPoint software that you can use for your work. You will learn all the available presentation tasks such as inserting slides from other presentation or even recording your show as videos. All of these tasks and features, whether it's for beginners, intermediate, or advanced level users, are beneficial for your career for any activity you could think of. Who is the course for? Professionals who want to learn about Microsoft PowerPoint 2010 functions and tools. People who have an interest in knowing all about Microsoft PowerPoint 2010 features. Entry Requirement: This course is available to all learners, of all academic backgrounds. Learners should be aged 16 or over to undertake the qualification. Good understanding of English language, numeracy and ICT are required to attend this course. Assessment: At the end of the course, you will be required to sit an online multiple-choice test. Your test will be assessed automatically and immediately so that you will instantly know whether you have been successful. Before sitting for your final exam, you will have the opportunity to test your proficiency with a mock exam. Certification: After you have successfully passed the test, you will be able to obtain an Accredited Certificate of Achievement. You can however also obtain a Course Completion Certificate following the course completion without sitting for the test. Certificates can be obtained either in hardcopy at the cost of £39 or in PDF format at the cost of £24. PDF certificate's turnaround time is 24 hours, and for the hardcopy certificate, it is 3-9 working days. Why choose us? Affordable, engaging & high-quality e-learning study materials; Tutorial videos/materials from the industry leading experts; Study in a user-friendly, advanced online learning platform; Efficient exam systems for the assessment and instant result; The UK & internationally recognised accredited qualification; Access to course content on mobile, tablet or desktop from anywhere anytime; The benefit of career advancement opportunities; 24/7 student support via email. Career Path: The Microsoft PowerPoint 2010 complete course would be beneficial for any professions or career from any industry you are in, such as: Administrative Assistant Administrator Manager Office Staff Personal Assistant Secretary. Microsoft PowerPoint 2010 for Beginners Module One - Getting Started 01:00:00 Module Two - Opening and Closing PowerPoint 00:30:00 Module Three - Working with Presentations 00:30:00 Module Four - Your First Presentation 01:00:00 Module Five - Working with Text 00:30:00 Module Six - Formatting Text 00:30:00 Module Seven - Formatting Paragraphs 01:00:00 Module Eight - Advanced Formatting Tasks 00:30:00 Module Nine - Customizing Slide Elements 01:00:00 Module Ten - Setting Up Your Slide Show 00:30:00 Module Eleven - Showtime 01:00:00 Module Twelve - Wrapping Up 01:00:00 Activities-Microsoft PowerPoint 2010 for Beginners 00:00:00 Microsoft PowerPoint 2010 Intermediate Level Module One - Getting Started 00:30:00 Module Two - Working with the PowerPoint Environment 01:00:00 Module Three - Working with Presentations 01:00:00 Module Four - Formatting Presentations 01:00:00 Module Five - Formatting Text Boxes 01:00:00 Module Six - Creating a Photo Album 01:00:00 Module Seven - Working with Graphical Elements 01:00:00 Module Eight - Working with Audio and Video Content 01:00:00 Module Nine - Working with Transitions and Animations 01:00:00 Module Ten - Collaborating on Presentations 01:00:00 Module Eleven - Delivering Presentations 01:00:00 Module Twelve - Wrapping Up 00:30:00 Activities-Microsoft PowerPoint 2010 Intermediate Level 00:00:00 Microsoft PowerPoint 2010 Advanced Level Module One - Getting Started 00:30:00 Module Two - Adding Pictures 01:00:00 Module Three - Working with Text Boxes 01:00:00 Module Four - Adding SmartArt 01:00:00 Module Five - Adding Tables 01:00:00 Module Six - Inserting Advanced Objects 01:00:00 Module Seven - Advanced Drawing Tasks 01:00:00 Module Eight - PowerPoint's Research Tools 01:00:00 Module Nine - Creating Notes and Handouts 01:00:00 Module Ten - Using Slide Masters 01:00:00 Module Eleven - Advanced Presentation Tasks 01:00:00 Module Twelve - Wrapping Up 00:30:00 Activities-Microsoft PowerPoint 2010 Advanced Level 00:00:00 Mock Exam Mock Exam- Microsoft PowerPoint 2010 Complete Course- Beginners, Intermediate, Advanced 00:30:00 Final Exam Final Exam- Microsoft PowerPoint 2010 Complete Course- Beginners, Intermediate, Advanced 00:30:00 Certificate and Transcript Order Your Certificates and Transcripts 00:00:00

Description: Learn how to be compelling and proficient in your regular work, with an intensive comprehension of how the Microsoft power point can support you regardless of the level of expertise you are at. We have a Microsoft course for you! Microsoft PowerPoint Basic is followed by this Microsoft PowerPoint Intermediate Course. This Microsoft PowerPoint Intermediate course is intended to take your computer skills from basics to all the way to next level, one step at a time, so enrol now. In this course you will learn the necessary skills, knowledge and information of Microsoft PowerPoint. Who is this course for? Professionals who use PowerPoint on a daily basis to build content heavy, professional presentations on pitching business. This course would be ideal for individuals who wish to develop their skills of using Microsoft PowerPoint application. Entry Requirement: This course is available to all learners, of all academic backgrounds. Learners should be aged 16 or over to undertake the qualification. Good understanding of English language, numeracy and ICT are required to attend this course. Assessment: At the end of the course, you will be required to sit an online multiple-choice test. Your test will be assessed automatically and immediately so that you will instantly know whether you have been successful. Before sitting for your final exam you will have the opportunity to test your proficiency with a mock exam. Certification: After you have successfully passed the test, you will be able to obtain an Accredited Certificate of Achievement. You can however also obtain a Course Completion Certificate following the course completion without sitting for the test. Certificates can be obtained either in hardcopy at a cost of £39 or in PDF format at a cost of £24. PDF certificate's turnaround time is 24 hours and for the hardcopy certificate, it is 3-9 working days. Why choose us? Affordable, engaging & high-quality e-learning study materials; Tutorial videos/materials from the industry leading experts; Study in a user-friendly, advanced online learning platform; Efficient exam systems for the assessment and instant result; The UK & internationally recognised accredited qualification; Access to course content on mobile, tablet or desktop from anywhere anytime; The benefit of career advancement opportunities; 24/7 student support via email. Career Path: The Microsoft PowerPoint Intermediate Level will be very beneficial and helpful, especially to the following professionals: Admin Assistant PA Secretary Administrator Office Manager. Microsoft PowerPoint Intermediate Level Module One - Getting Started 00:30:00 Module Two - Working with the PowerPoint Environment 01:00:00 Module Three - Working with Sections and Presentation Organization 01:00:00 Module Four - Formatting Presentations 01:00:00 Module Five - Formatting Shapes and Text Boxes 01:00:00 Module Six - Creating a Photo Album 01:00:00 Module Seven - Working with Graphical Elements 01:00:00 Module Eight - Working with Audio and Video Content 01:00:00 Module Nine - Working with Transitions and Animations 01:00:00 Module Ten - Collaborating on Presentations 01:00:00 Module Eleven - Working with Presentation Info and Other Formats 01:00:00 Module Twelve - Wrapping Up 00:30:00 Activities Activities-Microsoft PowerPoint Intermediate Level 00:00:00 Mock Exam Mock Exam- Microsoft PowerPoint Intermediate Level 00:20:00 Final Exam Final Exam- Microsoft PowerPoint Intermediate Level 00:20:00 Order Your Certificate and Transcript Order Your Certificates and Transcripts 00:00:00
Description: Microsoft PowerPoint is a program that helps you create, edit and show presentations. These presentations could be for work, school or any occasions. This Microsoft Office 2007 PowerPoint Advanced - Complete Video Course will expand your basic knowledge of Microsoft PowerPoint 2007 and learn more advanced concepts such as customization and SmartArt Tools. This advanced level will help you make presentations creatively. You will learn how to use the Pictures, Textbox, Table, and Drawing Tools tab and know how to do advanced drawing tasks. Know how to use the Research Task Pane and notes to slides. All of these advanced skills in PowerPoint will help you maximize the potentials of the program. In this course you will learn the necessary skills, knowledge and information of Microsoft PowerPoint. Before joining this course you should keep the basic knowledge of Microsoft PowerPoint. Assessment: At the end of the course, you will be required to sit for an online MCQ test. Your test will be assessed automatically and immediately. You will instantly know whether you have been successful or not. Before sitting for your final exam you will have the opportunity to test your proficiency with a mock exam. Certification: After completing and passing the course successfully, you will be able to obtain an Accredited Certificate of Achievement. Certificates can be obtained either in hard copy at a cost of £39 or in PDF format at a cost of £24. Who is this Course for? Microsoft Office 2007 PowerPoint Advanced - Complete Video Course is certified by CPD Qualifications Standards and CiQ. This makes it perfect for anyone trying to learn potential professional skills. As there is no experience and qualification required for this course, it is available for all students from any academic background. Requirements Our Microsoft Office 2007 PowerPoint Advanced - Complete Video Course is fully compatible with any kind of device. Whether you are using Windows computer, Mac, smartphones or tablets, you will get the same experience while learning. Besides that, you will be able to access the course with any kind of internet connection from anywhere at any time without any kind of limitation. Career Path After completing this course you will be able to build up accurate knowledge and skills with proper confidence to enrich yourself and brighten up your career in the relevant job market. Custom Presentation Options Application Settings FREE 00:11:00 Custom Themes 00:03:00 Custom Templates 00:08:00 Advanced Slide Master Techniques 00:08:00 Graphic and Multimedia Content Modifying Clip Art 00:07:00 Media Clips 00:05:00 Animations 00:10:00 Photo Albums 00:07:00 Customizing SmartArt Graphics and Tables SmartArt Graphics 00:11:00 Customizing Tables 00:13:00 Action Buttons and Custom Slide Shows Interactive Elements 00:07:00 Custom Slide Shows 00:04:00 Distributing a Presentation Comments 00:08:00 Finishing a Presentation 00:08:00 Distributing a Presentation 00:08:00 Publish as a Web Page 00:04:00 Integrating Microsoft Office Files Build Slides from a Word Outline 00:04:00 Embed and Link Content 00:11:00 Documents Linked with Hyperlinks 00:04:00 Mock Exam Mock Exam- Microsoft Office 2007 PowerPoint Advanced - Complete Video Course 00:20:00 Final Exam Final Exam- Microsoft Office 2007 PowerPoint Advanced - Complete Video Course 00:20:00 Order Your Certificate and Transcript Order Your Certificates and Transcripts 00:00:00
Description: Microsoft PowerPoint is a program that helps you create, edit and show presentations. These presentations could be for work, school or any occasions. This advanced course will help you make presentations creatively. You will learn how to use the Pictures, TextBox, Table, and Drawing Tools tab and know how to do advanced drawing tasks. Know how to use the Research Task Pane and notes to slides. All of these advanced skills in PowerPoint will help you maximise the potentials of the program. In this course you will learn the necessary skills, knowledge and information of Microsoft PowerPoint. Who is the course for? Professionals who want to learn about Microsoft PowerPoint 2007 functions and features. People who have an interest in knowing advanced Microsoft PowerPoint 2007 aspects. Entry Requirement: This course is available to all learners, of all academic backgrounds. Learners should be aged 16 or over to undertake the qualification. Good understanding of English language, numeracy and ICT are required to attend this course. Assessment: At the end of the course, you will be required to sit an online multiple-choice test. Your test will be assessed automatically and immediately so that you will instantly know whether you have been successful. Before sitting for your final exam, you will have the opportunity to test your proficiency with a mock exam. Certification: After you have successfully passed the test, you will be able to obtain an Accredited Certificate of Achievement. You can however also obtain a Course Completion Certificate following the course completion without sitting for the test. Certificates can be obtained either in hard copy at the cost of £39 or in PDF format at the cost of £24. PDF certificate's turnaround time is 24 hours, and for the hardcopy certificate, it is 3-9 working days. Why choose us? Affordable, engaging & high-quality e-learning study materials; Tutorial videos/materials from the industry leading experts; Study in a user-friendly, advanced online learning platform; Efficient exam systems for the assessment and instant result; The UK & internationally recognized accredited qualification; Access to course content on mobile, tablet or desktop from anywhere anytime; The benefit of career advancement opportunities; 24/7 student support via email. Career Path: The Microsoft PowerPoint 2007 Advanced Level course is a useful qualification to possess and would be beneficial for these professions or career which are: Admin Assistant PA Secretary Administrator Office Manager. Microsoft PowerPoint 2007 Advanced Level Module One - Getting Started 00:30:00 Module Two - Adding Pictures 01:00:00 Module Three - Working with Text Boxes 01:00:00 Module Four - Adding SmartArt 01:00:00 Module Five - Adding Tables 01:00:00 Module Six - Inserting Advanced Objects 01:00:00 Module Seven - Advanced Drawing Tasks 01:00:00 Module Eight - PowerPoint's Research Tools 01:00:00 Module Nine - Creating Notes and Handouts 01:00:00 Module Ten - Using Slide Masters 01:00:00 Module Eleven - Advanced Presentation Tasks 01:00:00 Module Twelve - Wrapping Up 00:30:00 Activities Activities-Microsoft PowerPoint 2007 Advanced Level 00:00:00 Mock Exam Mock Exam- Microsoft PowerPoint 2007 Advanced Level 00:20:00 Final Exam Final Exam- Microsoft PowerPoint 2007 Advanced Level 00:20:00 Certificate and Transcript Order Your Certificates and Transcripts 00:00:00
Advanced Diploma in Microsoft Excel
By SkillWise
Uplift Your Career & Skill Up to Your Dream Job - Learning Simplified From Home! Kickstart your career & boost your employability by helping you discover your skills, talents, and interests with our special Advanced Diploma in Microsoft Excel Course. You'll create a pathway to your ideal job as this course is designed to uplift your career in the relevant industry. It provides the professional training that employers are looking for in today's workplaces. The Advanced Diploma in Microsoft Excel Course is one of the most prestigious training offered at Skillwise and is highly valued by employers for good reason. This Advanced Diploma in Microsoft Excel Course has been designed by industry experts to provide our learners with the best learning experience possible to increase their understanding of their chosen field. This Advanced Diploma in Microsoft Excel Course, like every one of Study Hub's courses, is meticulously developed and well-researched. Every one of the topics is divided into elementary modules, allowing our students to grasp each lesson quickly. At Skillwise, we don't just offer courses; we also provide a valuable teaching process. When you buy a course from Skillwise, you get unlimited Lifetime access with 24/7 dedicated tutor support. Why buy this Advanced Diploma in Microsoft Excel? Unlimited access to the course forever Digital Certificate, Transcript, and student ID are all included in the price Absolutely no hidden fees Directly receive CPD QS-accredited qualifications after course completion Receive one-to-one assistance every weekday from professionals Immediately receive the PDF certificate after passing Receive the original copies of your certificate and transcript on the next working day Easily learn the skills and knowledge from the comfort of your home Certification After studying the course materials of the Advanced Diploma in Microsoft Excel there will be a written assignment test which you can take either during or at the end of the course. After successfully passing the test you will be able to claim the pdf certificate for free. Original Hard Copy certificates need to be ordered at an additional cost of £8. Who is this course for? This Advanced Diploma in Microsoft Excel course is ideal for Students Recent graduates Job Seekers Anyone interested in this topic People already working in the relevant fields and want to polish their knowledge and skills. Prerequisites This Advanced Diploma in Microsoft Excel does not require you to have any prior qualifications or experience. You can just enroll and start learning. This Advanced Diploma in Microsoft Excel was made by professionals and it is compatible with all PCs, Macs, tablets, and smartphones. You will be able to access the course from anywhere at any time as long as you have a good enough internet connection. Career path As this course comes with multiple courses included as a bonus, you will be able to pursue multiple occupations. This Advanced Diploma in Microsoft Excel is a great way for you to gain multiple skills from the comfort of your home.

**Trust The 35000+ Students Who Are Learning with Us & Kick Starting Their Career!** Deal Price is Active; Save Now- £405! Offer Ends Soon; Hurry Up!! Are you looking to improve your current abilities or make a career move? Our unique Basic Microsoft SQL Server Course might help you get there! Expand your expertise with high-quality training - study the Basic Microsoft SQL Server and get an expertly designed, great value training experience. Learn from industry professionals and quickly equip yourself with the specific knowledge and skills you need to excel in your chosen career through the online training course. This Basic Microsoft SQL Server online training course is accredited by CPD with 10 CPD points for professional development. Students can expect to complete this training course in around 4 hours. You'll also get dedicated expert assistance from us to answer any queries you may have while studying our course. The Basic Microsoft SQL Server course is broken down into several in-depth modules to provide you with the most convenient and rich learning experience possible. Upon successful completion of the course, you will receive an instant e-certificate as proof of the comprehensive skill development and competency. Add these amazing new skills to your resume and boost your employability by simply enroling on this Basic Microsoft SQL Server course. With this comprehensive Basic Microsoft SQL Server course, you can achieve your dreams and train for your ideal career. The course provides students with an in-depth learning experience that they can work through at their own pace to enhance their professional development. You'll get a Free Student ID card by enroling in this course. This ID card entitles you to discounts on bus tickets, movie tickets, and library cards. Enroling on the course will ensure that you land your dream career faster than you thought possible. Stand out from the crowd and train for the job you want with this program. Learning Outcomes of Basic Microsoft SQL Server: Instant access to verified and reliable information Participation in inventive and interactive training exercises Quick assessment and guidance for all subjects CPD accreditation for proof of acquired skills and knowledge Freedom to study in any location and at a pace that suits you Expert support from dedicated tutors committed to online learning Why Prefer thisBasic Microsoft SQL Server Course? Opportunity to earn a certificate accredited by CPD after completing this course Student ID card with amazing discounts - completely for FREE! (£10 postal charges will be applicable for international delivery) Standards-aligned lesson planning Innovative and engaging content and activities Assessments that measure higher-level thinking and skills Complete the program in your own time, at your own pace Each of our students gets full 24/7 tutor support Experts created the Basic Microsoft SQL Server course to provide a rich and in-depth training experience for all students who enrol in it. Enrol in the course right now and you'll have immediate access to all of the course materials. Then, from any internet-enabled device, access the course materials and learn when it's convenient for you. Start your learning journey straight away with this Basic Microsoft SQL Server course and take a step toward a brighter future! ****Course Curriculum**** ***Basic Microsoft SQL Server*** Introduction Introduction Setup SQL server setup SQL server management studio setup Databases and tables Basic queries INSERT SELECT UPDATE DELETE Filter and sort Variables Logic Security Authentication Connection strings Vulnerability assessment MSSQL an different drivers Stored procedure Example: attendee registry c# Python Files File table Stored procedures General Functions Import data Export data Jobs Backup Database email Job notifications Assessment Process Once you have completed all the modules in the Basic Microsoft SQL Server course, you can assess your skills and knowledge with an optional assignment. Our expert trainers will assess your assignment and give you feedback afterwards. Show off Your New Skills with a Certification of Completion The learners have to complete the assessment of this Basic Microsoft SQL Server course to achieve the CPD accredited certificate. Digital certificates can be ordered for only £10. The learner can purchase printed hard copies inside the UK for £29, and international students can purchase printed hard copies for £39. CPD 10 CPD hours / points Accredited by CPD Quality Standards Who is this course for? Anyone interested in learning more about the topic is advised to take this course. This course is open to everybody. Requirements You will not need any prior background or expertise to enrol in this course. Career path After completing this course, you are to start your career or begin the next phase of your career.