- Professional Development
- Medicine & Nursing
- Arts & Crafts
- Health & Wellbeing
- Personal Development
683 Video courses in Cardiff delivered Live Online
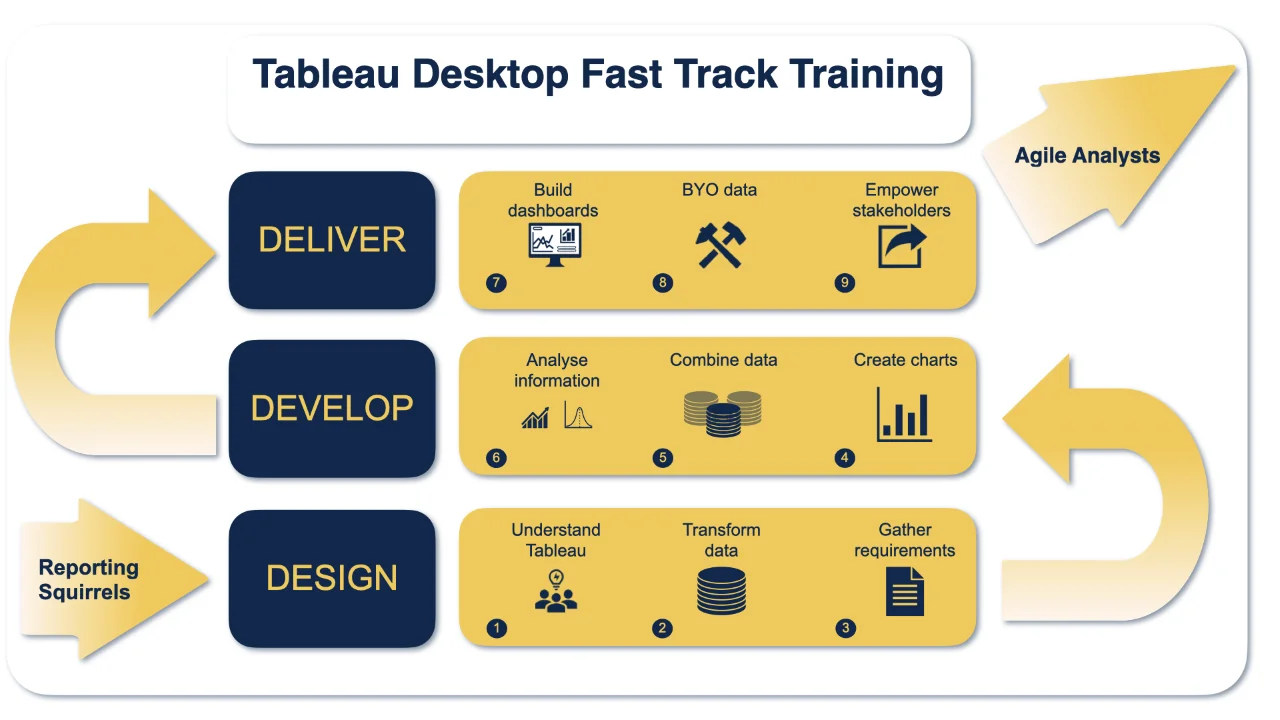
Tableau Training On Tap - Fast Track
By Tableau Training Uk
Tableau is an intuitive and simple tool to learn. This Tableau training course is a jumpstart to getting report writers and analysts who are self-taught or have no previous knowledge to being productive. It covers everything from connecting to data, through to creating interactive dashboards with a range of visualisations in three days. Having a quick turnaround from starting to use Tableau, to getting real, actionable insights means that you get a swift return on your investment. At the end of this course, you will be able to communicate insights more effectively, enabling your organisation to make better decisions, quickly. This accelerated approach is key to getting engagement from within your organisation so everyone can immediately see and feel the impact of the data and insights you create. Our Tableau Desktop Fast Track course combines all of our Foundation (Fundamentals) and Analyst (Intermediate) content into a 3 day live online course with added access to online bonus content of 3 additional modules. Gathering Requirements, Bring Your Own Data and Engaging Users. What do you get? This course is delivered live virtually and has all material provided through our online portal, together with email support and live coaching sessions. The full program includes all of the following elements: 3 days of live and interactive instructor-led sessions delivered by an expert Tableau Trainer 6 weeks access to our live coaching program delivered by expert Tableau coaches 50+ practical exercises to practice what you learn 12 months access to video’s that walk you through the theory and exercise solutions Practical advice, tools and resources for using Tableau in the real world The three additional online modules provide:Clarity on the approach to gathering dashboard requirements in a way that can be translated into dashboard designs.An agile and iterative development process that delivers products that meet user needs more quickly and effectively.An understanding of how end users will interact with dashboards to ensure that designers deliver actionable results. THE SYLLABUS PHASE 1: DESIGN MODULE 1: UNDERSTAND TABLEAU What is possible How does Tableau deal with data Know your way around Review of Type Conversions How do we format charts Dashboard basics – My first Dashboard MODULE 2: TRANSFORM DATA Connecting to and setting up data in Tableau Modifying data attributes How Do I Structure my Data – Groups & Hierarchies, Visual Groups How Tableau Deals with Dates – Using Discrete and Continuous Dates, Custom Dates How do I create calculated fields and why? – Creating Calculated Fields, Types of calculated fields, Row Level v Aggregations, Aggregating dimensions in calculations, Changing the Level of Detail (LOD) of calculations – What, Why, How MODULE 3: GATHER REQUIREMENTS(ONLINE CONTENT ONLY) Brainstorm and assess possible priorities Pitfalls to avoid Gather requirements PHASE 2: DEVELOP MODULE 4: CREATE CHARTS Charts that Compare Multiple Measures – Measure Names and Measure Values, Shared Axis Charts, Dual Axis Charts, Scatter Plots Showing progress over time Creating Tables – Creating Tables, Highlight Tables, Heat Maps Showing Relational & Proportional Data – Pie Charts, Donut Charts, Tree Maps Making things dynamic with parameters MODULE 5: COMBINE DATA Relationships Joining Tables – Join Types, Joining tables within the same database, cross database joins, join calculations Blending – How to create a blend with common fields, Custom defined Field relationships and mismatched element names, Calculated fields in blended data sources Unions – Manual Unions and mismatched columns, Wildcard unions Data Extracts – Creating & Editing Data extracts MODULE 6: ANALYSE INFORMATION Table Calculations Sets, Reference Lines, Trends and Forecasting Answering spatial questions – Mapping, Creating a choropleth (filled) map, Using your own images for spatial analysis, Mapping with spatial files Advanced charts Bar in Bar charts Bullet graphs Creating Bins and Histograms Creating a Box & Whisker plot Viz in Tooltips PHASE 3: DESIGN MODULE 7: BUILD DASHBOARDS Using the Dashboard Interface Device layouts Dashboard Actions – Set actions, Parameter actions Viz in Tooltips for Dashboards Dashboard containers – Horizontal & Vertical containers, Hidden containers Navigate between dashboards Telling data driven stories MODULE 8: BRING YOUR OWN DATA Design Best Practices & Resources Wireframe templates Questions Process Start building and testing MODULE 9: EMPOWER STAKEHOLDERS What is Tableau Server Publishing & permissions How can your users engage with content The Tableau ecosystem Review your progress Your next steps HOW MUCH OF YOUR TIME WILL THIS TAKE? Delegates are also provided 6 weeks access to our Tableau Coaching. We run Live Q&A sessions from 4pm-5pm on a Monday (Connecting to Data and Calculated Fields), 2pm-3pm Friday (Creating Charts) & 4pm-5pm Friday (Dashboard Design). The coaching helps delegates to transition from the theory of using Tableau to its practical use. We’d be expecting them to apply the exercises you’ll be doing during the course, onto your own data after the course. In our experience, this is the best way to increase both understanding and long term memory retention. The live coaching also acts as a troubleshooting platform for any practical issues that delegates need to overcome in the real world. Delegates also have 12 months access to all of the training material covered in the course in the form of an online portal (this includes theory videos, exercise solution videos, exercise materials and even quizzes). We have a growing LinkedIn community that delegates are encouraged to join and participate in. We regularly post useful blog posts and additional training that will enhance the Tableau journey and understanding. We help teams using Tableau to transform in the following ways : From a disjointed understanding of Tableau – To being familiar with Tableau terminology and capability From ad-hoc data uploads and error prone calculations – To reusable data connections and robust metrics From disjointed stakeholder questions – To clear and concise requirements that lead to decision making From being unsure how difficult Tableau will be to learn – To being able to develop standard charts and tables in Tableau with dynamic reporting capabilities From manually combining data for each analytical task – To dynamically combining data from multiple tables for analysis From being unsure how to answer analytical questions and what options there are – To being equipped with multiple actionable, dynamic, analytical use cases From not knowing Why, When and How to create Dashboards or Story’s – To being able to combine analysis to answer complex questions and tell data driven stories From using demo data theory – To Delivering value [Answering questions] on their own data From spending lots of time answering colleagues ad-hoc (data) questions – To empowering stakeholders in answering ad-hoc queries and reducing the time to analyse and steer the business
Patchwork and Quilting for Beginners Online Class with Live Q&A Sessions
By Loopy's Place
Learn to quilt from the comfort of your own home! Our online Patchwork for Beginners class provides comprehensive video tutorials and live Q&A sessions to guide you through the basics of patchwork. Master essential techniques, from fabric selection to creating stunning blocks. Start your quilting journey today!

Articulate Storyline 360
By Nexus Human
Duration 2 Days 12 CPD hours Whether you are already an instructional designer or just looking to get into the world of developing eLearning courses, this two-day course covers the full feature set of Articulate Storyline 360 and uses real world exercises to create projects from scratch. The course will include how to add interactivity to your slides via buttons, triggers, text entry areas, and hotspots. You'll also learn how to create quizzes, and how to publish your eLearning projects for the widest possible audience. The class will also explore Articulate Storyline's advance techniques and methods on Themes & Templates, Custom Navigation, Gamification, Advanced Quizzing, Accessibility and Reporting, and more. Exploring Articulate Storyline Explore a Finished Storyline Project Explore Slides and Panels Zoom and Magnify Explore Panels Preview the Entire Project Creating Projects Create a New Project Apply a Theme Apply a Content Master Slide Insert New Slides Create a New Content Master Slide Apply a Different Master Slide Layout to a Slide Import Content From PowerPoint Adding Content Create and Format a Text Box Work with a List Add an Image to a Slide Add a Shape to a Slide Customize a Shape Insert a Character Insert a Caption Interactivity Add Buttons to Slides Change Button States Create Layers Insert a Text Entry Field Triggers and Hotspots Delete Default Triggers Add a Trigger to a Button Hide Player Buttons Add Triggers to Layers Add a Hide Layer Trigger Add a Slide Trigger Add a Conditional Trigger Edit a Trigger Add a Hotspot and Lightbox Trigger Variables Manage a Variable Reference a Variable Create a Variable Manipulate a Variable with a Trigger Create a True/False Variable Create a Trigger to Change a True/False Variable Add a Condition to an Existing Trigger Play Audio with a Conditional Trigger Add a Condition to a Button Audio, Animation and Video Add Voiceover Audio to a Slide Change Slide Audio Edit Slide Audio Add Silence Record Voiceover Audio Control Object Timing Animate an Object Control Animation Options Insert Video Delay Object Start Times Trim Video Animate a Video Add a Slide Transition Quizzes Insert a Multiple Choice Slide Insert a Matching Drag-and-Drop Slide Insert a Freeform Drag and Drop Quiz Slide Insert a Quiz Result Slide

Certified Professional for Usability and User Experience – Usability Testing and Evaluation (CPUX-UT)
By Bunnyfoot
This one-day course introduces the field of user experience and provides an excellent entry point to our other specialised training courses. UX processes and practices have become a central component of product design, service design and web design.
PowerPoint - intermediate (In-House)
By The In House Training Company
This one-day workshop is designed to enhance your PowerPoint skills to achieve dynamic presentations that work with you, making it easier to deliver a polished, professional presentation. You will learn advanced PowerPoint skills that will save you time and elevate your presentations. This course will help participants: Create custom shows to personalise presentations for individual clients Make the Slide Master work collectively with slide layouts and themes Seamlessly interact with external content using links Work with advanced animations and transitions, and video/audio tools 1 Themes and Masters Add a Design theme to a presentation Make changes to the Slide Master Delete layouts from the slide master Saving a slide master with themes as a template 2 Advanced graphics and diagrams Drawing, duplicating and resizing shapes Grouping, aligning and stacking shapes and graphics Using SmartArt for diagrams and organisation charts 3 Graphs and charts Inserting and formatting a chart Linking an Excel chart to a slide Linking Excel tables to a slide Animating charts 4 Video, Custom animation and Hyperlinks Adding and editing video Animating pictures and drawings Hyperlink to another Slide or Website Compressing and optimising media 5 Presenting Reuse slides Hide slides Rehearsing timings Enabling a presentation to run continuously

Data Analysis and Visualization with Microsoft Excel
By Mpi Learning - Professional Learning And Development Provider
This course is designed for students who already have foundational knowledge and skills in Excel and who wish to perform robust and advanced data and statistical analysis with Microsoft Excel using PivotTables, use tools such as Power Pivot and the Data Analysis ToolPak to analyze data and visualize data and insights using advanced visualizations in charts and dashboards in Excel.

Quickstart Adobe Express Training
By Greta Powell Training
This is a quickstart Adobe Express Training course held online in Janury 2025. Ideal for business owners or freelancers looking to get to grips with social media design and designing for social media marketing.

AI Frontiers 2025: THE FUTURE IS NOW!
By IIL Europe Ltd
Join us online on May 15, 2025 when IIL brings together experts from Google, IBM, Microsoft, BAE Systems, and many more to break down the future. Discussions, debates and presentations will cover making AI trustworthy, its many uses, what “AI Agents” are all about, and the exciting things to come! No matter where you stand with AI – just beginning, a true believer, a critical thinker, a forward-looking innovator, or a practical user – AI Frontiers 2025 guarantees valuable takeaways for you.

iPad For Business
By Nexus Human
Duration 1 Days 6 CPD hours This day-long workshop gives participants a thorough understanding of the iPad iOS operating system. This course is designed for both those who want to learn more about their iPads, those who work in business environments and who want to integrate the iPad into their existing company?s infrastructure, as well as personnel who are responsible for supporting other iPad users. Setting Up The iPad iPad Essentials The Home Screen Launching and Running Apps Changing Screen Orientation Locking the Rotation The Control Center Creating Folders Accessibility and Voice Over Settings General Settings Parameters Passcode Setting Up Notifications Location Services iCloud and Synching your iPad Other Application Settings Multi-Touch Gestures Tap, Touch and Hold Drag, Flick and Swipe Pinch, Rotate and Shake Switching Between Applications Using the Apple Applications Showing and Hiding Applications Closing Documents vs. Quitting Applications Working With Documents Type, Select, Cut, Copy, Paste and Replace Understanding the iPad Keyboard Opening Pages, Numbers and Keynote Accessing Files and Documents Copying files between the iPad and Computer Working with Microsoft Office Connecting To The Internet WI-FI and Bluetooth Devices Through Servers Browsing and Searching The Web Enterprise Network The iPad In Business iOS Security Deployment Seamless Integration Mobile Device Management Printing with AirPrint Creating Passcodes Working with Photos and Camera Photos and Video Recording Video Integrating Photos or Video Into Documents or Presentations Mirroring Video Finding and Installing Apps The App Store Apps for Enterprise Installing and Deleting Apps Resetting the iPad Connecting and Mirroring with the iPhone Battery Issues Tips for Improving Battery Use Rebooting the iPad Hidden Keystrokes Troubleshooting Connectivity Issues ReInstalling Apps Preserving Batter Power Accessibility Functions Additional course details: Nexus Humans iPad For Business training program is a workshop that presents an invigorating mix of sessions, lessons, and masterclasses meticulously crafted to propel your learning expedition forward. This immersive bootcamp-style experience boasts interactive lectures, hands-on labs, and collaborative hackathons, all strategically designed to fortify fundamental concepts. Guided by seasoned coaches, each session offers priceless insights and practical skills crucial for honing your expertise. Whether you're stepping into the realm of professional skills or a seasoned professional, this comprehensive course ensures you're equipped with the knowledge and prowess necessary for success. While we feel this is the best course for the iPad For Business course and one of our Top 10 we encourage you to read the course outline to make sure it is the right content for you. Additionally, private sessions, closed classes or dedicated events are available both live online and at our training centres in Dublin and London, as well as at your offices anywhere in the UK, Ireland or across EMEA.
Live online took hold in 2020 and is a highly interactive, engaging and effective training medium, if it’s done right. Let us give your staff the key skills they need to make their virtual training learner-centred, by building a psychologically safe environment plus using online training tools such as break-out rooms, slides, video and whiteboards. Courses include: Key elements of a successful live online training session Knowing your audience Technology vs technique Blended/flipped/hybrid learning Making your activities and materials online-friendly Effective planning for live online sessions Timing live online training sessions