- Professional Development
- Medicine & Nursing
- Arts & Crafts
- Health & Wellbeing
- Personal Development
24 Tableau courses in Waltham Abbey delivered Live Online
Tableau Desktop Training - Foundation
By Tableau Training Uk
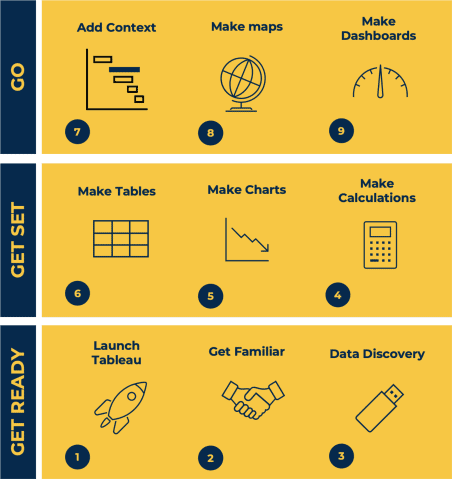
This Tableau Desktop Training course is a jumpstart to getting report writers and analysts with little or no previous knowledge to being productive. It covers everything from connecting to data, through to creating interactive dashboards with a range of visualisations in two days of your time. For Private options, online or in-person, please send us details of your requirements: This Tableau Desktop Training course is a jumpstart to getting report writers and analysts with little or no previous knowledge to being productive. It covers everything from connecting to data, through to creating interactive dashboards with a range of visualisations in two days of your time. Having a quick turnaround from starting to use Tableau, to getting real, actionable insights means that you get a swift return on your investment of time and money. This accelerated approach is key to getting engagement from within your organisation so everyone can immediately see and feel the impact of the data and insights you create. This course is aimed at someone who has not used Tableau in earnest and may be in a functional role, eg. in sales, marketing, finance, operations, business intelligence etc. The course is split into 3 phases and 9 modules: PHASE 1: GET READY MODULE 1: LAUNCH TABLEAU Check Install & Setup Why is Visual Analytics Important MODULE 2: GET FAMILIAR What is possible How does Tableau deal with data Know your way around How do we format charts Dashboard Basics – My First Dashboard MODULE 3: DATA DISCOVERY Connecting to and setting up data in Tableau How Do I Explore my Data – Filters & Sorting How Do I Structure my Data – Groups & Hierarchies, Visual Groups How Tableau Deals with Dates – Using Discrete and Continuous Dates, Custom Dates Phase 2: GET SET MODULE 4: MAKE CALCULATIONS How Do I Create Calculated Fields & Why MODULE 5: MAKE CHARTS Charts that Compare Multiple Measures – Measure Names and Measure Values, Shared Axis Charts, Dual Axis Charts, Scatter Plots Showing Relational & Proportional Data – Pie Charts, Donut Charts, Tree Maps MODULE 6: MAKE TABLES Creating Tables – Creating Tables, Highlight Tables, Heat Maps Phase 3: GO MODULE 7: ADD CONTEXT Reference Lines and Bands MODULE 8: MAKE MAPS Answering Spatial Questions – Mapping, Creating a Choropleth (Filled) Map MODULE 9: MAKE DASHBOARDS Using the Dashboard Interface Dashboard Actions This training course includes over 25 hands-on exercises and quizzes to help participants “learn by doing” and to assist group discussions around real-life use cases. Each attendee receives a login to our extensive training portal which covers the theory, practical applications and use cases, exercises, solutions and quizzes in both written and video format. Students must use their own laptop with an active version of Tableau Desktop 2018.2 (or later) pre-installed. What People Are Saying About This Course “Excellent Trainer – knows his stuff, has done it all in the real world, not just the class room.”Richard L., Intelliflo “Tableau is a complicated and powerful tool. After taking this course, I am confident in what I can do, and how it can help improve my work.”Trevor B., Morrison Utility Services “I would highly recommend this course for Tableau beginners, really easy to follow and keep up with as you are hands on during the course. Trainer really helpful too.”Chelsey H., QVC “He is a natural trainer, patient and very good at explaining in simple terms. He has an excellent knowledge base of the system and an obvious enthusiasm for Tableau, data analysis and the best way to convey results. We had been having difficulties in the business in building financial reports from a data cube and he had solutions for these which have proved to be very useful.”Matthew H., ISS Group
Salesforce Building Lenses, Dashboards, and Apps in Tableau CRM (ANC201)
By Nexus Human
Duration 1 Days 6 CPD hours This course is intended for This course is aimed at users with the Tableau CRM license who need to build effective lenses and dashboards for their business users to explore their data. It may also be of interest to users who are connecting and integrating this data, to understand how it is used in the lens and dashboard building process. Overview Build and manage apps in Tableau CRM Design a dashboard based on requirements, and create a dashboard template Create and add lenses to build a dashboard Optimize a dashboard for mobile use Ready to start building in Tableau CRM? In this course, you?ll find out how to design and create an effective dashboard layout to help viewers quickly find their way around. You?ll learn how to build lenses and add them into your dashboards using the Tableau CRM Dashboard Designer. Once you?ve created a dashboard, you?ll also learn how to optimize the dashboard for mobile. Finally you?ll also learn how to organize your lenses and dashboards using apps and ensure that only the right users have access to them.Looking for Tableau classes? Check out the Tableau catalog here. Managing Apps, Lenses, Dashboards, and Datasets Overview of building and managing apps Building an app Manage apps, lenses, dashboards, and datasets Designing a Dashboard and Creating a Template Dashboard Building Overview Designing a Dashboard Create a dashboard template Building a Dashboard Building a Dashboard Adding Charts, Tables, and KPIs to a Dashboard Adding Filters to a Dashboard Modify a Dashboard for Mobile Translating Desktop Dashboards to a Mobile Device Creating/Updating Mobile Dashboard Layouts

TTOT Level Up
By Tableau Training Uk
The Tableau Training on Tap (TToT™️) Level Up course takes intermediate Tableau users to being advanced users through lessons, tips and tricks and hands on exercises.

Salesforce Implement and Manage Tableau CRM (ANC301)
By Nexus Human
Duration 3 Days 18 CPD hours This course is intended for This class is ideal for integration specialists or Salesforce Administrators who want to learn more about connecting and securing data in Tableau CRM. This course is also great for business analysts or developers interested in creating advanced dashboards. Overview When you complete this course, you will be able to: Determine your user, data, and security requirements, and establish a development process. Set up apps and control what users can do in Tableau CRM by assigning them licenses, permission sets, and app permissions. Load external data to Tableau CRM. Create and run dataflows to load Salesforce data, and join it with data from other datasets. Understand and use Data Sync effectively. Understand Recipes and Data Prep. Understand and implement data security in Tableau CRM, and override security for implementation and testing. Understand how filters on dashboards function and be able to use interactions when necessary. Understand a dashboard's JSON file. Explain the process of dashboard queries and modify a query to meet specific analytic requirements. Modify dataset metadata. Take your Tableau CRM skills to the next level. In this 3-day, expert-led class, you?ll learn how to develop and implement a Tableau CRM environment that contains both Salesforce and non-Salesforce data. Our team of experts will walk you through Tableau CRM features and settings, user setup, how to load and transform data, data security, and how to modify queries to customize dashboards so you can work more efficiently, spot trends, and predict outcomes faster. Discovery and Planning Discovery Meeting Establishing Your Users and Development Process Set Up Users and Apps Overview of User Access on the Tableau CRM Platform Creating Tableau CRM Permission Sets Assigning Licenses and Permission Sets to Users Creating and Sharing Tableau CRM Apps Connect Data Overview of Connecting Data Data Mapping Overview of the Dataflow Process Designing a Dataflow Loading External CSV Data Creating Dataflows Optimizing Dataflows Running, Monitoring, and Scheduling a Dataflow Preparing Datasets with Recipes with Data Prep Data Connectors Additional Transformations Data Security Overview of Security in Tableau CRM Determining Security Requirements Overview of Using Predicate Filters Implementing Ownership-Based Row-Level Security Implementing Role-Based Row-Level Security Implementing Team-Based Row-Level Security Overriding Security for Implementation and Testing Sharing Inheritance Extended Metadata in a Dataset Overview of Extended Metadata (XMD) Updating Field Metadata Adding Quick Action Menus for Records in Tableau CRM Dashboard Templates and Mobile Dashboards Overview of Tableau CRM Dashboard Templates Overview of JSON for Dashboards Building a Dashboard Using a Template Optimizing Dashboards for a Mobile Device Bindings in Dashboards Understanding Filters in Lenses and Dashboards Multi-Dataset Dashboards Filters with Interactions Custom Queries Query Modification Overview of Modifying Queries Maximizing the Use of the Compare Table Salesforce Analytics Query Language (SAQL) SAQL Queries in a Tableau CRM Dashboard Additional course details: Nexus Humans Salesforce Implement and Manage Tableau CRM (ANC301) training program is a workshop that presents an invigorating mix of sessions, lessons, and masterclasses meticulously crafted to propel your learning expedition forward. This immersive bootcamp-style experience boasts interactive lectures, hands-on labs, and collaborative hackathons, all strategically designed to fortify fundamental concepts. Guided by seasoned coaches, each session offers priceless insights and practical skills crucial for honing your expertise. Whether you're stepping into the realm of professional skills or a seasoned professional, this comprehensive course ensures you're equipped with the knowledge and prowess necessary for success. While we feel this is the best course for the Salesforce Implement and Manage Tableau CRM (ANC301) course and one of our Top 10 we encourage you to read the course outline to make sure it is the right content for you. Additionally, private sessions, closed classes or dedicated events are available both live online and at our training centres in Dublin and London, as well as at your offices anywhere in the UK, Ireland or across EMEA.
Visual Analytics Best Practice
By Tableau Training Uk
This course is very much a discussion, so be prepared to present and critically analyse your own and class mates work. You will also need to bring a few examples of work you have done in the past. Learning and applying best practice visualisation principles will improve effective discussions amongst decision makers throughout your organisation. As a result more end-users of your dashboards will be able to make better decisions, more quickly. This 2 Day training course is aimed at analysts with good working knowledge of BI tools (we use Tableau to present, but attendees can use their own software such as Power BI or Qlik Sense). It is a great preparation for taking advanced certifications, such as Tableau Certified Professional. Contact us to discuss the Visual Analytics Best Practice course Email us if you are interested in an on-site course, or would be interested in different dates and locations This Tableau Desktop training intermediate course is designed for the professional who has a solid foundation with Tableau and is looking to take it to the next level. Attendees should have a good understanding of the fundamental concepts of building Tableau worksheets and dashboards typically achieved from having attended our Tableau Desktop Foundation Course. At the end of this course you will be able to communicate insights more effectively, enabling your organisation to make better decisions, quickly. The Tableau Desktop Analyst training course is aimed at people who are used to working with MS Excel or other Business Intelligence tools and who have preferably been using Tableau already for basic reporting. The course includes the following topics: WHAT IS VISUAL ANALYSIS? Visual Analytics Visual Analytics Process Advantages of Visual Analysis Exercise: Interpreting Visualisations HOW DO WE PROCESS VISUAL INFORMATION? Memory and Processing Types Exercise: Identifying Types of Processing Cognitive Load Exercise: Analysing Cognitive Load Focus and Guide the Viewer Remove Visual Distractions Organise Information into Chunks Design for Proximity Exercise: Reducing Cognitive Load SENSORY MEMORY Pre-attentive Attributes Quantitatively-Perceived Attributes Categorically-Perceived Attributes Exercise: Analysing Pre-attentive Attributes Form & Attributes Exercise: Using Form Effectively Colour & Attributes Exercise: Using Colour Effectively Position & Attributes Exercise: Using Position Effectively ENSURING VISUAL INTEGRITY Informing without Misleading Gestalt Principles Visual Area Axis & Scale Colour Detail Exercise: Informing without Misleading CHOOSING THE RIGHT VISUALISATION Comparing and Ranking Categories Comparing Measures Comparing Parts to Whole Viewing Data Over Time Charts Types for Mapping Viewing Correlation Viewing Distributions Viewing Specific Values DASHBOARDS AND STORIES Exercise: Picking the Chart Type Exercise: Brainstorming Visual Best Practice Development Process for Dashboards and Stories Plan the Visualisation Create the Visualisation Test the Visualisation Exercise: Designing Dashboards and Stories This training course includes over 20 hands-on exercises to help participants “learn by doing” and to assist group discussions around real-life use cases. Each attendee receives an extensive training manual which covers the theory, practical applications and use cases, exercises and solutions together with a USB with all the materials required for the training. The course starts at 09:30 on the first day and ends at 17:00. On the second day the course starts at 09:00 and ends at 17:00. Students must bring their own laptop with an active version of Tableau Desktop 10.5 (or later) pre-installed. What People Are Saying About This Course "Steve was willing to address questions arising from his content in a full and understandable way"Lisa L. "Really enjoyed the course and feel the subject and the way it was taught was very close to my needs"James G. "The course tutor Steve was incredibly helpful and taught the information very well while making the two days very enjoyable."Bradd P. "The host and his courses will give you the tools and confidence that you need to be comfortable with Tableau."Jack S. "Steve was fantastic with his knowledge and knowhow about the product. Where possible he made sure you could put demonstrations in to working practice, to give the audience a clear understanding."Tim H. "This was a very interesting and helpful course, which will definitely help me produce smarter, cleaner visualisations that will deliver more data-driven insights within our business."Richard A. "Steve is very open to questions and will go out of his way to answer any query. Thank you"Wasif N. "Steve was willing to address questions arising from his content in a full and understandable way"Lisa L. "Really enjoyed the course and feel the subject and the way it was taught was very close to my needs"James G.

Tableau Intermediate Bootcamp
By Tableau Training Uk
This will be delivered live by Tableau Visionary and 3 times Tableau Ambassador Dawn Harrington (TechTipsGirl.com) and 2 times Tableau Ambassador Steve Adams (VizDJ.com)
Dashboard design
By Fire Plus Algebra
Data dashboards provide key information to stakeholders so that they can make informed decisions. While there are plenty of software solutions for building these essential data products, there is much less guidance on how to design dashboards to meet the diverse needs of users. This course is for anyone who is building or implementing dashboards, and wants to know more about design principles and best practice. You could be using business intelligence software (such as Power BI or Tableau), or implementing bespoke solutions. The course will give your team the ability to evaluate user needs and levels of understanding, make informed decisions about chart selections, and make effective use of interactivity dynamic data. We’ll work with you before the course to ensure that we understand your organisation and what you’re hoping to achieve. Sample learning content Session 1: Data with a purpose Understanding the different types of dashboard. Information overload and other common dashboard pitfalls. Assessing user needs and levels of data fluency. Session 2: Planning a dashboard Assessing diverse user needs and levels of data fluency. Taking a User Experience (UX) approach to design and navigation. Applying an interative and collaborative approach to onboarding. Session 3: Graphs, charts and dials Understanding how graphical perception informs chart choices. Making intelligent design choices to help users explore. Design principles for layout and navigation. Session 4: Using interactivity Making effective use of filters to slice and dice data sets. Using layers of information to enable drilldown data exploration. Complenting dashboards with automated alerts and queries. Delivery We deliver our courses over Zoom, to maximise flexibility. The training can be delivered in a single day, or across multiple sessions. All of our courses are live and interactive – every session includes a mix of formal tuition and hands-on exercises. To ensure this is possible, the number of attendees is capped at 16 people. Tutor Alan Rutter is the founder of Fire Plus Algebra. He is a specialist in communicating complex subjects through data visualisation, writing and design. He teaches for General Assembly and runs in-house training for public sector clients including the Home Office, the Department of Transport, the Biotechnology and Biological Sciences Research Council, the Health Foundation, and numerous local government and emergency services teams. He previously worked with Guardian Masterclasses on curating and delivering new course strands, including developing and teaching their B2B data visualisation courses. He oversaw the iPad edition launches of Wired, GQ, Vanity Fair and Vogue in the UK, and has worked with Condé Nast International as product owner on a bespoke digital asset management system for their 11 global markets. Testimonial “Alan was great to work with, he took us through the concepts behind data visualisation which means our team is now equipped for the future. He has a wide range of experience across the topic that is delivered in a clear, concise and friendly manner. We look forward to working with Alan again in the future.” John Masterson | Chief Product Officer | ImproveWell

Data visualization and infographics
By Fire Plus Algebra
The insights gained from data analysis are only truly valuable when you can be clearly expressed to other people – bosses, colleagues, clients, customers, or other stakeholders. In this workshop you’ll learn how to turn raw qualitative or quantitative data into a clear visual story through infographics and data visualization. We'll discuss the key principles for planning an effective visual, look at examples of best (and worst) practice, and learn repeatable and practical design techniques for enhancing the story. We'll also give you an overview of useful tools that will help you turn your idea into a finished infographic or data visualization. You could be conjuring up eye-catching slide decks, building effective reports and dashboards, pitching to investors, or presenting persuasive data to your most important customers. This is a fully interactive online workshop, so be prepared to join discussions and get hands on with building your own visualisations. Takeaways Be able to evaluate the elements that make an infographic or visualization effective. Learn quick and repeatable visual tricks for ensuring infographics convey a clear message. Understand how to tailor your approach to different audiences and context. Discover a bunch of free tools and resources to help you build your own visualizations. Understand how online, interactive visualizations work and how to create them. Delivery We deliver our courses over Zoom, to maximise flexibility. The training can be delivered in a single day, or across multiple sessions. All of our courses are live and interactive – every session includes a mix of formal tuition and hands-on exercises. To ensure this is possible, the number of attendees is capped at 16 people. Tutor Alan Rutter is the founder of Fire Plus Algebra. He is a specialist in communicating complex subjects through data visualisation, writing and design. He teaches for General Assembly and runs in-house training for public sector clients including the Home Office, the Department of Transport, the Biotechnology and Biological Sciences Research Council, the Health Foundation, and numerous local government and emergency services teams. He previously worked with Guardian Masterclasses on curating and delivering new course strands, including developing and teaching their B2B data visualisation courses. He oversaw the iPad edition launches of Wired, GQ, Vanity Fair and Vogue in the UK, and has worked with Condé Nast International as product owner on a bespoke digital asset management system for their 11 global markets. Testimonials "Just to say what a great course this was. I have made my first report employing some of the ideas and tools you showed us – to rapturous responses! The next actions are clear for all and they all understood it! Thank you for helping me to organise my data and thoughts, showing how to present the key message up front, and how to keep it simple and focused. Gearing up for another report now!" Kay Anderson | Head of Finance | Mima "We have been using Tableau to display data for some time but knew we could do more to engage our end users. Alan’s training gave us a framework to start thinking about what we wanted to achieve with our visualisations and analysis, and some great tips on how to display information for maximum impact. Alan was an engaging trainer and we found the workshops very energising." Ellen Austin | Senior Data Analyst | London School of Economics
Data Science for Marketing Analytics
By Nexus Human
Duration 3 Days 18 CPD hours This course is intended for Data Science for Marketing Analytics is designed for developers and marketing analysts looking to use new, more sophisticated tools in their marketing analytics efforts. It'll help if you have prior experience of coding in Python and knowledge of high school level mathematics. Some experience with databases, Excel, statistics, or Tableau is useful but not necessary. Overview By the end of this course, you will be able to build your own marketing reporting and interactive dashboard solutions. The course starts by teaching you how to use Python libraries, such as pandas and Matplotlib, to read data from Python, manipulate it, and create plots, using both categorical and continuous variables. Then, you'll learn how to segment a population into groups and use different clustering techniques to evaluate customer segmentation.As you make your way through the course, you'll explore ways to evaluate and select the best segmentation approach, and go on to create a linear regression model on customer value data to predict lifetime value. In the concluding sections, you'll gain an understanding of regression techniques and tools for evaluating regression models, and explore ways to predict customer choice using classification algorithms. Finally, you'll apply these techniques to create a churn model for modeling customer product choices. Data Preparation and Cleaning Data Models and Structured Data pandas Data Manipulation Data Exploration and Visualization Identifying the Right Attributes Generating Targeted Insights Visualizing Data Unsupervised Learning: Customer Segmentation Customer Segmentation Methods Similarity and Data Standardization k-means Clustering Choosing the Best Segmentation Approach Choosing the Number of Clusters Different Methods of Clustering Evaluating Clustering Predicting Customer Revenue Using Linear Regression Understanding Regression Feature Engineering for Regression Performing and Interpreting Linear Regression Other Regression Techniques and Tools for Evaluation Evaluating the Accuracy of a Regression Model Using Regularization for Feature Selection Tree-Based Regression Models Supervised Learning: Predicting Customer Churn Classification Problems Understanding Logistic Regression Creating a Data Science Pipeline Fine-Tuning Classification Algorithms Support Vector Machine Decision Trees Random Forest Preprocessing Data for Machine Learning Models Model Evaluation Performance Metrics Modeling Customer Choice Understanding Multiclass Classification Class Imbalanced Data Additional course details: Nexus Humans Data Science for Marketing Analytics training program is a workshop that presents an invigorating mix of sessions, lessons, and masterclasses meticulously crafted to propel your learning expedition forward. This immersive bootcamp-style experience boasts interactive lectures, hands-on labs, and collaborative hackathons, all strategically designed to fortify fundamental concepts. Guided by seasoned coaches, each session offers priceless insights and practical skills crucial for honing your expertise. Whether you're stepping into the realm of professional skills or a seasoned professional, this comprehensive course ensures you're equipped with the knowledge and prowess necessary for success. While we feel this is the best course for the Data Science for Marketing Analytics course and one of our Top 10 we encourage you to read the course outline to make sure it is the right content for you. Additionally, private sessions, closed classes or dedicated events are available both live online and at our training centres in Dublin and London, as well as at your offices anywhere in the UK, Ireland or across EMEA.
Crystal Reports 2016 - Part 2
By Nexus Human
Duration 2 Days 12 CPD hours This course is intended for This course is designed for people who know how to create basic list and group reports and need to create reports that include subreports, cross-tabs, advanced formulas, and charts based on more than one data series. They may also need to build tools that make it easier for other people to create reports. They may or may not have programming and/or SQL experience. Overview In this course, you will create complex reports using tools in Crystal Reports 2016. You will: Create automatic and manual running totals. Work with cross-tab reports. Add subreports. Create drill-downs in a report. Use SQL statements in report processing. Create complex formulas. Add charts to reports. Enhance report functionality. In this course, students will create complex reports & data sources using the tools in Crystal Reports 2016. Students will not only create more complex reports including sub-reports and cross-tabs, but will also increase their speed and efficiency. 1 - CREATING RUNNING TOTALS Topic A: Create a Running Total Field Topic B: Modify a Running Total Field Topic C: Create a Manual Running Total 2 - WORKING WITH CROSS-TABS Topic A: Create a Cross-Tab Report Topic B: Format a Cross-Tab Report Topic C: Create Groups in Cross-Tab Reports 3 - ADDING SUBREPORTS Topic A: Insert a Subreport Topic B: Edit a Subreport Topic C: Share Variables 4 - CREATING DRILL-DOWNS IN A REPORT Topic A: Create a Drill-Down Topic B: Create Headings for Drill-Down Data 5 - USING SQL STATEMENTS IN REPORT PROCESSING Topic A: Create a Report Using SQL Queries Topic B: Summarize Report Data Topic C: Create Joins Using SQL Topic D: Create Subqueries Topic E: Create an SQL Expression Field 6 - CREATING COMPLEX FORMULAS Topic A: Work with Loops Topic B: Work with Arrays 7 - ADDING CHARTS TO REPORTS Topic A: Create Charts Topic B: Create a Chart with Drill-Down Topic C: Create a Top N Chart Topic D: Create a Cross-Tab Chart Topic E: Create Charts for Grouped Data Topic F: Format a Chart Topic G: Create a Chart Template 8 - ENHANCING REPORT FUNCTIONALITY Topic A: Organize Data Based on a Hierarchy Topic B: Create a Dynamic Image Topic C: Create a Report Alert Topic D: Create a Geographic Map 9 - APPENDIX Appendix A: Managing Reports Appendix B: Processing Data on the Server Appendix C: Detecting and Fixing Problems