- Professional Development
- Medicine & Nursing
- Arts & Crafts
- Health & Wellbeing
- Personal Development
Network forensics training course description This course studies network forensics-monitoring and analysis of network traffic for information gathering, intrusion detection and legal evidence. We focus on the technical aspects of network forensics rather than other skills such as incident response procedures etc.. Hands on sessions follow all the major sections. What will you learn Recognise network forensic data sources. Perform network forensics using: Wireshark NetFlow Log analysis Describe issues such as encryption. Network forensics training course details Who will benefit: Technical network and/or security staff. Prerequisites: TCP/IP foundation for engineers. Duration 3 days Network forensics training course contents What is network forensics? What it is, host vs network forensics, purposes, legal implications, network devices, network data sources, investigation tools. Hands on whois, DNS queries. Host side network forensics Services, connections tools. Hands on Windows services, Linux daemons, netstat, ifoconfig/ipconfig, ps and Process explorer, ntop, arp, resource monitor. Packet capture and analysis Network forensics with Wireshark, Taps, NetworkMiner. Hands on Performing Network Traffic Analysis using NetworkMiner and Wireshark. Attacks DOS attacks, SYN floods, vulnerability exploits, ARP and DNS poisoning, application attacks, DNS ANY requests, buffer overflow attacks, SQL injection attack, attack evasion with fragmentation. Hands on Detecting scans, using nmap, identifying attack tools. Calculating location Timezones, whois, traceroute, geolocation. Wifi positioning. Hands on Wireshark with GeoIP lookup. Data collection NetFlow, sflow, logging, splunk, splunk patterns, GRR. HTTP proxies. Hands on NetFlow configuration, NetFlow analysis. The role of IDS, firewalls and logs Host based vs network based, IDS detection styles, IDS architectures, alerting. Snort. syslog-ng. Microsoft log parser. Hands on syslog, Windows Event viewer. Correlation Time synchronisation, capture times, log aggregation and management, timelines. Hands on Wireshark conversations. Other considerations Tunnelling, encryption, cloud computing, TOR. Hands on TLS handshake in Wireshark.
Network management technologies course description A comprehensive tour of the available network management technologies available for todays networks. The course starts with basic tools such as syslog along with Python network automation. SNMP is then covered with the *flow technologies and streaming telemetry. Configuration management with ansible, Python, NETCONF and RESTCONF is then studied. The final part of the course looks at SDN. Hands on sessions are used throughout to reinforce the theory rather than teach specific manufacturer equipment. Note that sections are available as individual courses. What will you learn Evaluate network management technologies. Evaluate network management technologies. Recognise the weaknesses of SNMP versus NETCONF and streaming telemetry. Explain the role of NETCONF and RESTCONF. Compare & contrast *flow and streaming telemetry. Explain the role of SDN in network management. Automate network configuration with ansible and Python. Network management technologies course details Who will benefit: Those wishing to manage networks. (Previous Python experience is NOT needed) Prerequisites: Intro to data comms Duration 5 days Network management technologies course content Basic network management Network management What is network management? Benefits, issues. FCAPS model. Fault management, Configuration management, accounting, performance, security. What to manage, what not to manage. Managing network devices, managing servers. Monitoring networks Traditional network tools Ping..., SSH, syslog, TFTP for configurations. nmap. Wireshark. CLI. Web based management. Splunk. Nessus, snort, Kali. Hands on syslog, network inventories. Network automation using the CLI Programming and automating networks, netOps. Python, Git. Python network modules, SSH, paramiko, netmiko. EVE-NG. Hands onPython network modules. Structured versus unstructured data Problems with automation and unstructured data. XML, JSON, YAML. The role of YANG. Hands on Parsing data. SNMP SNMP architecture, SNMP MIBs, SMI, the SNMP protocol, polling security. Configuring SNMP. SNMPv1, v2, v3, SNMP security. Which version should you use? MIBs and MIB structure. mib-2, extra parts of mib-2, Private enterprise MIBs. Summary: What SNMP is good/bad at. Hands on Configuring agents and a NMS. MIB browsing. Server management Microsoft, Linux, application polling. WMI vs SNMP. Hands on: Application polling. Performance management *flow Polling, push vs pull, netflow, sflow, IPFIX, *flow. Flows. Where to monitor traffic. Comparing *flow with SNMP. Architecture: Generators and collectors. When flows are exported. NetFlow reporting products. SolarWinds. Hands on Netflow configuration. Collectors. Streaming telemetry Model driven telemetry, periodic/on change. Structured data. Telemetry protocol stack. gRPC and gNMI. Protobuf. gNMI operations. Telemetry architecture. Telegraf, databases, Grafana. Hands on Telemetry example. Configuration management Configuration management tools Chef, puppet, ansible, saltstack. Ansible architecture, controlling machines, nodes, agentless, SSH, modules. Inventories, playbooks, modules, network modules, jinja2 templates. Hands on Network configuration with ansible. NETCONF What is NETCONF? Protocol stack, Data stores, traffic flows, validating configurations, rollback. YANG data models and how YANG is used by NETCONF. XML. Explorers and other tools. Hands on anx, Python and NETCONF. RESTCONF The REST API, HTTP, What is RESTCONF? Tools including Postman. Comparison with NETCONF. Hands on Configuration with RESTCONF. Python network automation: configuration SSH issues. Using structured data. Jinja2. ncclient, requests, NAPALM, Nornir. Automated testing. Hands on Python network device configuration with nornir. Software Defined Networks and orchestration Classic SDN What is SDN? benefits. SDN architecture. SDN applications, SDN switches, SDN controllers, Network Operating Systems. Control plane, data plane. Northbound interfaces. SDN components. Southbound interfaces. OpenFlow. ONF, OpenFlow ports, Flow tables. Network virtualization Virtual networks, virtual switches, NfV. Service chaining. NfV and SDN. SDN implementations Classic SDN, Hybrid SDN, SDN via APIs, SDN via overlays. Data centre SDN, VXLAN, Service Provider SDN, SD WAN, Enterprise SDN, WiFi. SDN and open source OpenDaylight, OpenVSwitch, Open Networking Forum, Open Network Operating System. Hands onOpenStack. SD-WAN What is SD-WAN? Architecture: Edge, gateway, orchestrator, controller. Overlay and underlay. Use of MPLS, 4G/5G. Benefits and features. Secure Access Service Edge (SASE).

Online Options
Show all 8Splunk for Beginners: Make the Most of Machine Data Using Splunk
By Packt
In this course, you will learn to create effective visualizations for different stakeholders with the Splunk web framework, utilize tokens and event handlers, explore SDKs, interact with REST APIs, and build a test lab for log analysis and incident response.
Splunk Boot Camp
By Nexus Human
Duration 2 Days 12 CPD hours This course is intended for Developers, Data Engineers, Architects, and Administrators Overview Join an engaging hands-on learning environment, where you'll learn: Splunk essentials Indexing in Splunk Splunk architecture and components Query and search your data How to create dashboards and visualizations How to apply alerts This is a hands-on course with engaging instruction, demos, group discussions, labs, and project work. Join an engaging hands-on learning environment, where you?ll learn - Splunk essentials Indexing in Splunk Splunk architecture and components Query and search your data How to create dashboards and visualizations How to apply alerts This is a hands-on course with engaging instruction, demos, group discussions, labs, and project work. Introduction to Splunk What?s Splunk? What?s Splunk? Authentication Methods Access Controls and Users Products, Licensing, and Costs Quick Tour Guide: User Interface Indexes Splunk Data What are Indexes? Search-Head Index Clusters Index Pipeline Events Fields and Field Extraction Forwarders Metrics Removing Data Splunk Architecture Components of Splunk Deployments Deployment Scenarios Search Processing Language What is Search Processing Language (SPL)? Searching Operators Search Commands Search Pipeline Sub-searches Commonly Used Search Commands Drilldowns Lookups Optimize Searches Dashboard and Visualizations Dashboards in Splunk Creating Dashboards Visualization Types Search as Reports Dashboards Drilldown Forms Alerts Creating Alerts Scheduling Alerts Alerts Notifications Scheduled Reports Creating Scheduled Reports Putting the Pieces Together In your final exercise, you?ll configure a typical scenario when using Splunk. You'll install and configure an NGINX, then the Splunk forwarder to collect logs in Splunk. The idea is that you can apply everything you've learned within the Bootcamp: creating searches, visualizations, dashboards, etc.

Cisco Splunk for Cisco Integrated Infrastructure (SPLUNK)
By Nexus Human
Duration 2 Days 12 CPD hours This course is intended for The primary audience for this course is as follows: System Engineers System Administrators Architects Channel Partners Data Analysts Overview Upon completing this course, you will be able to meet these overall objectives: Describe how harnessing the power of your machine data enables you to make decisions based on facts, bot intuition or best guesses. Reduce the time you spend investigating incidents by up to 90%. Find and fix problems faster by learning new technical skills for real world scenarios. Get started with Splunk Enterprise, from installation and data onboarding to running search queries to creating simple reports and dashboards. Accelerate time to value with turnkey Splunk integrations for dozens of Cisco products and platforms. Ensure faster, more predictable Splunk deployments with a proven Cisco Validated Design and the latest Cisco UCS server. This course will cover how Splunk software scales to collect and index hundreds of terabytes of data per day, across multi-geography, multi-datacenter and cloud based infrastructures. Using Cisco?s Unified Computing System (UCS) Integrated Infrastructure for Big Data offers linear scalability along with operational simplification for single-rack and multiple-rack deployments. Cisco Integrated Infrastructure for Big Data and Splunk What is Cisco CPA? Architecture benefits for Splunk Components of IIBD and relationship to Splunk Architecture Cisco UCS Integrated Infrastructure for Big Data with Splunk Enterprise Splunk- Big Data Analytics NFS Configurations for the Splunk Frozen Data Storage NFS Client Configurations on the Indexers Splunk- Start Searching Chargeback Reporting Building custom reports using the report builder Application Containers Understanding Application Containers Understanding Advanced Tasks Task Library & Inputs CLI & SSH Task Understanding Compound Tasks Custom Tasks Open Automation Troubleshooting UCS Director Restart Module Loading Report Errors Feature Loading Report Registration REST API- Automation UCS Director Developer Tools Accessing REST using a REST client Accessing REST using the REST API browser Open Automation SDK Overview Open Automation vs. Custom Tasks Use Cases UCS Director PowerShell API Cisco UCS Director PowerShell Console Installing & Configuring Working with Cmdlets Cloupia Script Structure Inputs & Outputs Design Examples Additional course details: Nexus Humans Cisco Splunk for Cisco Integrated Infrastructure (SPLUNK) training program is a workshop that presents an invigorating mix of sessions, lessons, and masterclasses meticulously crafted to propel your learning expedition forward. This immersive bootcamp-style experience boasts interactive lectures, hands-on labs, and collaborative hackathons, all strategically designed to fortify fundamental concepts. Guided by seasoned coaches, each session offers priceless insights and practical skills crucial for honing your expertise. Whether you're stepping into the realm of professional skills or a seasoned professional, this comprehensive course ensures you're equipped with the knowledge and prowess necessary for success. While we feel this is the best course for the Cisco Splunk for Cisco Integrated Infrastructure (SPLUNK) course and one of our Top 10 we encourage you to read the course outline to make sure it is the right content for you. Additionally, private sessions, closed classes or dedicated events are available both live online and at our training centres in Dublin and London, as well as at your offices anywhere in the UK, Ireland or across EMEA.

Maven and SonarQube for DevOps Engineers - Beginners Guide
By Packt
Want to learn how to use Maven and SonarQube effectively for code building and code quality analysis as a DevOps engineer? Then you are in the right place. This learner-centered hands-on course will help you gain confidence in using important DevOps tools such as SVN, Maven, Jenkins, Chef, Puppet, Nagios, Splunk, Selenium, and more. Some basic knowledge of Linux, Git, and AWS EC2 will help you get the most out of this course.
VMware NSX Advanced Load Balancer: Troubleshooting and Operations [V20.x]
By Nexus Human
Duration 3 Days 18 CPD hours This course is intended for Experienced system administrators or network administrators Network professionals who have experience working with VMware NSX Advanced Load Balancer (Avi) and are responsible for troubleshooting and operating Application Delivery Controllers solutions Overview By the end of the course, you should be able to meet the following objectives: Become familiar with NSX Advanced Load Balancer (Avi) troubleshooting tools and steps to solve the problems. Establish and apply a structured troubleshooting approach and methodology Understand built-in mechanisms available for NSX Advanced Load Balancer (Avi) monitoring Identify, analyze, and troubleshoot problems related to the NSX Advanced Load Balancer infrastructure, including control and data plane components Identify, analyze, and troubleshoot problems related to application components such as Virtual Services, Pools, and related components This 3-day, hands-on training course provides you with the advanced knowledge, skills, and tools to achieve competence in operating and troubleshooting the VMware NSX© Advanced Load Balancer? (Avi) solutions. In this course, you are introduced to several operational, management, and troubleshooting tools. You will be presented with various types of technical problems, which you will identify, analyze, and solve through a systematic process. Course Introduction Introductions and course logistics Course objectives Introduction to NSX Advanced Load Balancer Introduce NSX Advanced Load Balancer Discuss NSX Advanced Load Balancer use cases and benefits Explain NSX Advanced Load Balancer architecture and components Explain the management, control, data, and consumption planes and functions Events and Alerts Describe NSX Advanced Load Balancer Events Describe and configure NSX Advanced Load Balancer Alerts Describe NSX Advanced Load Balancer monitoring capabilities leveraging SNMP, Syslog, and email Introduction to NSX Advanced Load Balancer Troubleshooting Explain NSX Advanced Load Balancer troubleshooting concepts Describe and leverage Virtual Service Traffic Logs Describe and leverage Virtual Service Security Insights Understand and utilize Health Score concepts Explain and leverage application metrics and analytics Explain and leverage packet capture and CLI utilities for application troubleshooting Leverage UI, CLI, and useful log files to perform control plane troubleshooting Infrastructure Troubleshooting Describe and perform general VMware Cloud Connector troubleshooting Describe and analyze VMware Cloud Connector state Leverage case studies to troubleshoot VMware Cloud Connector Describe and troubleshoot NSX-T Cloud Connector integration Leverage case studies to troubleshoot NSX-T Cloud Connector Describe and troubleshoot Linux Server Cloud Connector integration Describe and troubleshoot OpenStack Cloud Connector integration Leverage case studies to troubleshoot OpenStack Cloud Connector Describe and troubleshoot AWS and Azure Cloud Connector integrations Troubleshooting NSX Advanced Load Balancer Service Engines and Advanced Troubleshooting Explain general Service Engine infrastructure Explain and leverage analytics, health score, and metrics for Service Engine troubleshooting Explain and leverage Events and Alerts for Service Engine troubleshooting Leverage CLI for accessing Service Engine Analyze Service Engine logs offline with Tech Support utility and collecting core dumps Leverage CLI and useful log files for Service Engine Data Plane troubleshooting Leverage CLI to capture packets for advanced datapath analysis Monitoring NSX Advanced Load Balancer Explain and configure SNMP-based monitoring Explain and configure REST API-based monitoring Describe and leverage 3rd-party integration with monitoring tools like Splunk Leverage 3rd-party REST API monitoring extensions like Prometheus Describe and leverage VMware integrations like VMware vRealize© Network Insight? for monitoring Additional course details:Notes Delivery by TDSynex, Exit Certified and New Horizons an VMware Authorised Training Centre (VATC) Nexus Humans VMware NSX Advanced Load Balancer: Troubleshooting and Operations [V20.x] training program is a workshop that presents an invigorating mix of sessions, lessons, and masterclasses meticulously crafted to propel your learning expedition forward. This immersive bootcamp-style experience boasts interactive lectures, hands-on labs, and collaborative hackathons, all strategically designed to fortify fundamental concepts. Guided by seasoned coaches, each session offers priceless insights and practical skills crucial for honing your expertise. Whether you're stepping into the realm of professional skills or a seasoned professional, this comprehensive course ensures you're equipped with the knowledge and prowess necessary for success. While we feel this is the best course for the VMware NSX Advanced Load Balancer: Troubleshooting and Operations [V20.x] course and one of our Top 10 we encourage you to read the course outline to make sure it is the right content for you. Additionally, private sessions, closed classes or dedicated events are available both live online and at our training centres in Dublin and London, as well as at your offices anywhere in the UK, Ireland or across EMEA.
![VMware NSX Advanced Load Balancer: Troubleshooting and Operations [V20.x]](https://cademy-images-io.b-cdn.net/9dd9d42b-e7b9-4598-8d01-a30d0144ae51/4c81f130-71bf-4635-b7c6-375aff235529/original.png?width=3840)
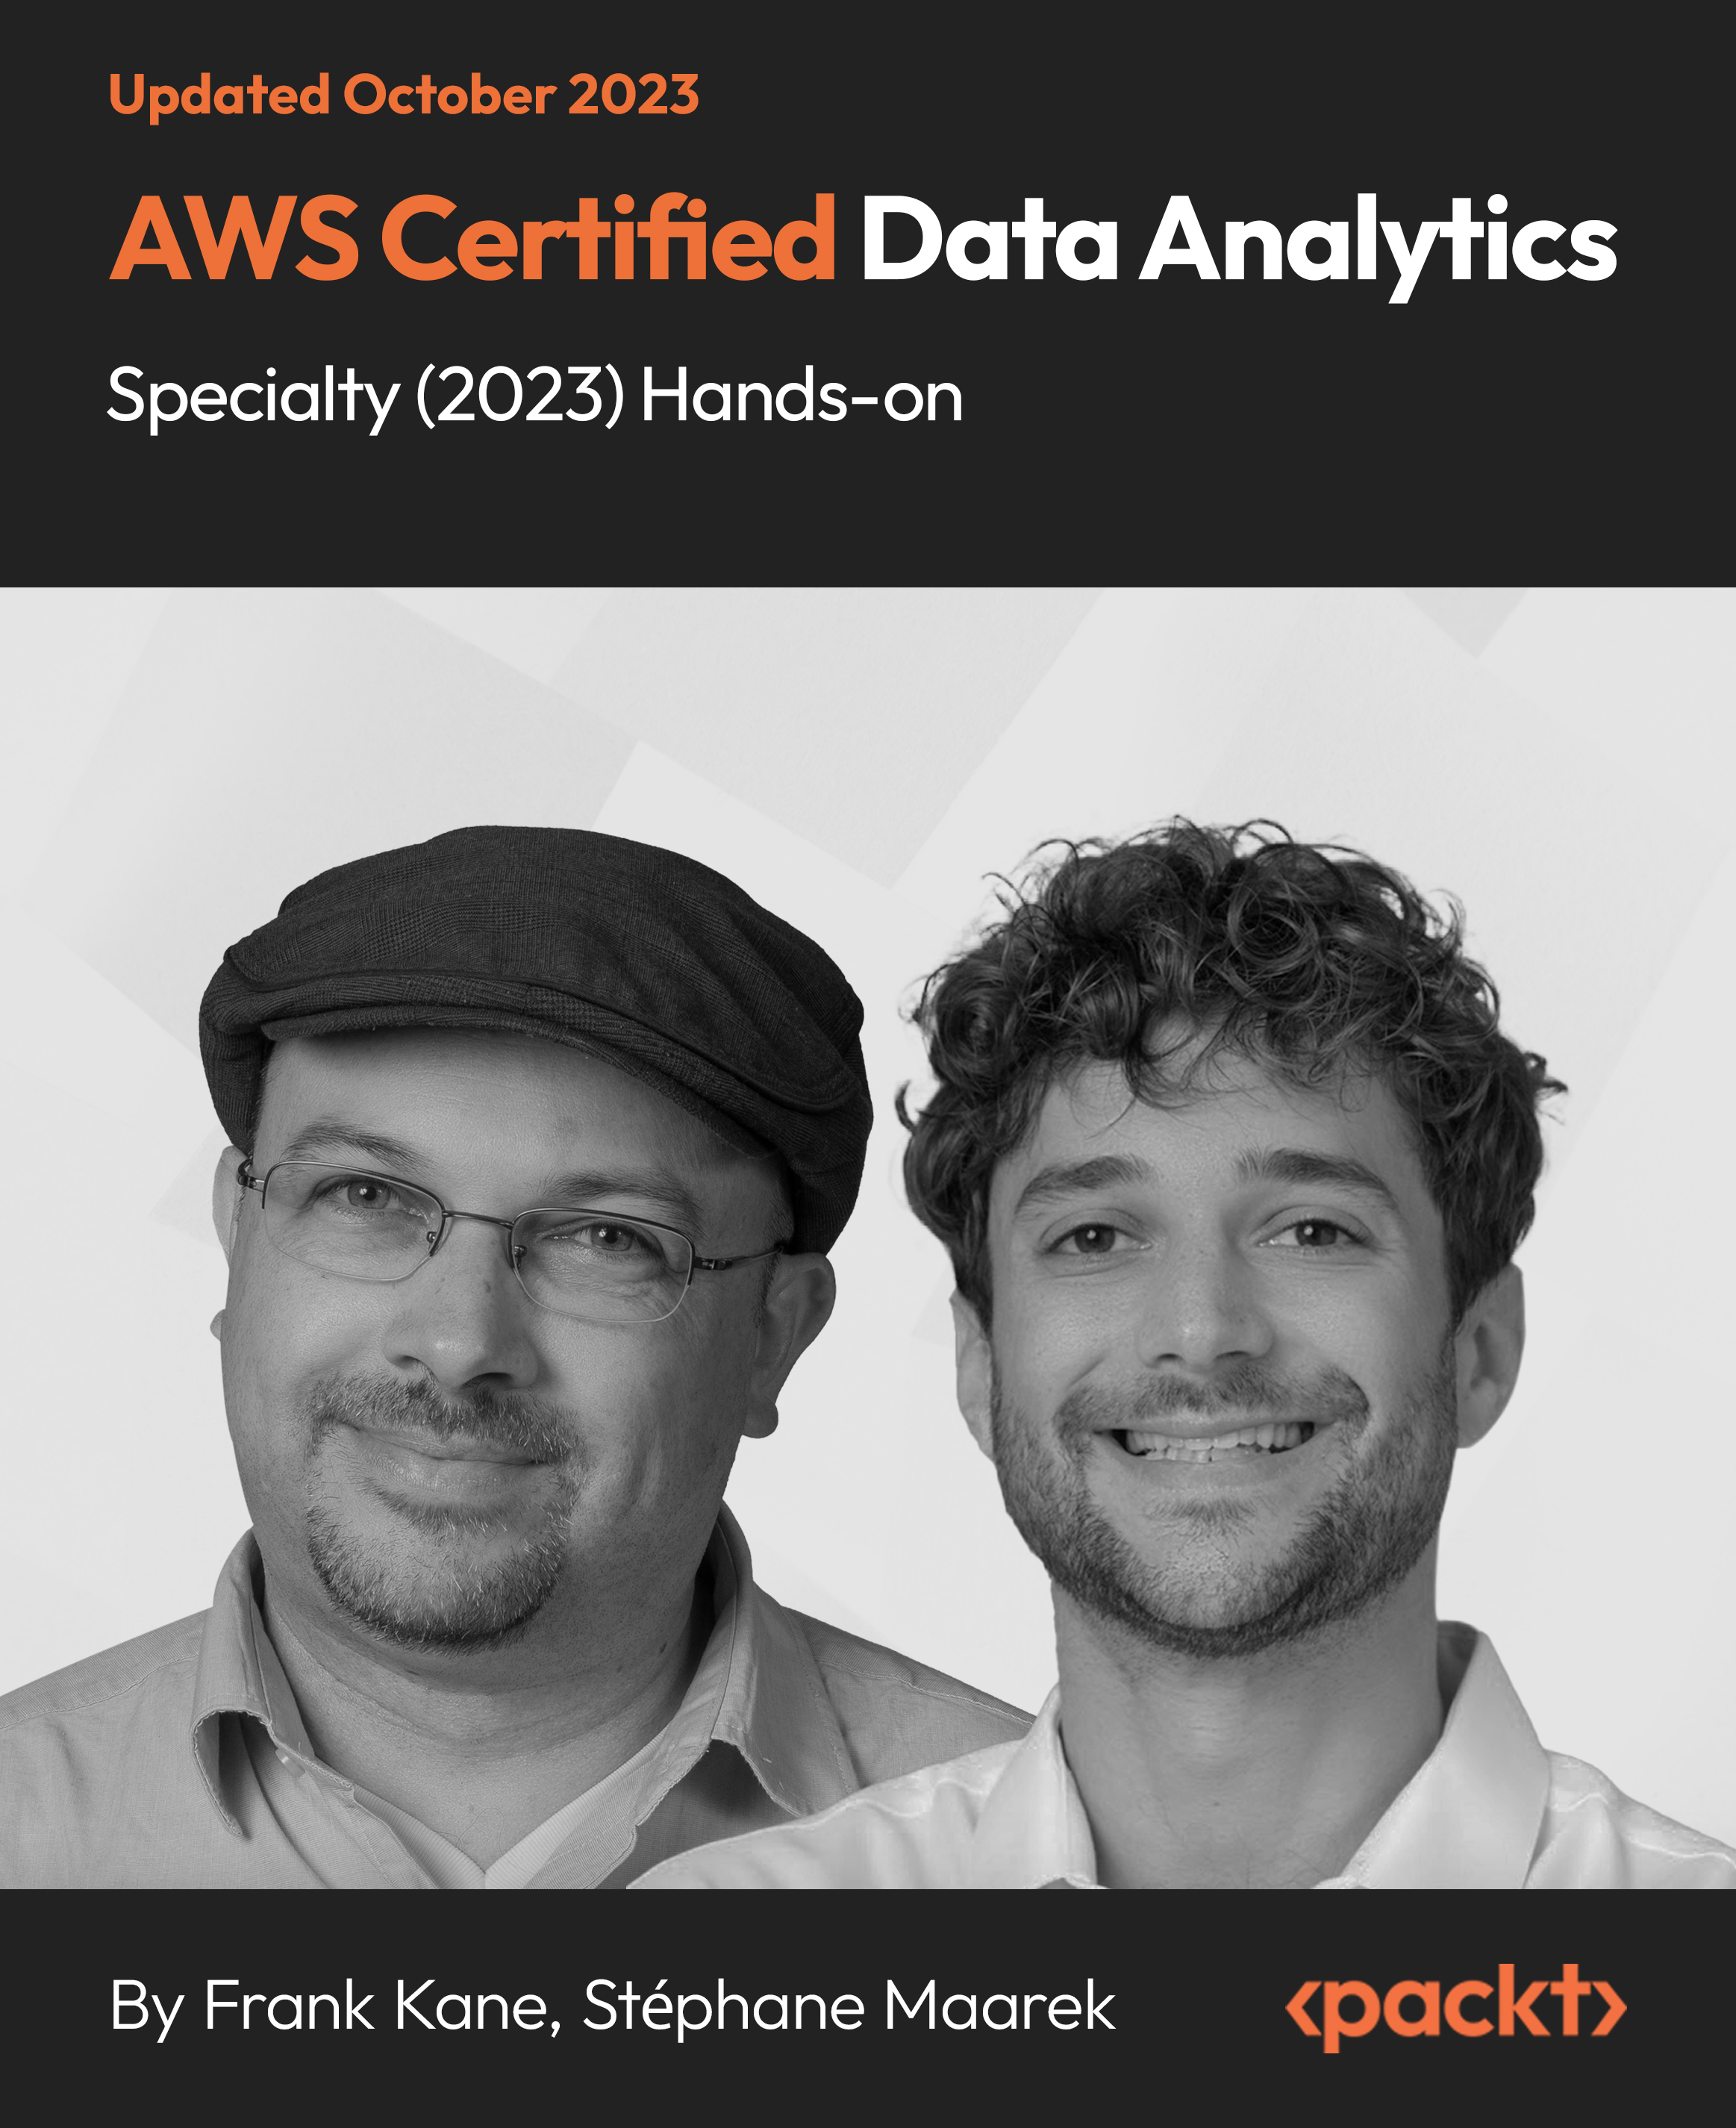
AWS Certified Data Analytics Specialty (2023) Hands-on
By Packt
This course covers the important topics needed to pass the AWS Certified Data Analytics-Specialty exam (AWS DAS-C01). You will learn about Kinesis, EMR, DynamoDB, and Redshift, and get ready for the exam by working through quizzes, exercises, and practice exams, along with exploring essential tips and techniques.
Search By Location
- Splunk Courses in London
- Splunk Courses in Birmingham
- Splunk Courses in Glasgow
- Splunk Courses in Liverpool
- Splunk Courses in Bristol
- Splunk Courses in Manchester
- Splunk Courses in Sheffield
- Splunk Courses in Leeds
- Splunk Courses in Edinburgh
- Splunk Courses in Leicester
- Splunk Courses in Coventry
- Splunk Courses in Bradford
- Splunk Courses in Cardiff
- Splunk Courses in Belfast
- Splunk Courses in Nottingham