- Professional Development
- Medicine & Nursing
- Arts & Crafts
- Health & Wellbeing
- Personal Development
Environmental awareness and management (In-House)
By The In House Training Company
A flexible, modular-based, programme to heighten participants' awareness of ways in which their operations can affect the environment, the principles of environmental management and the practical steps they need to take as individuals and as an organisation to improve environmental performance. Depending on the course modules selected, this programme will give participants: Increased awareness of relevant environmental issues A greater understanding of, and commitment to, the organisation's environmental management programme Preparation for any responsibilities they may have under an Environmental Management System Further benefits according to options chosen 1 Environmental awareness Definition of 'the environment' Key environmental issuesGlobal warmingOzone depletionAcid rainAir qualityWater pollutionContaminated landLand take and green belt shrinkageResource usageHabitat destruction and species extinctions. Option: This module can be used to explain the key environmental issues related to the activities of your own organisation. Diagrams, photos, pictures, examples and statistics relevant to your own organisation are used where possible to illustrate the points being made. 2 Environmental legislation Key elements of environmental legislation affecting the activities of your organisation - including international, European and UK legislation. Legislation of particular relevance to your organisation - how it affects the operations of your organisation Option: Legislation can be dealt with according to which aspect of the environment it protects (eg, air, water, waste) or which part of your organisation's activities it affects Consequences of breaching legislation 3 Environmental management systems Overview of what an environmental management system isHow is an Environmental Management System (EMS) designed and put together?Key elements (emphasising Plan - Do - Check - Review cycle)The need to continually improve Pros and consReasons for having an EMSBenefits of an EMSConsequences of not managing the environmentCosts of installing an EMS Explanation of ISO 14001 and EMAS standards and guidance as applicable to the EMSs of your organisationOverview of your organisation's EMSHow it was set up / is being developed / operatesWho is responsible for itKey parts of system (eg, environmental policy, objectives and targets) identified and discussedEMS documentation - what and where it is. Workshop option: Brainstorm 'Pros and cons' with the participants, come up with all their ideas for good and bad things about EMS and demonstrate that the 'good' list is longer than the 'bad' 4 Environmental consequences Define what an environmental impact is and discuss how they are determined, with reference to the EMS Identify why we want to determine the environmental consequences of operations and activities; how they are used in the EMS for planning, and reducing the impact on the environment Establish key environmental consequences of construction and operational activities on the site; discuss significance ranking and the control measures in place in your organisation. Workshop option: In small groups, participants are asked to identify the impact on the environment of your organisation's activities or a part of their activities. They are then asked to rank these impacts in terms of their significance, using guidelines provided to help them be aware of the contributing factors (eg, frequency, severity). For a selected number of the impacts, the participants are asked to identify what control measures there are and which of these they play a part in. All stages can be discussed with trainers as a whole group at various stages during the workshop. 5 Protected species, nature conservation and invasive weeds Nature conservation, landscape and visual issues in the planning process - overview of key nature UK wildlife legislation, EIA, appropriate timing of surveys, Hedgerow regulations and landscape and visual impact issues Ecological issues - ecological legislation, significant species, hedgerows Archaeology in the development process - why archaeology is important, organisation in the UK, legislation and planning guidance Construction phase issues and consents - major environmental issues during construction, including water resources and land drainage consents, discharges to land or water, water abstraction, public rights of way, tree protection, waste management, Special waste, noise, good practice pollution control and Environmental Audits Identification and management of invasive weeds - including legal position regarding management 6 Chemicals and fuels handling and storage How health and safety management is closely linked to environmental management of materials Planning - what mechanisms are in place for planning materials use; legislation, guidance and policies which define how to manage materials Materials storage - what are the considerations for storing materials, covering:Labels: what are the different types and what do they tell us?Storage facilities: what are the requirements for safe storage of materials (eg, signs, secondary containment, access, segregation, lids/covers)Handling: safe handling for protecting the environment, organisational procedures, high risk situations (eg, decanting, deliveries), how to reduce the risks (eg, use of funnels, proper supervision, training)COSHH and MSDS: brief explanation of legislation and its role in environmental control of hazardous materials, how to use the information provided by COSHH assessments Option: These sessions can be illustrated with photographs/pictures and examples of good and bad storage and handling practices Workshop Options: Labelling Quiz - quick-fire quiz on what different labels tell us; Build a Storage Facility - participants are asked to consider all the environmental requirements for building a safe storage facility for their organisation 7 On-site control measures Overview of the legislation associated with nuisance issues on site and mitigating problems when they arise Examples of bad practice, including fuel storage tanks and mobile equipment - costs involved with prosecution of fuel spills, remediation costs, management costs, legal fees, bad PR coverage Identification and management of contaminated land and relevant legislation Workshop option: Participants are provided with a site plan containing information on site features, environmental conditions and indications of potential issues 8 Waste management Why worry about waste? - a look at how waste disposal can impact on the environment, illustrated by examples of waste-related incidents, statistics on waste production on national, industry-wide and organisational levels, landfill site space, etc Legislation - overview of the relevant legislation, what the main requirements of the regulations are, what penalties there are, and the associated documentation (waste transfer notes) Waste classification - a more in-depth look at how waste is classified under legislation according to hazardous properties, referring to Environment Agency guidance Handling and storage requirements - what are the requirements of the applicable waste legislation and how are they covered by organisational procedures? Examples of good and bad environmental practice associated with handling and storing waste. Workshop option: 'Brown bag' exercise - participants pass round a bag containing tags each with a different waste printed on. They are asked to pick out a tag and identify the classification and the handling, storage and disposal requirements for the waste they select Waste minimisation - overview of the waste minimisation 'ladder' and its different options (elimination, reduction, reuse and recycling), benefits of waste minimisation, examples of waste minimisation techniques Workshop option: Participants are asked to identify opportunities that actually exist within the organisation for minimising production of waste that are not currently being taken advantage of 9 Auditing Requirements for environmental auditing of operations Auditing the EMS Types of internal and external audits Requirements EMS standards (ISO 14001 and EMAS) Carrying out internal audits and being prepared for external audits Workshop options:Mock audit 'Brown Bag' - can be used either for trainers to test participants as if they were in an audit situation, or for the participants to test each other and practice their auditing technique. The bag contains tags each with a different topic printed on (eg, waste skips); participants pass the bag round and select a tag; they are then questioned by the trainer or another participant about that topic as if they were in an audit situation. If the participants are auditing each other, they will be provided with a set of guidelines to keep in mind during the workshop.Virtual auditing - a more practical workshop where participants review photographs of situations/activities relevant to the organisation's operations. They are asked to identify all the good and bad environmental practices that are occurring in the situations. 10 Incident response What should you do when an incident does happen? What should be in a spill kit? When should you call in the experts? When should you inform the Environment Agency or Environmental Health Officer? Workshop option: The participants are provided with some incident scenarios and asked to develop a response to the incident 11 Monitoring and reporting Environmental monitoring programmes and procedures Monitoring and reporting as control measures for environmental consequences Monitoring and environmental 'STOP' card systems - personal and behavioural monitoring and reporting

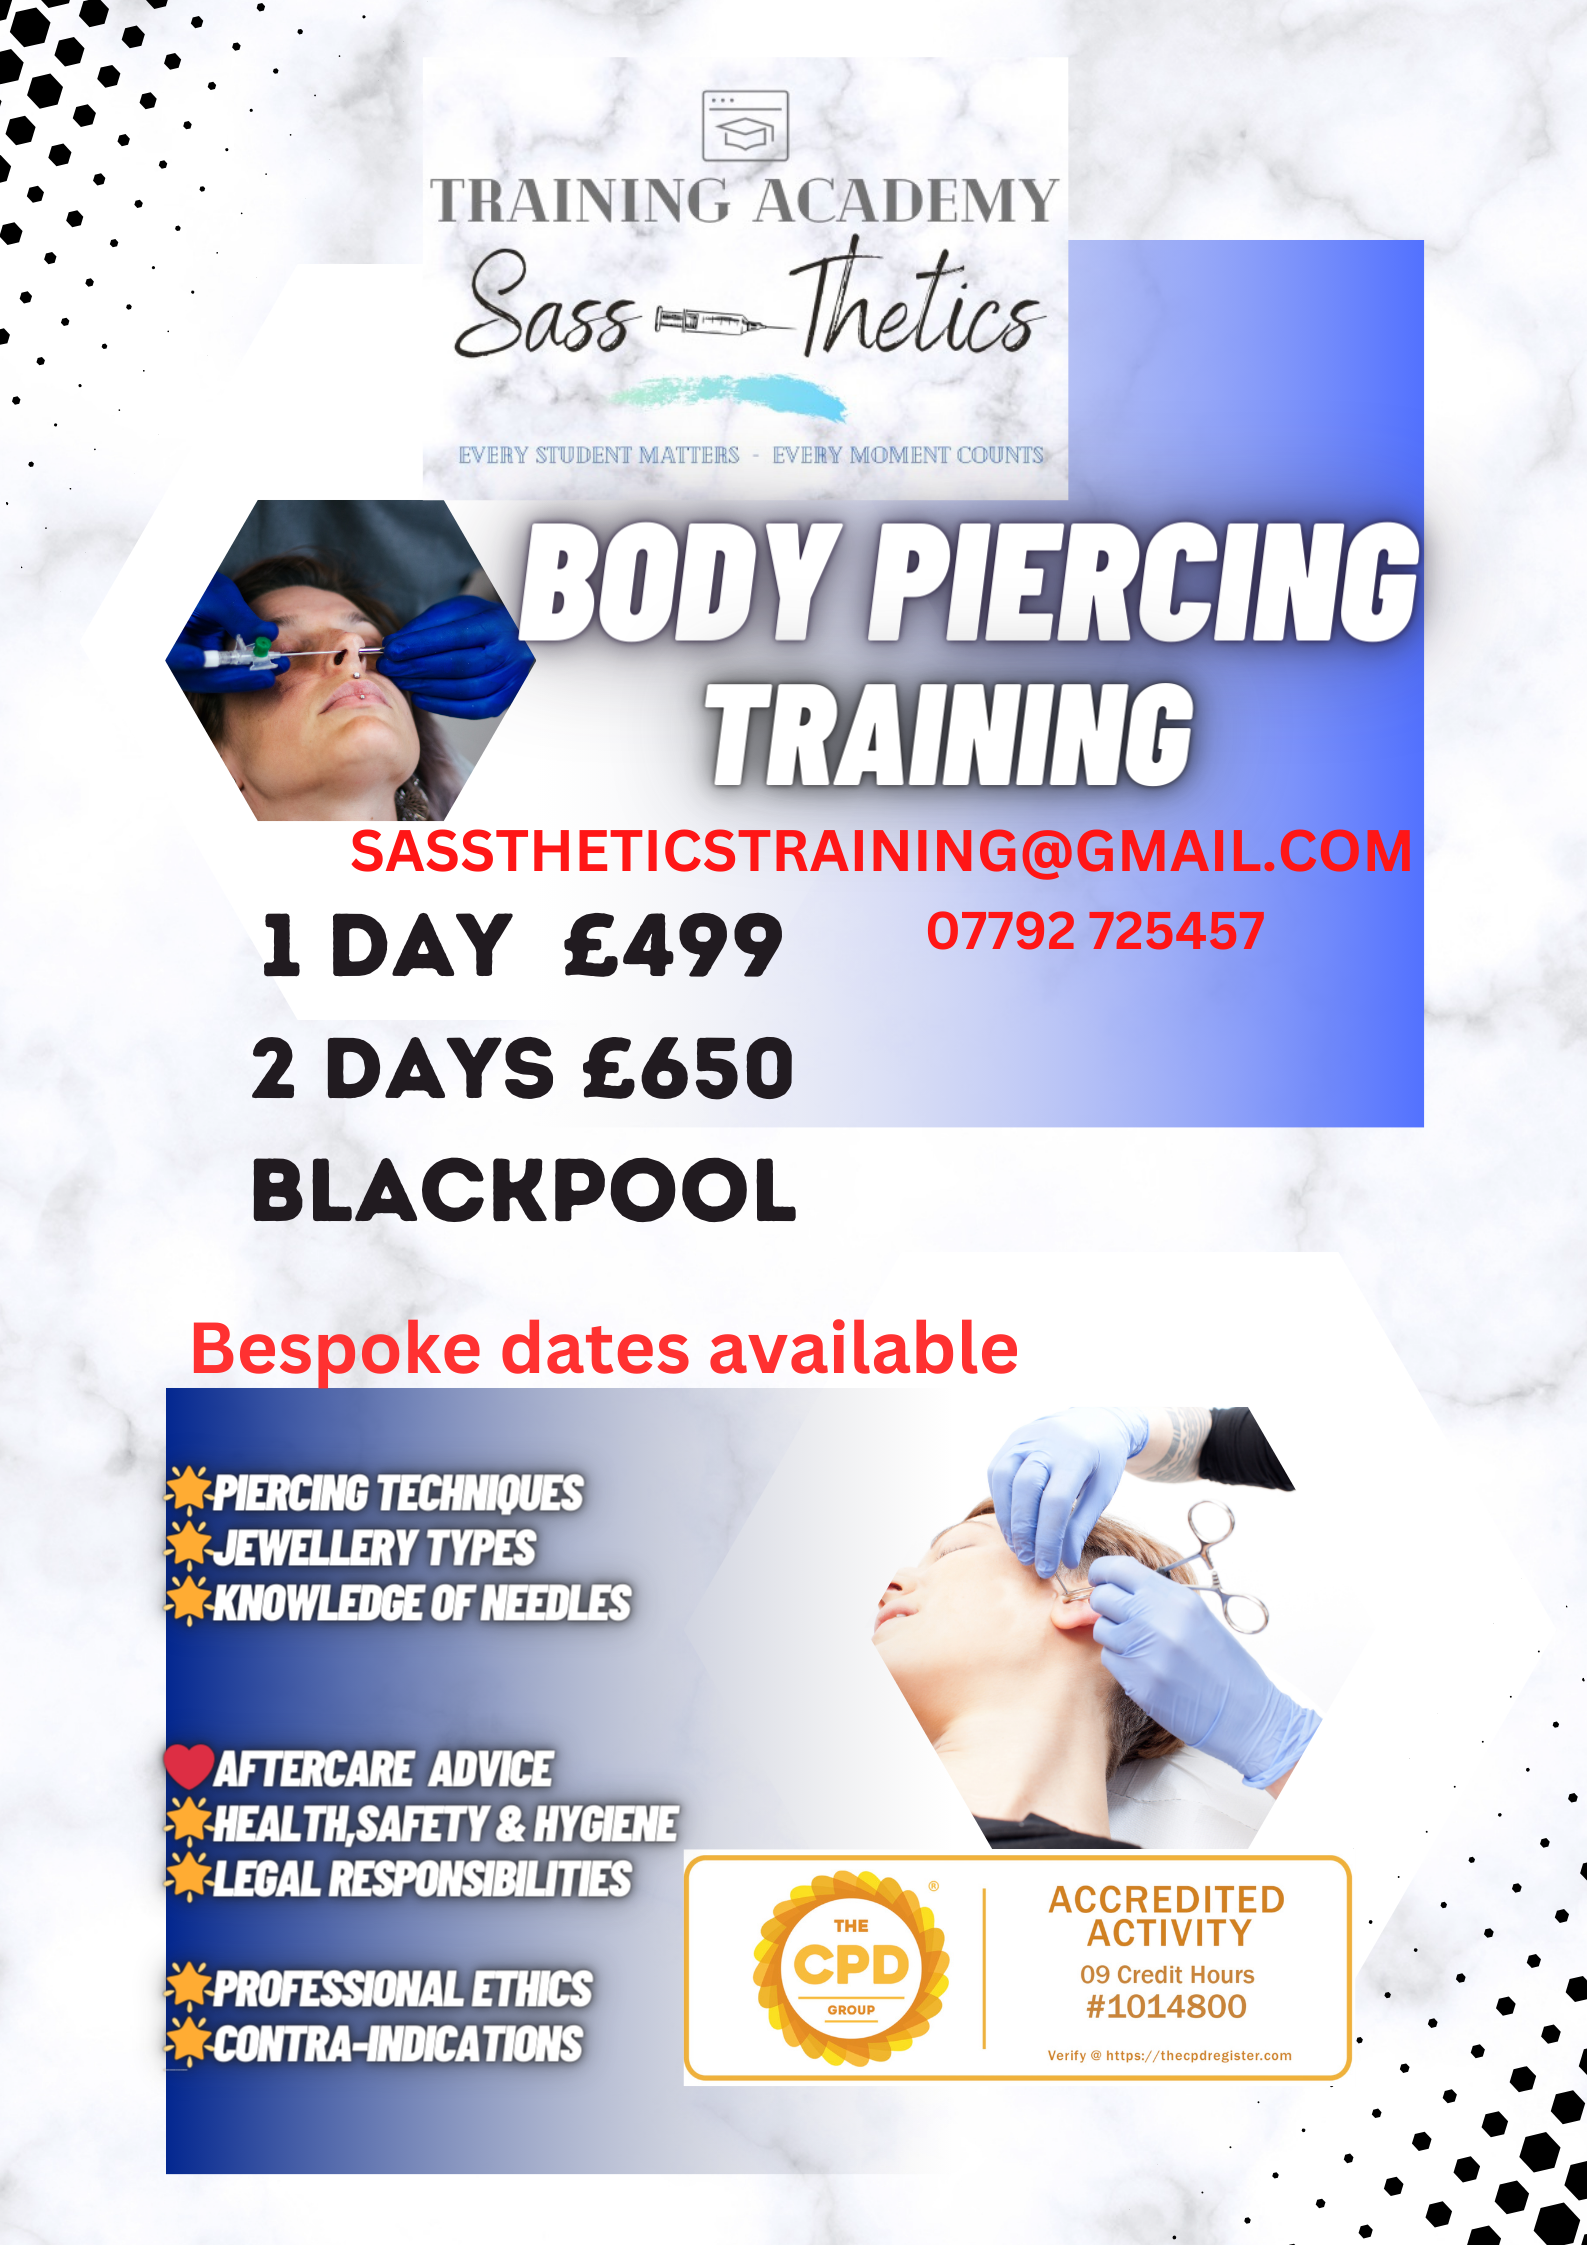
Body Piercing Training Course 1 or 2 Days-choose your own dates .
By Sassthetics Training Academy
One -2- One Body Piercing Training Course . 1 or 2 days depending on the level of mentorship you require. Blackpool based
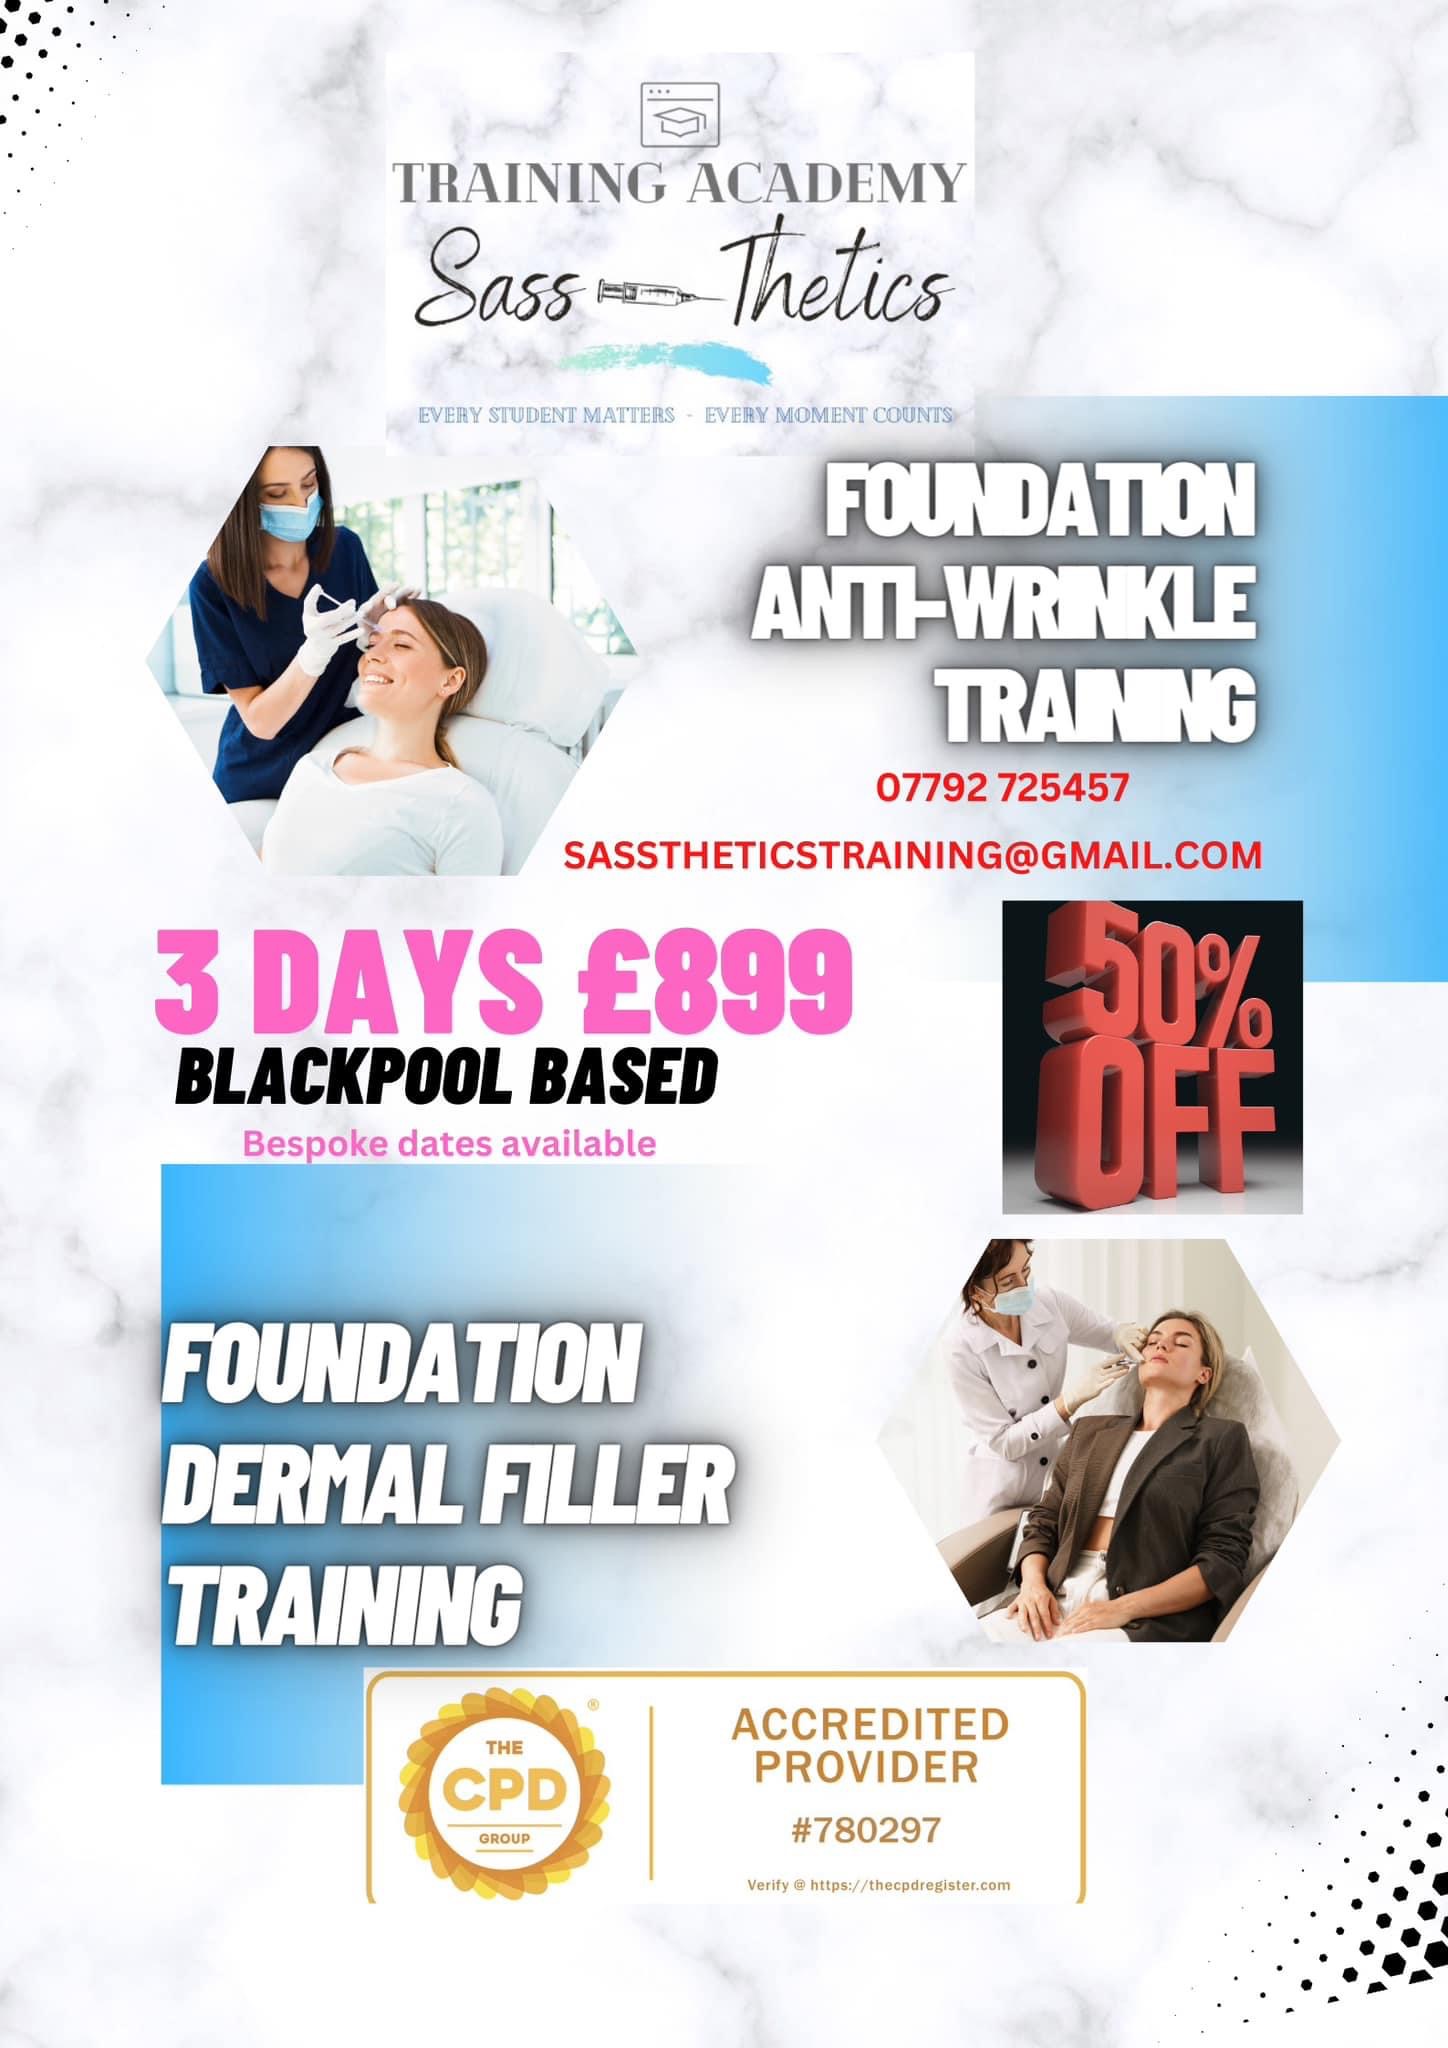
Foundation level Anti Wrinkle and Dermal Fillers Course -Choose your own dates .
By Sassthetics Training Academy
One-2 one training in Aesthetics -Anti Wrinkle and Dermal fillers . Choose your own dates
Deep, melodic, meditative DJ sets and eclectic chill-out sounds.
By Robin Freeman - Sacred Sound Healing
I am a DJ with over 20 years of experience playing for crowds at some of the most well-respected venues, events, and festivals across the globe. I have played DJ sets for crowds of anywhere between a small, intimate group, right up to over 10,000 people at events such as 'Burning Man' in the USA. My styles can either be of a dance tempo involving deep, melodic, trance-inducing beats, which are perfect for any dancefloor space large or small. Or I have many years of experience in selecting the perfect eclectic soundtrack for sunset moments, chill-out spaces, or creating magical background atmospheres within various events and spaces. For all enquiries, please contact me here.

Growth Leadership Programme
By The Power Within Training & Development Ltd
Workplace Innovation Are You A Leader Who Wants To Enhance Your Team’s Accountability, Adaptability, Resilience, And Well-Being? Consider joining our newly launched Growth Leadership Programme: Workplace Innovation, subsided by Scottish Enterprise, which offers a unique approach to leadership development and workplace Innovation, emphasising Motivational Intelligence (MQ). Our programme will help you build on your leadership capabilities and confidence while creating a more innovative, productive, and fair workplace for employee development and growth. Growth Leadership: Workplace Innovation Leading with Motivational Intelligence (MQ) You’ll learn to: Develop MQ leadership skills that encourage fair and innovative workplace practices and inclusive economic growth. Increase engagement, innovation, and productivity among your team. Enhance your strategic decision-making skills. Build a resilient, agile, and change-driven team culture. Identify and integrate organisational values into your workplace culture. Create a successful business that is also a fair place to work. Session Overview Our comprehensive programme, consisting of eight engaging and insightful sessions, is meticulously crafted to provide a world-class education in Leadership, Workplace Innovation and Motivational Intelligence (MQ). We combine some of the most potent, powerful and cutting-edge research in workplace innovation, neuroscience and the most promising discoveries in cognitive and social psychology of the 20th century. 01 Self-Leadership and The Secret to Personal Success Session 1: Self-Leadership and The Secret to Personal Success This comprehensive kick-off session delves into the foundations of self-leadership and personal success. Participants will explore various aspects, from setting course expectations and creating a conducive learning environment to understanding motivational intelligence and managing negative thoughts. Through essential resources like the Leadership Reference Manual and Roadmap Workbook, multi-sensory perception, and spaced repetition learning techniques, participants will solidify their learnings and enhance personal and professional growth. Key Learning Outcomes: Understand the critical role of self-leadership in personal and professional success and the impact of external and internal factors on performance Develop strategies to optimise motivation, communication, and effectiveness within teams and organisations, leveraging diverse learning styles and adult learning techniques Utilise essential resources like the Leadership Reference Manual and Roadmap Workbook for ongoing growth and development while implementing practical tools like the Start, Stop, Continue plan for self-reflection and improvement Explore the power of adaptability, self-awareness, and resilience in navigating through challenging times and maintaining a positive mindset Discover the importance of a positive mental diet, gratitude, and consistent small decisions that compound over time, leading to personal and professional growth 02 The Role of Intelligence in Leadership and Management Session 2: The Role of Intelligence in Leadership and Management It's time to delve into Motivational Intelligence and its role in our personal and professional lives. In this comprehensive and interactive session, participants will explore the multifaceted aspects of intelligence in Leadership and management, focusing on IQ, EQ, and MQ. Participants will learn how to cultivate a growth mindset and motivational intelligence within themselves and their teams, fostering a culture of learning and resilience. The session will also cover the importance of crafting a clear vision for the team or organisation and provide practical strategies for effectively communicating the vision to internal and external stakeholders. Key Learning Outcomes: Understand the roles of IQ, EQ, and MQ in Leadership and management and their impact on individual and team performance Develop strategies to improve your levels of intelligence and foster a growth mindset within individuals and teams Discover the importance of vision in Leadership and management and learn to craft it using the WHERE (performance), HOW (perception), and WHY (purpose) perspectives Gain insights into effectively communicating the vision to stakeholders, ensuring alignment, ownership, and motivation Reflect on the role of a growth mindset and motivational intelligence in achieving the team's vision and fostering a culture of continuous improvement and adaptability 03 The Pillars of Human Performance: Unlocking Potential Session 3: The Pillars of Human Performance: Unlocking Unlimited Potential Discover the keys to unlocking your unlimited potential and becoming a more effective leader in this interactive course. Through engaging discussions and self-reflection, participants will dive deep into unlimited potential, understand its significance in Leadership, and learn to overcome challenges in their teams or businesses. Participants will gain insights into the characteristics of influential leaders, the importance of asking the right questions, and the value of embracing failure as a part of success. With a focus on personal and professional growth, this session will equip you with the tools and techniques to become a better manager and leader. Key Learning Outcomes: Understand the concept of unlimited potential and its importance in Leadership and personal growth Identify personal and team visions, challenges, and the role of asking the right questions in gaining insights Recognise the role of practice and reflection in transforming weaknesses into strengths Explore the characteristics and impact of great leaders and learn how to apply these traits in your leadership style Embrace the importance of failure as a crucial part of success and create a supportive environment for personal and team development 04 Defining Management and Vertical Alignment Session 4: Defining Management and Vertical Alignment In this engaging session, participants will delve into the essential differences between management and Leadership and discover how understanding these distinctions can significantly impact team culture and performance. We'll examine common management mistakes and their effects, uncover the best practices of excellent management, and discuss the development of management skills and the management hierarchy. This interactive session will provide valuable insights and actionable strategies that can be applied to personal and professional life, helping participants become more effective and successful managers and leaders. Key Learning Outcomes: Differentiating between management and Leadership: Gain a deeper understanding of how these concepts differ and their impact on team culture and performance Identifying common management mistakes: Learn about these pitfalls and their consequences on team culture and performance and develop strategies to avoid them Mastering the best practices of excellent management: Discover the five essential techniques to help you become a more effective manager Developing management skills and understanding the management hierarchy: Enhance your ability to grow as a leader and manager Embracing Ultimate Responsibility: Learn the importance of taking ownership and responsibility for your and your team's success and understand the role of motivational intelligence in achieving this 05 Workplace Innovation and High-Payoff Activities Session 5: Workplace Innovation and High-Payoff Activities n (Job Crafting) This session provides a comprehensive overview of the critical principles of workplace innovation, job crafting, people leadership, and coaching in the workplace. Participants will learn about job crafting, our MQ workplace innovation process, and the crucial role of Leadership in managing and monitoring performance in the workplace. By adopting a proactive and creative approach to their work, individuals can improve their job satisfaction, contribute to their organisation's success, and drive economic health for the nation. Key Learning Outcomes: Understanding of Leadership in the job crafting innovative process Skills in job crafting and workplace innovation Knowledge of the critical role of Leadership in performance management Techniques for effective coaching and positive feedback, through trust and mutual respect in the workplace Helping individuals reflect on their role in the success of the team and company and developing a written plan to achieve their goals 06 Defining and Exploring Leadership Session 6: Defining and Exploring Leadership In this session, we will define and explore the essence of Leadership, dispelling the myths and providing a definition that will guide you through the course. We will also explore the three-tier hierarchy of success and how leaders can influence MQ (motivational intelligence) by doing five things consistently. As a manager or leader, you may have found that your team's success is not guaranteed even with the best plans, processes, and strategies. This is because not all team members will adopt new ideas or changes unless they first believe they can achieve the desired outcome. Key Learning Outcomes: Understanding the essence of Leadership to provide an in-depth understanding of the essence of successful Leadership, dispelling the myths and providing a definition that will guide you through the course Psychology of your team: Leaders understand that to achieve their goals, they need to focus on the psychology of their team Power of questions in Leadership: Leaders can gain insight into the minds of their team members and unlock the key to motivating and developing them by asking the right questions Explore the three-tier hierarchy of success and the importance of each level in determining a person's likelihood of success Five things great leaders do each day to influence a culture of responsibility, consistently build esteem and confidence, and always work on coaching and mentoring employees 07 Building a Leadership Toolbox Session 7: Building a Leadership Toolbox: Trust & Inspiration Fostering Adaptability, Responsibility, Resilience, and Courage, this step focuses on leaders' tools and techniques to promote greater team accountability and ownership. It starts to delve into the critical role of self-esteem in a person's motivational intelligence and adaptability. We also explore how self-esteem is formed and influences a person's interpretation of feedback. We also look at self-esteem's critical role in a person's motivational intelligence and adaptability, examining how self-esteem is formed and influences a person's interpretation of feedback. Key Learning Outcomes: Understanding the tools and techniques leaders can use to foster greater team accountability and ownership Delving into the critical role of self-esteem in a person's motivational intelligence and adaptability Exploring how self-esteem is formed and influences a person's interpretation of feedback Examining the levels of self-esteem and associated behaviours of each group Understanding the influence of comfort zones and tools leaders can use to help people overcome the fear of change 08 Developing a Healthy Perspective and Resilient Attitude Session 8: Developing a Healthy Perspective and Resilient Attitude This step explores how developing a healthy perspective and resilient attitude is crucial for success as a leader. In this session, we will explore the critical role of self-reflection in building motivation and adaptability. We will examine how self-esteem is formed and how it influences a person's interpretation of feedback. We will also delve into the levels of self-esteem and the associated behaviours of each class. We will provide practical strategies for cultivating resilience and adaptability in facing challenges and setbacks. Through reflection and analysis of your moments of surprise, frustration, and failure, you will develop a growth mindset that fosters continuous learning and improvement. Key Learning Outcomes: The critical role of self-reflection in building motivation and adaptability How self-esteem is formed and influences a person's interpretation of feedback The levels of self-esteem and the associated behaviours of each class Strategies for cultivating resilience and adaptability in the face of challenges and setbacks The influence of affirmations and tools leaders can use to help people overcome the fear of change

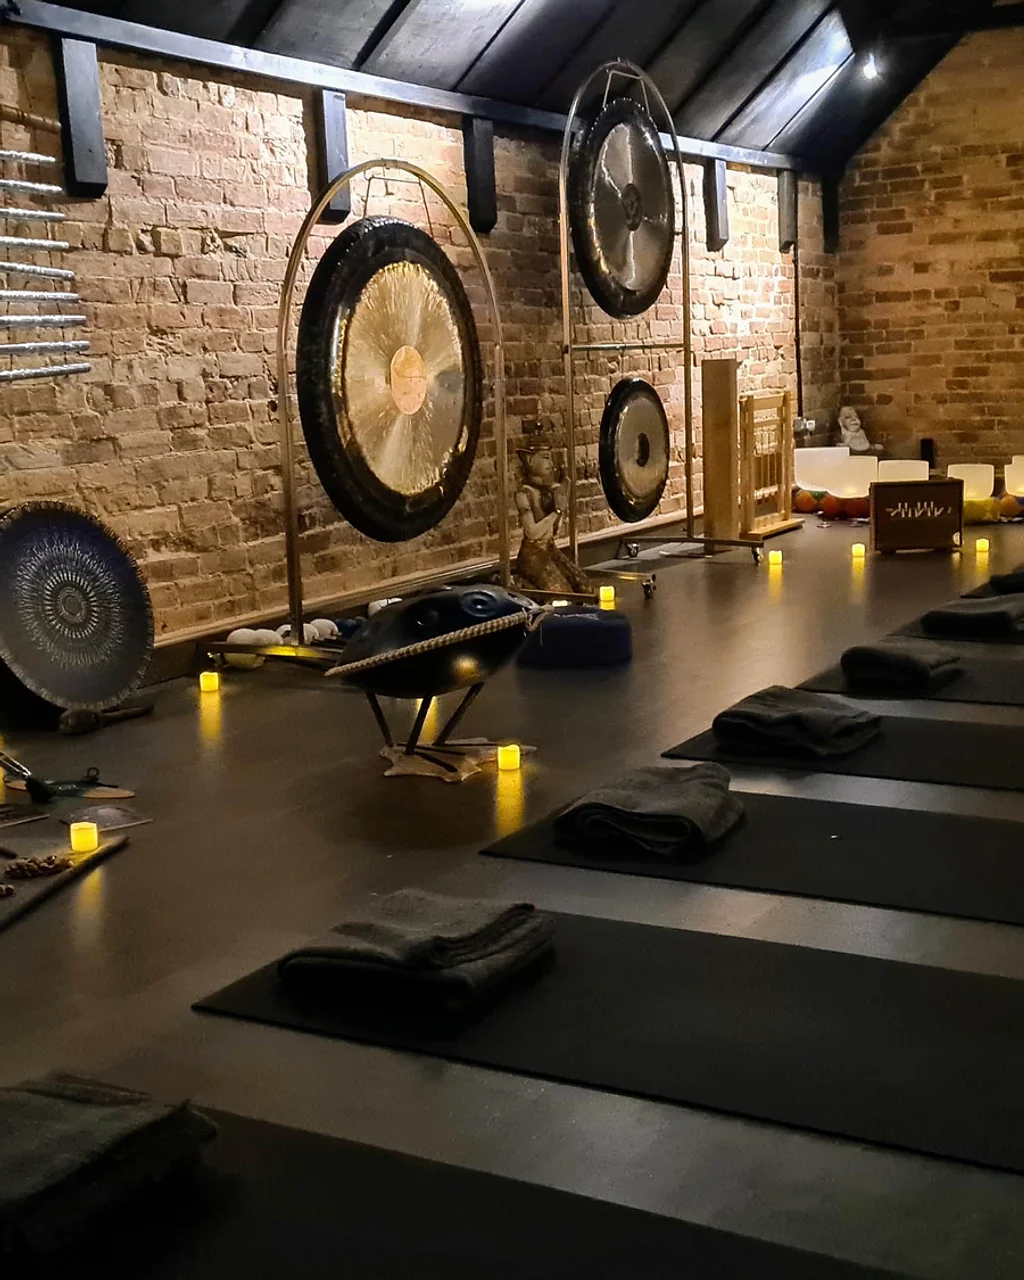
Weekly group sound journey & gong baths in Dorset (UK) – Everyone welcome.
By Robin Freeman - Sacred Sound Healing
I hold sound journey & gong bath sessions every week in both Bournemouth and Southbourne (on the South coast, Dorset, uk). Everyone is welcome at these events which take place on Friday evenings and Sunday evenings from 7.30 pm – 9 pm. Advance booking is required as these are very popular and are almost always fully booked. You can find out more about these and book your space to join us here
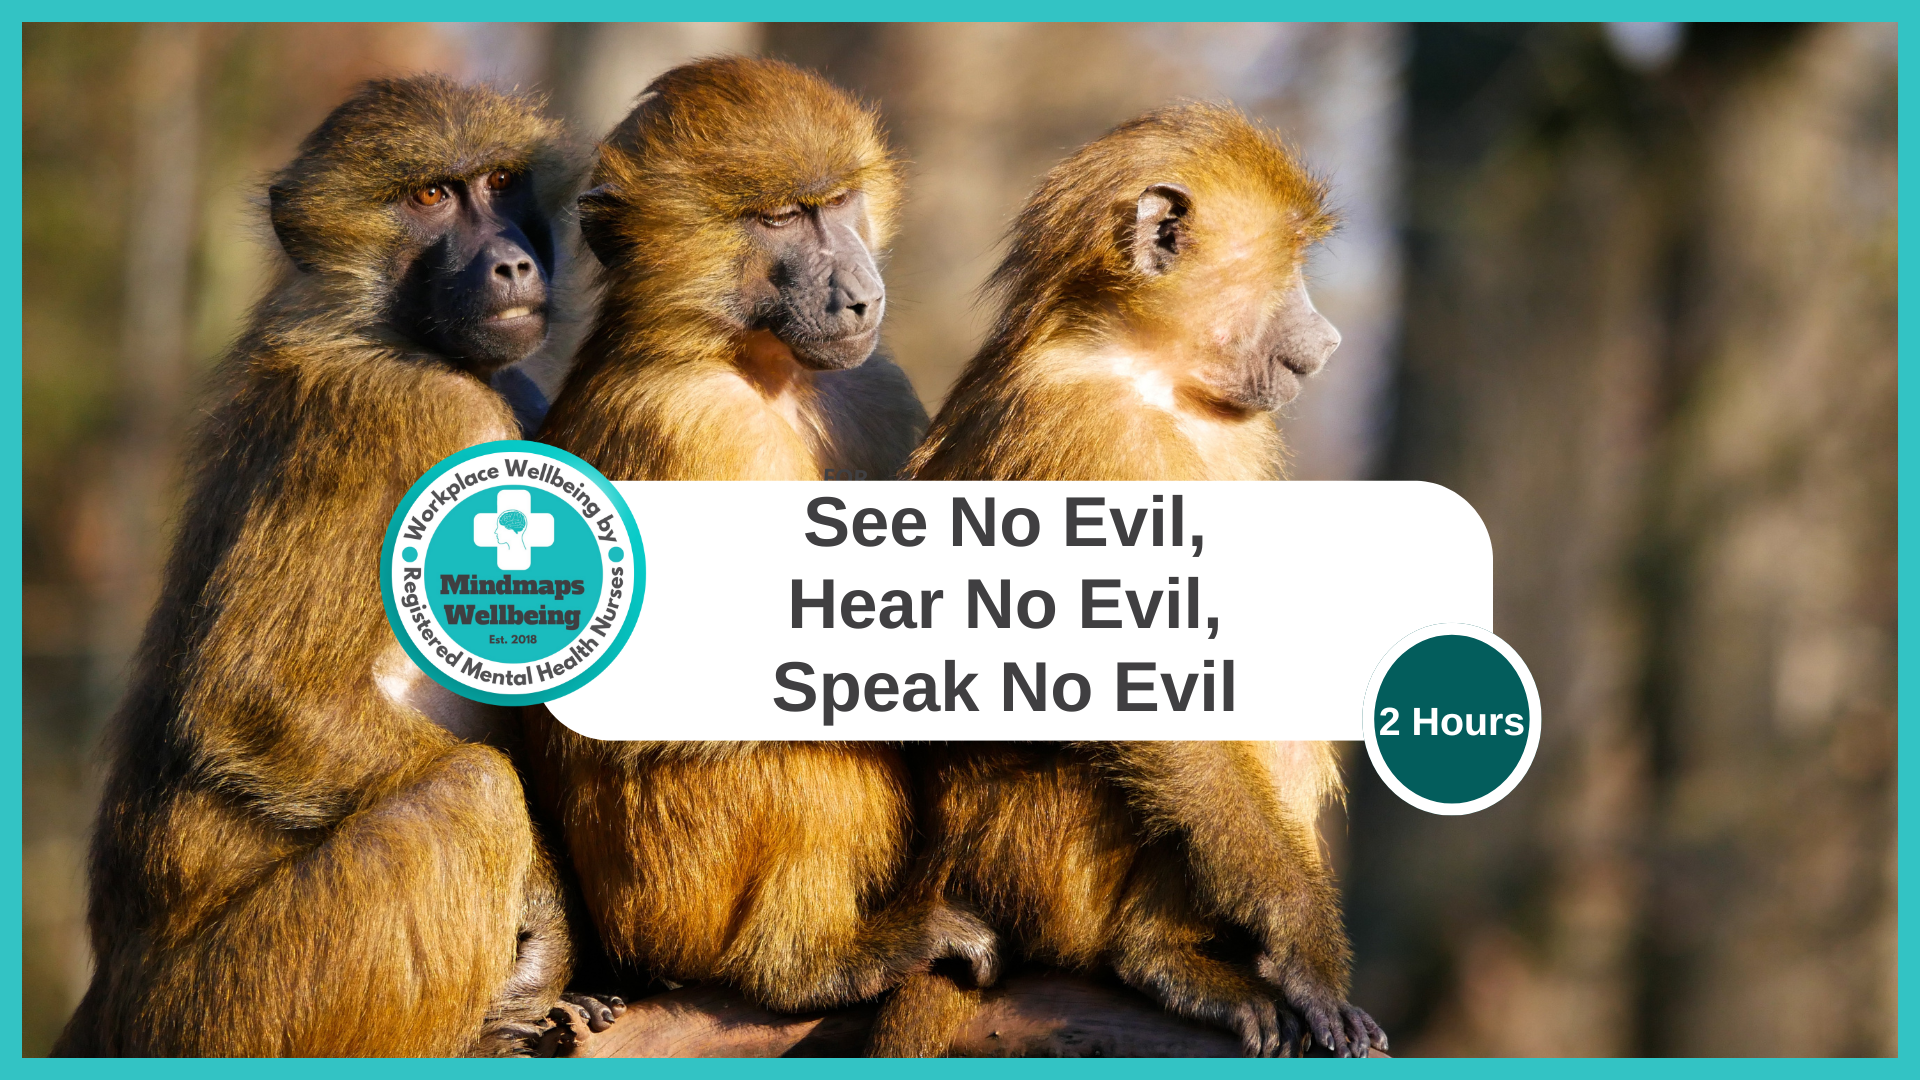
See No Evil, Hear No Evil, Speak No Evil. Groups for up to 20 learners per workshop.
By Mindmaps Wellbeing
See No Evil, Hear No Evil, Speak No Evil Psychosis Information coming soon - watch this space! Workshop outline: Details coming soon - watch this space! 2-hour workshop packages At Mindmaps Wellbeing, we know that every business is unique, and no team is the same. That’s why we’ve developed our range of short, specialist wellbeing and mental health themed workshops—a fully flexible approach to workplace training. With our selection of engaging and impactful 2-hour workshops, you can build a programme that truly meets your organisation’s needs. Whether you’re looking to manage stress, challenge stigma, or avoid burnout, you choose the sessions that suit your team best. Our training courses and workshop collection Book multiple workshops on the same day to save Why Mindmaps Wellbeing? Mindmaps Wellbeing is the trusted training provider for businesses looking to enhance workplace mental health and employee wellbeing. Our training is designed and delivered by registered Mental Health Nurses, ensuring credibility, expertise, and real-world application. Focus on culture change – Our training goes beyond theory transfer, aiming to embed lasting behavioural shifts that foster a positive, mentally healthy workplace Flexible delivery options – We offer in-person, online, and hybrid training solutions to fit your organisation’s needs Proven impact and measurable results – Our training leads to improved employee engagement, productivity, and retention Engaging and actionable – All our courses include interactive activities, case studies, and real-world applications for immediate impact Contact us for more information.
Living On The Edge. Groups for up to 20 learners per workshop.
By Mindmaps Wellbeing
Living On The Edge Risk Taking Behaviour Information coming soon: watch this space! Workshop outline: Details coming soon: watch this space! 2-hour workshop packages At Mindmaps Wellbeing, we know that every business is unique, and no team is the same. That’s why we’ve developed our range of short, specialist wellbeing and mental health themed workshops—a fully flexible approach to workplace training. With our selection of engaging and impactful 2-hour workshops, you can build a programme that truly meets your organisation’s needs. Whether you’re looking to manage stress, challenge stigma, or avoid burnout, you choose the sessions that suit your team best. Our training courses and workshop collection Book multiple workshops on the same day to save Why Mindmaps Wellbeing? Mindmaps Wellbeing is the trusted training provider for businesses looking to enhance workplace mental health and employee wellbeing. Our training is designed and delivered by registered Mental Health Nurses, ensuring credibility, expertise, and real-world application. Focus on culture change – Our training goes beyond theory transfer, aiming to embed lasting behavioural shifts that foster a positive, mentally healthy workplace Flexible delivery options – We offer in-person, online, and hybrid training solutions to fit your organisation’s needs Proven impact and measurable results – Our training leads to improved employee engagement, productivity, and retention Engaging and actionable – All our courses include interactive activities, case studies, and real-world applications for immediate impact Contact us for more information.

I Can Cope, Society Can't Groups for up to 20 learners per workshop.
By Mindmaps Wellbeing
I Can Cope, Society Can't Information coming soon - watch this space! Workshop outline: Details coming soon - watch this space! 2-hour workshop packages At Mindmaps Wellbeing, we know that every business is unique, and no team is the same. That’s why we’ve developed our range of short, specialist wellbeing and mental health themed workshops—a fully flexible approach to workplace training. With our selection of engaging and impactful 2-hour workshops, you can build a programme that truly meets your organisation’s needs. Whether you’re looking to manage stress, challenge stigma, or avoid burnout, you choose the sessions that suit your team best. Our training courses and workshop collection Book multiple workshops on the same day to save Why Mindmaps Wellbeing? Mindmaps Wellbeing is the trusted training provider for businesses looking to enhance workplace mental health and employee wellbeing. Our training is designed and delivered by registered Mental Health Nurses, ensuring credibility, expertise, and real-world application. Focus on culture change – Our training goes beyond theory transfer, aiming to embed lasting behavioural shifts that foster a positive, mentally healthy workplace Flexible delivery options – We offer in-person, online, and hybrid training solutions to fit your organisation’s needs Proven impact and measurable results – Our training leads to improved employee engagement, productivity, and retention Engaging and actionable – All our courses include interactive activities, case studies, and real-world applications for immediate impact Contact us for more information.

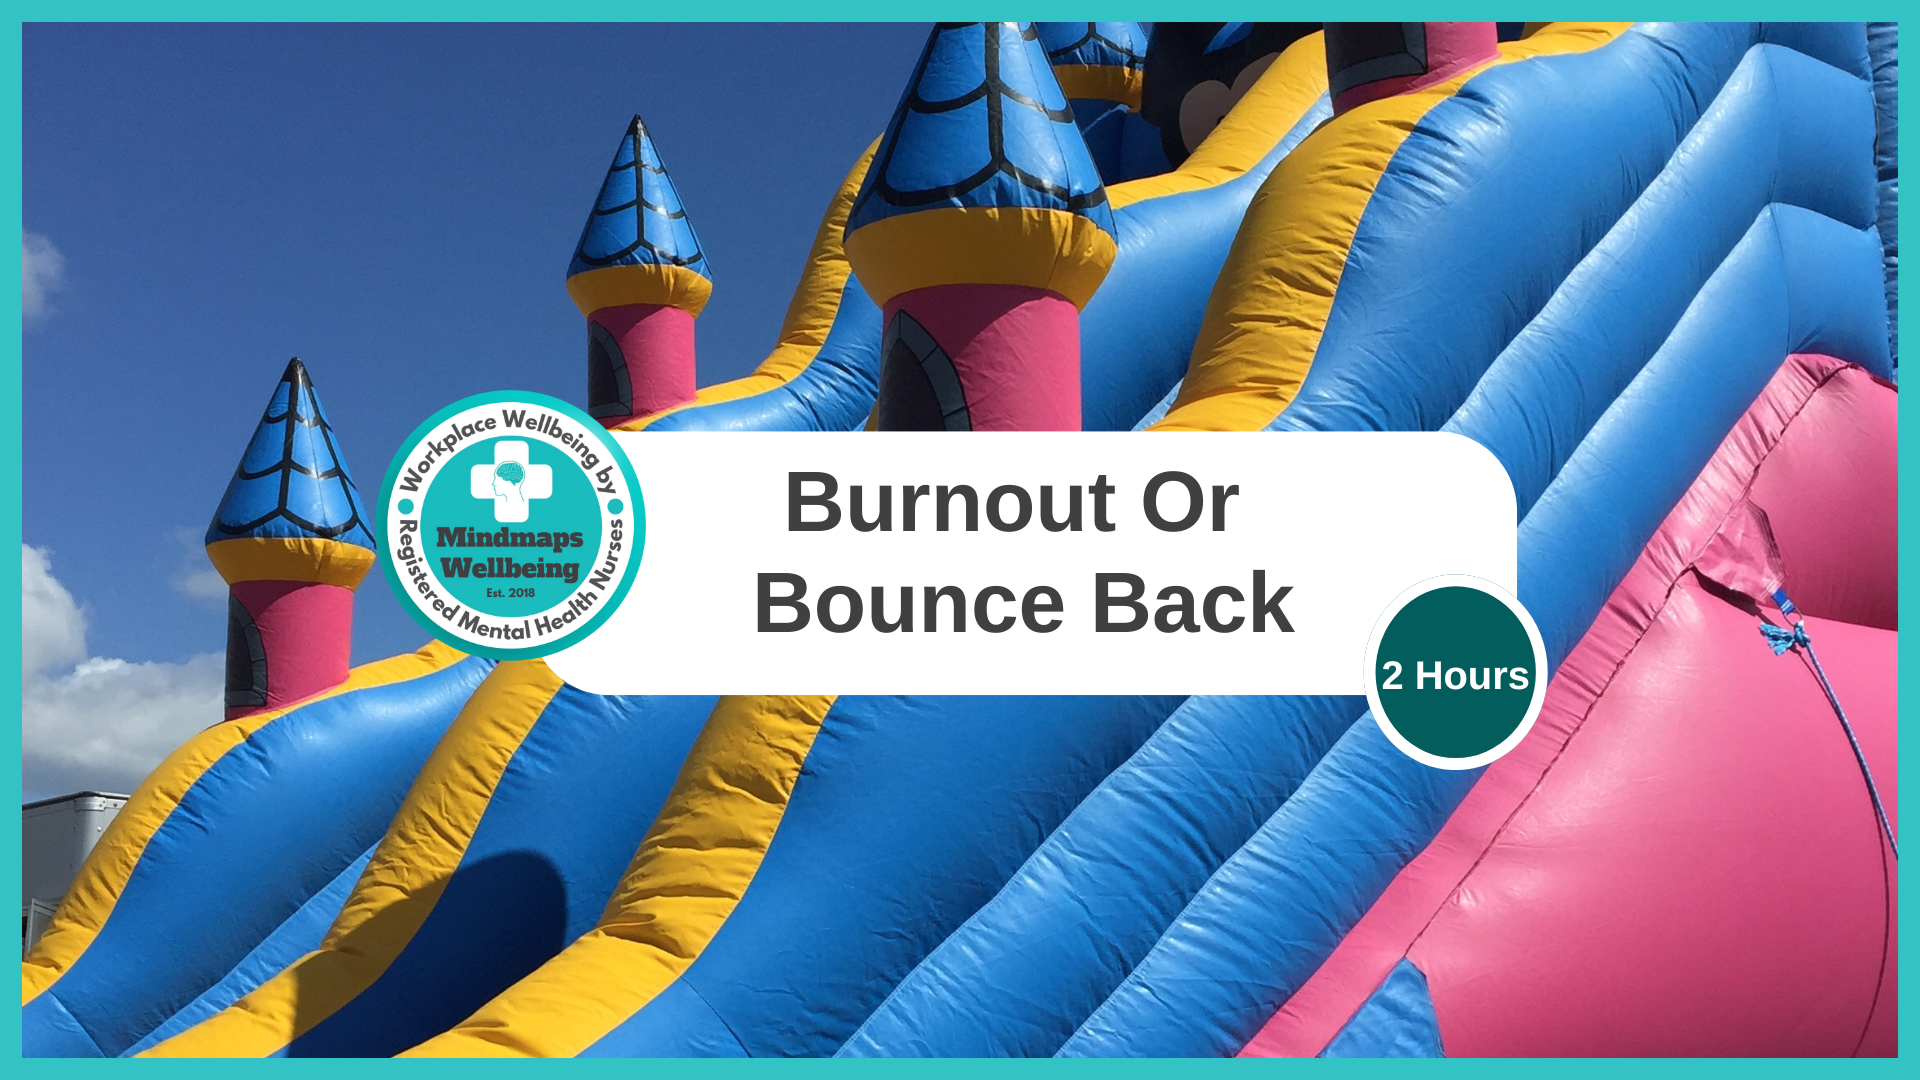
Burnout or Bounce Back. Groups for up to 20 learners per workshop.
By Mindmaps Wellbeing
Burnout or Bounce Back Information coming soon: watch this space! Workshop outline: Details coming soon: watch this space! 2-hour workshop packages At Mindmaps Wellbeing, we know that every business is unique, and no team is the same. That’s why we’ve developed our range of short, specialist wellbeing and mental health themed workshops—a fully flexible approach to workplace training. With our selection of engaging and impactful 2-hour workshops, you can build a programme that truly meets your organisation’s needs. Whether you’re looking to manage stress, challenge stigma, or avoid burnout, you choose the sessions that suit your team best. Our training courses and workshop collection Book multiple workshops on the same day to save Why Mindmaps Wellbeing? Mindmaps Wellbeing is the trusted training provider for businesses looking to enhance workplace mental health and employee wellbeing. Our training is designed and delivered by registered Mental Health Nurses, ensuring credibility, expertise, and real-world application. Focus on culture change – Our training goes beyond theory transfer, aiming to embed lasting behavioural shifts that foster a positive, mentally healthy workplace Flexible delivery options – We offer in-person, online, and hybrid training solutions to fit your organisation’s needs Proven impact and measurable results – Our training leads to improved employee engagement, productivity, and retention Engaging and actionable – All our courses include interactive activities, case studies, and real-world applications for immediate impact Contact us for more information.