- Professional Development
- Medicine & Nursing
- Arts & Crafts
- Health & Wellbeing
- Personal Development
8119 Insights courses in Nottingham delivered Online
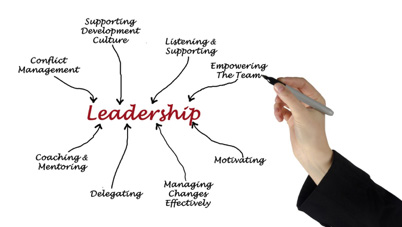
Overview This course is a rare opportunity to acquire important leadership skills and use those newfound skills to gain the respect of co-workers and those you supervise. It's filled with insights into the special and often-overlooked talents women leaders can bring to the table and cutting-edge tactics successful women leaders are using right now to make things happen in their organizations.
Certified Data Science Practitioner
By Mpi Learning - Professional Learning And Development Provider
This course will enable you to bring value to the business by putting data science concepts into practice. Data is crucial for understanding where the business is and where it's headed. Not only can data reveal insights, but it can also inform - by guiding decisions and influencing day-to-day operations.

Virtual November Alchemy 2025
By CRR UK
CRRUK equips professionals with the concepts, skills and tools to build conscious, intentional relationships, and to coach relationship systems of any size.

Overview Effective decision-making requires the adoption of decision approaches that fit the complexities of these situations and the efficient management of decision-making processes. It also requires the ability to think strategically in highly interactive markets and acute insights into the psychology behind people's behaviour. Objectives Develop critical thinking skills, sharpening your intuition in the face of risk and uncertainty Learn ways to discover, manage, mitigate and avoid decision-making traps Learn to leverage the power of 'nudges' - a light-touch way to influence human behaviour and improve decision-making Boost your ability to build high-performing teams by understanding what conditions enable teams to make better decisions than individuals Become a more strategic leader and decision-maker by understanding the long-term impact your decisions can have on your organisation

Leadership Professional - Essentials Programme
By Mpi Learning - Professional Learning And Development Provider
Five half-day Leadership modules with mini work placed projects to bring the learning into action in the workplace.

Data Analysis and Visualization with Microsoft Excel
By Nexus Human
Duration 2 Days 12 CPD hours This course is intended for This course is designed for students who already have foundational knowledge and skills in Excel and who wish to perform robust and advanced data and statistical analysis with Microsoft Excel using PivotTables, use tools such as Power Pivot and the Data Analysis ToolPak to analyze data, and visualize data and insights using advanced visualizations in charts and dashboards in Excel. To ensure success, you should have baseline skill using Microsoft Excel worksheets, particularly in creating workbooks with formulas and function Overview #NAME? Analyzing data to find issues, insights and opportunities, is now a critical part of many job roles. Beyond the analysis, data analysts in all job roles must be able to effectively present and communicate their findings in visually compelling ways. Microsoft© Excel© is designed for this purpose. Excel can connect to a wide range of data sources, perform robust data analysis and create diverse and robust data-backed visualizations to show insights, trends, and create reports. These capabilities enable people who use Excel for data analysis to turn data into thoughtful action. 1 - DATA ANALYSIS FUNDAMENTALS Introduction to Data Science Create and Modify Tables Sort and Filter Data 2 - VISUALIZING DATA WITH EXCEL Visualize Data with Charts Modify and Format Charts Apply Best Practices in Chart Design 3 - ANALYZING DATA WITH FORMULAS AND FUNCTIONS Analyze Data with Formulas and Named Ranges Analyze Data with Functions Implement Data Validation, Forms, and Controls Create Conditional Visualizations with Lookup Functions 4 - ANALYZING DATA WITH PIVOTTABLES Create a PivotTable Analyze PivotTable Data 5 - PRESENTING VISUAL INSIGHTS WITH DASHBOARDS IN EXCEL Visualize Data with PivotCharts Filter Data Using Slicers and Timelines Create a Dashboard in Excel 6 - CREATING GEOSPATIAL VISUALIZATIONS WITH EXCEL Create Map Charts in Excel Customize Map Charts in Excel 7 - PERFORMING STATISTICAL ANALYSIS Visualize Trendlines and Sparklines with Excel Analyze Data with the Data Analysis ToolPa 8 - GETTING AND TRANSFORMING DATA Connect to Data with Queries Clean and Combine Data Shape and Transform Data 9 - MODELING AND ANALYZING DATA WITH POWER PIVOT Install Power Pivot in Excel Create Data Models with Power Pivot Create Power Pivots Perform Advanced Data Analysis and Visualization 10 - PRESENTING INSIGHTS WITH REPORTS (OPTIONAL) Plan a Report Create a Report

Tableau Desktop - Part 1
By Nexus Human
Duration 2 Days 12 CPD hours Overview Identify and configure basic functions of Tableau. Connect to data sources, import data into Tableau, and save Tableau files Create views and customize data in visualizations. Manage, sort, and group data. Save and share data sources and workbooks. Filter data in views. Customize visualizations with annotations, highlights, and advanced features. Create and enhance dashboards in Tableau. Create and enhance stories in Tableau As technology progresses and becomes more interwoven with our businesses and lives, more and more data is collected about business and personal activities. This era of "big data" has exploded due to the rise of cloud computing, which provides an abundance of computational power and storage, allowing organizations of all sorts to capture and store data. Leveraging that data effectively can provide timely insights and competitive advantage. The creation of data-backed visualizations is a key way data scientists, or any professional, can explore, analyze, and report insights and trends from data. Tableau© software is designed for this purpose. Tableau was built to connect to a wide range of data sources and allows users to quickly create visualizations of connected data to gain insights, show trends, and create reports. Tableau's data connection capabilities and visualization features go far beyond those that can be found in spreadsheets, allowing users to create compelling and interactive worksheets, dashboards, and stories that bring data to life and turn data into thoughtful action. Prerequisites To ensure your success in this course, you should have experience managing data with Microsoft© Excel© or Google Sheets?. Lesson 1: Tableau Fundamentals Topic A: Overview of Tableau Topic B: Navigate and Configure Tableau Lesson 2: Connecting to and Preparing Data Topic A: Connect to Data Topic B: Build a Data Model Topic C: Save Workbook Files Topic D: Prepare Data for Analysis Lesson 3: Exploring Data Topic A: Create Views Topic B: Customize Data in Visualizations Lesson 4: Managing, Sorting, and Grouping Data Topic A: Adjust Fields Topic B: Sort Data Topic C: Group Data Lesson 5: Saving, Publishing, and Sharing Data Topic A: Save Data Sources Topic B: Publish Data Sources and Visualizations Topic C: Share Workbooks for Collaboration Lesson 6: Filtering Data Topic A: Configure Worksheet Filters Topic B: Apply Advanced Filter Options Topic C: Create Interactive Filters Lesson 7: Customizing Visualizations Topic A: Format and Annotate Views Topic B: Emphasize Data in Visualizations Topic C: Create Animated Workbooks Topic D: Best Practices for Visual Design Lesson 8: Creating Dashboards in Tableau Topic A: Create Dashboards Topic B: Enhance Dashboards with Actions Topic C: Create Mobile Dashboards Lesson 9: Creating Stories in Tableau Topic A: Create Stories Topic B: Enhance Stories with Tooltips
Mastering Market Insights: A Comprehensive Course on Market Research
By Xpert Learning
About Course Unlock key insights with our comprehensive guide to market research - propel your business towards unprecedented growth Our immersive online course on Market Research provides a comprehensive exploration into the intricate art and science of understanding consumer behaviour, trends, and market dynamics. Do you want to grow your business and take it to new heights? Achieving sustainable growth requires a deep understanding of your target audience and a keen awareness of industry trends. This marketing course equips you with the knowledge and skills required to understand your target customers and their needs. We start with a brief history and definition of 'market research' before we lay out the six steps of the market research process. This course examines the classifications of market research and explains how to identify research problems to set up the market research process. We show you how to develop and design a market research approach. We also trace the relationship between market problems and research design by distinguishing between exploratory, descriptive and causal research. The course goes over data analysis techniques and discusses how to deliver effective presentations of research findings to facilitate analysis and discussion. We cover qualitative and quantitative market research methods and provide examples to help you with questionnaire design with examples of open- and closed-end questions. We demonstrate data analysis techniques to help you leverage your research findings to make better business decisions. Finally, the course explains how to communicate research results while adhering to market research ethics. This course has no prerequisites and suits anyone interested in business and marketing. It is particularly useful for small business owners, entrepreneurs and marketers and helps you to create focused marketing campaigns that connect with your audience to boost customer engagement, brand loyalty and business success. Sign up to learn how to conduct market research that lets you understand consumer behaviour, spot gaps in the market and grow your business. Whether you're a budding marketer, a business owner, or a student of the commerce field, this course offers a comprehensive and practical guide to mastering market research. Enroll now to gain the knowledge and skills that can help shape business strategies, influence product development, and drive business success. What Will You Learn? Discuss the importance of market research in supporting marketing decision-making Identify the factors that influence the decision to conduct market research Outline the key components of a market research proposal Discuss the significance of problem identification in marketing research Analyse the key characteristics and advantages of qualitative research Recognise the factors that affect the sample size and accuracy in quantitative research Identify the key components and goals of a questionnaire Explain the importance of data validation and quality control Summarise the significance of the report and presentation as key components of marketing research Discuss the ethical principles of research methodology and the importance of integrity in market research Course Content Introduction to Market Research Introduction to Market Research The Market Research Process The Market Research Process Market Research Design Market Research Design Defining the Problem & Developing Research Approach Defining the Problem & Developing Research Approach Qualitative Market Research Qualitative Market Research Quantitative Market Research Quantitative Market Research Questionnaire Design Questionnaire Design Data Analysis Data Analysis Communicating Research Results Communicating Research Results Research Ethics Research Ethics Conclusion Conclusion A course by Xpert Learning Audience Marketers Current and aspiring product managers Business executives Consultants Entrepreneurs

Tableau for Data-Driven Decision Makers
By Nexus Human
Duration 1 Days 6 CPD hours This course is intended for This course is designed for professionals in a variety of job roles who receive Tableau data visualizations from data analysts or from data visualization engineers. These data report recipients want to take advantage of the many Tableau features and capabilities that enable them to explore the data behind the initial analysis, perform additional analysis to ask next-level questions of the data, and to customize visualizations and dashboards to share new insights and create compelling reports. Overview Explore Tableau reports. Analyze data to get answers and insights. Sort and group data for analysis and reporting. Filter views. Prepare reports. Troubleshoot, collaborate, and share views and analysis As data acquisition, access, analysis, and reporting are interwoven with our businesses and lives, more and more data is collected about business and personal activities. This abundance of data and the computing power to analyze it has increased the use of data analysis and data visualization across a broad range of job roles. Decision makers of all types, including managers and executives, must interact with, interpret, and develop reports based on data and analysis provided to them. Tableau© software is designed for data analysis and the creation of visualizations. Data analysts prepare data, perform initial analysis, and create visualizations that are then passed on to business data-driven decision makers. These decision makers can use Tableau's tools to explore the data, perform further analysis to find new insights, make decisions, and create customized reports to share their findings. Prerequisites To ensure your success in this course, you should have experience managing data with Microsoft© Excel© or Google Sheets? Lesson 1: Exploring Tableau Reports Topic A: Data Analysis Workflow with Tableau Topic B: Explore Views Topic C: Edit Workbooks Lesson 2: Analyzing Data to Get Answers and Insights Topic A: Configure Marks with the Marks Card Topic B: Ask New Questions by Changing Aggregation Topic C: Find Answers with Calculations Topic D: Answer Questions with Table Calculations Lesson 3: Sorting and Grouping Data for Analysis and Reporting Topic A: Sort Data Topic B: Group Data Lesson 4: Filtering Views Topic A: Filter Data to Refine Analysis Topic B: Create Interactive Filters for Reports Lesson 5: Preparing Reports Topic A: Format and Annotate Views to Tell Your Story Topic B: Emphasize Data in Reports Topic C: Animate Visualizations for Clarity Lesson 6: Troubleshooting, Sharing, and Collaborating Topic A: Troubleshoot Data Issues Topic B: Collaborate in Tableau Online Topic C: Collaborate with Non-Tableau Users
MS-102T00 Microsoft 365 Administrator Essentials
By Nexus Human
Duration 5 Days 30 CPD hours This course is intended for This course is designed for persons aspiring to the Microsoft 365 Administrator role and have completed at least one of the Microsoft 365 role-based administrator certification paths. This course covers the following key elements of Microsoft 365 administration: Microsoft 365 tenant management, Microsoft 365 identity synchronization, and Microsoft 365 security and compliance. In Microsoft 365 tenant management, you learn how to configure your Microsoft 365 tenant, including your organizational profile, tenant subscription options, component services, user accounts and licenses, security groups, and administrative roles. You then transition to configuring Microsoft 365, with a primary focus on configuring Office client connectivity. Finally, you explore how to manage user-driven client installations of Microsoft 365 Apps for enterprise deployments. The course then transitions to an in-depth examination of Microsoft 365 identity synchronization, with a focus on Microsoft Entra Connect and Connect Cloud Sync. You learn how to plan for and implement each of these directory synchronization options, how to manage synchronized identities, and how to implement password management in Microsoft 365 using multifactor authentication and self-service password management. In Microsoft 365 security management, you begin examining the common types of threat vectors and data breaches facing organizations today. You then learn how Microsoft 365?s security solutions address each of these threats. You are introduced to the Microsoft Secure Score, as well as to Microsoft Entra ID Protection. You then learn how to manage the Microsoft 365 security services, including Exchange Online Protection, Safe Attachments, and Safe Links. Finally, you are introduced to the various reports that monitor an organization?s security health. You then transition from security services to threat intelligence; specifically, using Microsoft 365 Defender, Microsoft Defender for Cloud Apps, and Microsoft Defender for Endpoint. Once you have this understanding of Microsoft 365?s security suite, you then examine the key components of Microsoft 365 compliance management. This begins with an overview of all key aspects of data governance, including data archiving and retention, Microsoft Purview message encryption, and data loss prevention (DLP). You then delve deeper into archiving and retention, paying particular attention to Microsoft Purview insider risk management, information barriers, and DLP policies. You then examine how to implement these compliance features by using data classification and sensitivity labels. Prerequisites Completed a role-based administrator course such as Messaging, Teamwork, Security, Compliance, or Collaboration. A proficient understanding of DNS and basic functional experience with Microsoft 365 services. A proficient understanding of general IT practices. A working knowledge of PowerShell. 1 - Configure your Microsoft 365 experience Explore your Microsoft 365 cloud environment Configure your Microsoft 365 organizational profile Manage your tenant subscriptions in Microsoft 365 Integrate Microsoft 365 with customer engagement apps Complete your tenant configuration in Microsoft 365 2 - Manage users, licenses, and mail contacts in Microsoft 365 Determine the user identity model for your organization Create user accounts in Microsoft 365 Manage user account settings in Microsoft 365 Manage user licenses in Microsoft 365 Recover deleted user accounts in Microsoft 365 Perform bulk user maintenance in Microsoft Entra ID Create and manage guest users Create and manage mail contacts 3 - Manage groups in Microsoft 365 Examine groups in Microsoft 365 Create and manage groups in Microsoft 365 Create dynamic groups using Azure rule builder Create a Microsoft 365 group naming policy Create groups in Exchange Online and SharePoint Online 4 - Add a custom domain in Microsoft 365 Plan a custom domain for your Microsoft 365 deployment Plan the DNS zones for a custom domain Plan the DNS record requirements for a custom domain Create a custom domain in Microsoft 365 5 - Configure client connectivity to Microsoft 365 Examine how automatic client configuration works Explore the DNS records required for client configuration Configure Outlook clients Troubleshoot client connectivity 6 - Configure administrative roles in Microsoft 365 Explore the Microsoft 365 permission model Explore the Microsoft 365 admin roles Assign admin roles to users in Microsoft 365 Delegate admin roles to partners Manage permissions using administrative units in Microsoft Entra ID Elevate privileges using Microsoft Entra Privileged Identity Management Examine best practices when configuring administrative roles 7 - Manage tenant health and services in Microsoft 365 Monitor the health of your Microsoft 365 services Monitor tenant health using Microsoft 365 Adoption Score Monitor tenant health using Microsoft 365 usage analytics Develop an incident response plan Request assistance from Microsoft 8 - Deploy Microsoft 365 Apps for enterprise Explore Microsoft 365 Apps for enterprise functionality Explore your app compatibility by using the Readiness Toolkit Complete a self-service installation of Microsoft 365 Apps for enterprise Deploy Microsoft 365 Apps for enterprise with Microsoft Configuration Manager Deploy Microsoft 365 Apps for enterprise from the cloud Deploy Microsoft 365 Apps for enterprise from a local source Manage updates to Microsoft 365 Apps for enterprise Explore the update channels for Microsoft 365 Apps for enterprise Manage your cloud apps using the Microsoft 365 Apps admin center 9 - Analyze your Microsoft 365 workplace data using Microsoft Viva Insights Examine the analytical features of Microsoft Viva Insights Explore Personal insights Explore Team insights Explore Organization insights Explore Advanced insights 10 - Explore identity synchronization Examine identity models for Microsoft 365 Examine authentication options for the hybrid identity model Explore directory synchronization 11 - Prepare for identity synchronization to Microsoft 365 Plan your Microsoft Entra deployment Prepare for directory synchronization Choose your directory synchronization tool Plan for directory synchronization using Microsoft Entra Connect Plan for directory synchronization using Microsoft Entra Connect cloud sync 12 - Implement directory synchronization tools Configure Microsoft Entra Connect prerequisites Configure Microsoft Entra Connect Monitor synchronization services using Microsoft Entra Connect Health Configure Microsoft Entra Connect cloud sync prerequisites Configure Microsoft Entra Connect cloud sync 13 - Manage synchronized identities Manage users with directory synchronization Manage groups with directory synchronization Use Microsoft Entra Connect Sync Security Groups to help maintain directory synchronization Configure object filters for directory synchronization Explore Microsoft Identity Manager Troubleshoot directory synchronization 14 - Manage secure user access in Microsoft 365 Manage user passwords Enable pass-through authentication Enable multifactor authentication Enable passwordless sign-in with Microsoft Authenticator Explore self-service password management Explore Windows Hello for Business Implement Microsoft Entra Smart Lockout Implement conditional access policies Explore Security Defaults in Microsoft Entra ID Investigate authentication issues using sign-in logs 15 - Examine threat vectors and data breaches Explore today's work and threat landscape Examine how phishing retrieves sensitive information Examine how spoofing deceives users and compromises data security Compare spam and malware Examine account breaches Examine elevation of privilege attacks Examine how data exfiltration moves data out of your tenant Examine how attackers delete data from your tenant Examine how data spillage exposes data outside your tenant Examine other types of attacks 16 - Explore the Zero Trust security model Examine the principles and components of the Zero Trust model Plan for a Zero Trust security model in your organization Examine Microsoft's strategy for Zero Trust networking Adopt a Zero Trust approach 17 - Explore security solutions in Microsoft 365 Defender Enhance your email security using Exchange Online Protection and Microsoft Defender for Office 365 Protect your organization's identities using Microsoft Defender for Identity Protect your enterprise network against advanced threats using Microsoft Defender for Endpoint Protect against cyber attacks using Microsoft 365 Threat Intelligence Provide insight into suspicious activity using Microsoft Cloud App Security Review the security reports in Microsoft 365 Defender 18 - Examine Microsoft Secure Score Explore Microsoft Secure Score Assess your security posture with Microsoft Secure Score Improve your secure score Track your Microsoft Secure Score history and meet your goals 19 - Examine Privileged Identity Management Explore Privileged Identity Management in Microsoft Entra ID Configure Privileged Identity Management Audit Privileged Identity Management Control privileged admin tasks using Privileged Access Management 20 - Examine Azure Identity Protection Explore Azure Identity Protection Enable the default protection policies in Azure Identity Protection Explore the vulnerabilities and risk events detected by Azure Identity Protection Plan your identity investigation 21 - Examine Exchange Online Protection Examine the anti-malware pipeline Detect messages with spam or malware using Zero-hour auto purge Explore anti-spoofing protection provided by Exchange Online Protection Explore other anti-spoofing protection Examine outbound spam filtering 22 - Examine Microsoft Defender for Office 365 Climb the security ladder from EOP to Microsoft Defender for Office 365 Expand EOP protections by using Safe Attachments and Safe Links Manage spoofed intelligence Configure outbound spam filtering policies Unblock users from sending email 23 - Manage Safe Attachments Protect users from malicious attachments by using Safe Attachments Create Safe Attachment policies using Microsoft Defender for Office 365 Create Safe Attachments policies using PowerShell Modify an existing Safe Attachments policy Create a transport rule to bypass a Safe Attachments policy Examine the end-user experience with Safe Attachments 24 - Manage Safe Links Protect users from malicious URLs by using Safe Links Create Safe Links policies using Microsoft 365 Defender Create Safe Links policies using PowerShell Modify an existing Safe Links policy Create a transport rule to bypass a Safe Links policy Examine the end-user experience with Safe Links 25 - Explore threat intelligence in Microsoft 365 Defender Explore Microsoft Intelligent Security Graph Explore alert policies in Microsoft 365 Run automated investigations and responses Explore threat hunting with Microsoft Threat Protection Explore advanced threat hunting in Microsoft 365 Defender Explore threat analytics in Microsoft 365 Identify threat issues using Microsoft Defender reports 26 - Implement app protection by using Microsoft Defender for Cloud Apps Explore Microsoft Defender Cloud Apps Deploy Microsoft Defender for Cloud Apps Configure file policies in Microsoft Defender for Cloud Apps Manage and respond to alerts in Microsoft Defender for Cloud Apps Configure Cloud Discovery in Microsoft Defender for Cloud Apps Troubleshoot Cloud Discovery in Microsoft Defender for Cloud Apps 27 - Implement endpoint protection by using Microsoft Defender for Endpoint Explore Microsoft Defender for Endpoint Configure Microsoft Defender for Endpoint in Microsoft Intune Onboard devices in Microsoft Defender for Endpoint Manage endpoint vulnerabilities with Microsoft Defender Vulnerability Management Manage device discovery and vulnerability assessment Reduce your threat and vulnerability exposure 28 - Implement threat protection by using Microsoft Defender for Office 365 Explore the Microsoft Defender for Office 365 protection stack Investigate security attacks by using Threat Explorer Identify cybersecurity issues by using Threat Trackers Prepare for attacks with Attack simulation training 29 - Examine data governance solutions in Microsoft Purview Explore data governance and compliance in Microsoft Purview Protect sensitive data with Microsoft Purview Information Protection Govern organizational data using Microsoft Purview Data Lifecycle Management Minimize internal risks with Microsoft Purview Insider Risk Management Explore Microsoft Purview eDiscovery solutions 30 - Explore archiving and records management in Microsoft 365 Explore archive mailboxes in Microsoft 365 Enable archive mailboxes in Microsoft 365 Explore Microsoft Purview Records Management Implement Microsoft Purview Records Management Restore deleted data in Exchange Online Restore deleted data in SharePoint Online 31 - Explore retention in Microsoft 365 Explore retention by using retention policies and retention labels Compare capabilities in retention policies and retention labels Define the scope of a retention policy Examine the principles of retention Implement retention using retention policies, retention labels, and eDiscovery holds Restrict retention changes by using Preservation Lock 32 - Explore Microsoft Purview Message Encryption Examine Microsoft Purview Message Encryption Configure Microsoft Purview Message Encryption Define mail flow rules to encrypt email messages Add organizational branding to encrypted email messages Explore Microsoft Purview Advanced Message Encryption 33 - Explore compliance in Microsoft 365 Plan for security and compliance in Microsoft 365 Plan your beginning compliance tasks in Microsoft Purview Manage your compliance requirements with Compliance Manager Examine the Compliance Manager dashboard Analyze the Microsoft Compliance score 34 - Implement Microsoft Purview Insider Risk Management Explore insider risk management Plan for insider risk management Explore insider risk management policies Create insider risk management policies Investigate insider risk management activities and alerts Explore insider risk management cases 35 - Implement Microsoft Purview Information Barriers Explore Microsoft Purview Information Barriers Configure information barriers in Microsoft Purview Examine information barriers in Microsoft Teams Examine information barriers in OneDrive Examine information barriers in SharePoint 36 - Explore Microsoft Purview Data Loss Prevention Examine Data Loss Prevention Explore Endpoint data loss prevention Examine DLP policies View DLP policy results Explore DLP reports 37 - Implement Microsoft Purview Data Loss Prevention Plan to implement Microsoft Purview Data Loss Protection Implement Microsoft Purview's default DLP policies Design a custom DLP policy Create a custom DLP policy from a template Configure email notifications for DLP policies Configure policy tips for DLP policies 38 - Implement data classification of sensitive information Explore data classification Implement data classification in Microsoft 365 Explore trainable classifiers Create and retrain a trainable classifier View sensitive data using Content explorer and Activity explorer Detect sensitive information documents using Document Fingerprinting 39 - Explore sensitivity labels Manage data protection using sensitivity labels Explore what sensitivity labels can do Determine a sensitivity label's scope Apply sensitivity labels automatically Explore sensitivity label policies 40 - Implement sensitivity labels Plan your deployment strategy for sensitivity labels Examine the requirements to create a sensitivity label Create sensitivity labels Publish sensitivity labels Remove and delete sensitivity labels Additional course details: Nexus Humans MS-102T00: Microsoft 365 Administrator training program is a workshop that presents an invigorating mix of sessions, lessons, and masterclasses meticulously crafted to propel your learning expedition forward. This immersive bootcamp-style experience boasts interactive lectures, hands-on labs, and collaborative hackathons, all strategically designed to fortify fundamental concepts. Guided by seasoned coaches, each session offers priceless insights and practical skills crucial for honing your expertise. Whether you're stepping into the realm of professional skills or a seasoned professional, this comprehensive course ensures you're equipped with the knowledge and prowess necessary for success. While we feel this is the best course for the MS-102T00: Microsoft 365 Administrator course and one of our Top 10 we encourage you to read the course outline to make sure it is the right content for you. Additionally, private sessions, closed classes or dedicated events are available both live online and at our training centres in Dublin and London, as well as at your offices anywhere in the UK, Ireland or across EMEA.