- Professional Development
- Medicine & Nursing
- Arts & Crafts
- Health & Wellbeing
- Personal Development
954 Courses in Nottingham
Power BI - advanced (1 day) (In-House)
By The In House Training Company
This course starts with data transformation strategies, exploring capabilities in the Power Query Editor, and data-cleansing practices. It looks at the Advanced Query Editor to view the M language code. This course focuses on advanced DAX measures that include filtering conditions, with a deep dive into time intelligence measures. Like the M query language, DAX is a rich functional language that supports variables and expression references. This course also looks at the creation of dynamic dashboards and incorporates a range of visualisations available in Power BI Desktop and online in the AppSource. The course finishes with a look at setting up end user level security in tables. 1 The query editor Split by row delimiter AddDays to determine deadlines Advanced query editor 2 Fuzzy matching joins Matching inconsistencies by percentage Matching with transformation table 3 Logical column functions Logical functions IF, AND, OR Using multiple conditions Including FIND in functions 4 Editing DAX measures Make DAX easier to read Add comments to a measure Using quick measures 5 The anatomy of CALCULATE Understanding CALCULATE context filters Adding context to CALCULATE with FILTER Using CALCULATE with a threshold 6 The ALL measure Anatomy of ALL Create an ALL measure Using ALL as a filter Use ALL for percentage 7 DAX iterators Anatomy of iterators A closer look at SUMX Using RELATED in SUMX Create a RANKX RANKX with ALL 8 Date and time functions Overview of functions Create a DATEDIFF function 9 Time intelligent measures Compare historical monthly data Create a DATEADD measure Creating cumulative totals Creating cumulative measures Visualising cumulative totals 10 Visualisations in-depth Utilising report themes Create a heatmap Comparing proportions View trends with sparklines Group numbers using bins Setting up a histogram 11 Comparing variables Visualising trendlines as KPI Forecasting with trendlines Creating a scatter plot Creating dynamic labels Customised visualisation tooltips Export reports to SharePoint 12 User level security Setting up row level security Testing user security

How Disposable Vapes Can Help You Quit Smoking?
By Vape Shop 247
Discover how disposable vapes like the Flavour Beast DCP 20K can assist you in quitting smoking. Explore benefits such as controlled nicotine intake, reduced harmful chemicals, and the convenience of shopping at a Canadian vape shop online.

Creating a culture of teamwork in an Early Years Team.
By The Leadership Wizard
Belonging & Connection

Overview The objective of this course is to equip professionals with comprehensive knowledge and practical skills in WEB 3 technologies and crypto assets. Participants will gain a deep understanding of the underlying principles of blockchain, the operational mechanics of cryptocurrencies, the potential impact of these technologies on the banking sector and the latest trends. Who the course is for Consultants Analysts Managers C-Level executives People in need of knowledge to develop a blockchain strategy People working with blockchain projects Regulators Course Content To learn more about the day by day course content please click here To learn more about schedule, pricing & delivery options, book a meeting with a course specialist now

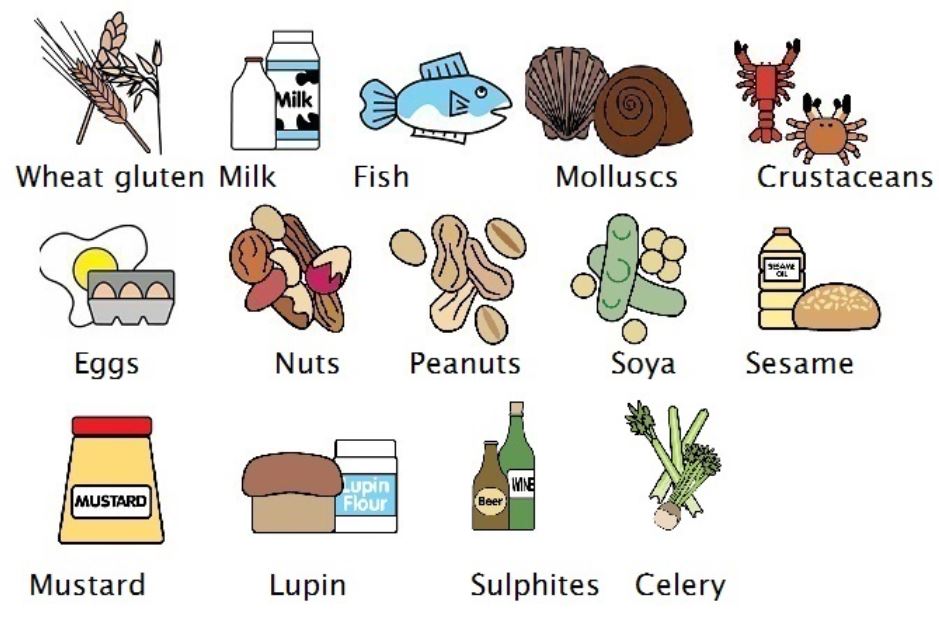
RSPH level 2 Identifying and Controlling Food Allergy Risks Training Course
By Kitchen Tonic Training Company and Food Safety Consultants
RSPH level 2 Identifying and Controlling Food Allergy Risks Training Course Do you need an allergy trainer to come to your food business and teach your staff face to face about food and drink allergens, their dangers and how to control them? Our allergy trainer can come to your business and deliver this course at your business premises. Although we are based in London, we are happy to travel and deliver this course at your business location. (Trainer travel fees may be applicable depending on your location). Staff will receive interactive training and coaching on allergens and intolerances with an experienced trainer. We can also tweak the training to include issues you would like to cover. See our website for more details. Special offer for on-site allergy training. £250 plus £20pp includes RSPH exam fees (usually £350 plus £30pp) This course is suitable for any catering business such as restaurants, pubs, hotels, cafes, catering companies, cooks, self employed, artisans, event caterers and more. This course is also important for staff who are Front of House, who take customer orders and relay the orders to cooks and chefs and other people who are preparing food for customers who have allergies and or intolerances. This is a short one day training course, typically 9am-3pm. Topics covered include- Allergens, Allergen Identification, Cross contact, Cross Contamination, Allergic Reactions, Food Intolerances, Coeliac, Anaphylaxis, Natasha's Law, UK Food Safety Regulations, Allergy Controls, Substituting ingredients, Customer Communication and what to do in an Emergency. Contact us to book training.
Power BI - dashboards (1 day) (In-House)
By The In House Training Company
Power BI is a powerful data visualisation program that allows businesses to monitor data, analyse trends, and make decisions. This course is designed to provide a solid understanding of the reporting side of Power BI, the dashboards, where administrators, and end users can interact with dynamic visuals that communicates information. This course focuses entirely on the creation and design of visualisations in dashboards, including a range of chart types, engaging maps, and different types of tables. Designing dashboards with KPI's (key performance indicators), heatmaps, flowcharts, sparklines, and compare multiple variables with trendlines. This one-day programme focuses entirely on creating dashboards, by using the many visualisation tools available in Power BI. You will learn to build dynamic, user-friendly interfaces in both Power BI Desktop and Power BI Service. 1 Introduction Power BI ecosystem Things to keep in mind Selecting dashboard colours Importing visuals into Power BI Data sources for your analysis Joining tables in Power BI 2 Working with data Utilising a report theme Table visuals Matrix visuals Drilling into hierarchies Applying static filters Group numbers with lists Group numbers with bins 3 Creating visuals Heatmaps in Power BI Visualising time-intelligence trends Ranking categorical totals Comparing proportions View trends with sparklines 4 Comparing variables Insert key performance indicators (KPI) Visualising trendlines as KPI Forecasting with trendlines Visualising flows with Sankey diagrams Creating a scatter plot 5 Mapping options Map visuals Using a filled map Mapping with latitude and longitude Mapping with ArcGIS or ESRI 6 Creating dashboards High-level dashboard Migration analysis dashboard Adding slicers for filtering Promote interaction with nudge prompts Searching the dashboard with a slicer Creating dynamic labels Highlighting key points on the dashboard Customised visualisation tooltips Syncing slicers across pages 7 Sharing dashboards Setting up and formatting phone views Exporting data Creating PDF files Uploading to the cloud Share dashboards in SharePoint online

How to Develop a Vision that leads to Distributive Leadership!
By The Leadership Wizard
Keeping your vision alive

Connect, Communicate, Collaborate
By Genos International Europe
This dynamic programme empowers attendees to enhance their emotional intelligence, forge meaningful connections in every interaction, engage in impactful coaching conversations, and cultivate resilience and psychological safety. Through interactive workshops, compelling discussions, and practical exercises, participants will acquire skills and insights necessary to foster a space for collaboration helping shape an environment of trust and openness in their professional and personal spaces