- Professional Development
- Medicine & Nursing
- Arts & Crafts
- Health & Wellbeing
- Personal Development
CCNP (ENARSI) training course description The Implementing Cisco Enterprise Advanced Routing and Services (ENARSI) v1.0 gives you the knowledge you need to install, configure, operate, and troubleshoot an enterprise network. This course covers advanced routing and infrastructure technologies, expanding on the topics covered in the Implementing and Operating Cisco Enterprise Network Core Technologies (ENCOR) v1.0 course. This course helps prepare for the exam, Implementing Cisco Enterprise Advanced Routing and Services (300- 410 ENARSI), which leads to the new CCNP What will you learn Gain the knowledge you need to install, configure, operate, and troubleshoot an enterprise network. Qualify for professional-level job roles in advance routing and services Prepare for the Implementing Cisco Enterprise Advanced Routing and Services Exam (300-410 ENARSI). CCNP (ENARSI) training course details Who will benefit: Enterprise network engineers, System engineers, System administrators, Network administrators. Prerequisites: CCNP core Duration 5 days CCNP (ENARSI) training course content Course Objectives Configure classic Enhanced Interior Gateway Routing Protocol (EIGRP) and named EIGRP for IPv4 and IPv6 Optimize classic EIGRP and named EIGRP for IPv4 and IPv6 Troubleshoot classic EIGRP and named EIGRP for IPv4 and IPv6 Configure Open Shortest Path First (OSPF)v2 and OSPFv3 in IPv4 and IPv6 environments Optimize OSPFv2 and OSPFv3 behaviour Troubleshoot OSPFv2 for IPv4 and OSPFv3 for IPv4 and IPv6 Implement route redistribution using filtering mechanisms Troubleshoot redistribution Implement path control using Policy-Based Routing (PBR) and IP Service Level Agreement (SLA) Configure Multiprotocol-Border Gateway Protocol (MPBGP) in IPv4 and IPv6 environments Optimize MPBGP in IPv4 and IPv6 environments Troubleshoot MPBGP for IPv4 and IPv6 Describe the features of Multiprotocol Label Switching (MPLS) Describe the major architectural components of an MPLS VPN Identify the routing and packet forwarding functionalities for MPLS VPNs Explain how packets are forwarded in an MPLS VPN environment Implement Cisco Internetwork Operating System (IOS) Dynamic Multipoint VPNs (DMVPNs) Implement Dynamic Host Configuration Protocol (DHCP) Describe the tools available to secure the IPV6 first hop Troubleshoot Cisco router security features Troubleshoot infrastructure security and services Course Outline Implementing EIGRP Optimizing EIGRP Troubleshooting EIGRP Implementing OSPF Optimizing OSPF Troubleshooting OSPF Configuring Redistribution Troubleshooting Redistribution Implementing Path Control Implementing Internal Border Gateway Protocol (IBGP) Optimizing BGP Implementing MP-BGP Troubleshooting BGP Exploring MPLS Introducing MPLS L3 VPN Architecture Introducing MPLS L3 VPN Routing Configuring Virtual Routing and Forwarding (VRF)-Lite Implementing DMVPN Implementing DHCP Introducing IPv6 First Hop Security Securing Cisco Routers Troubleshooting Infrastructure Security and Services Troubleshooting with DNA Center Assurance. Lab outline Configure EIGRP Using Classic Mode and Named Mode for IPv4 and IPv6 Verify the EIGRP Topology Table Configure EIGRP Stub Routing, Summarization, and Default Routing Configure EIGRP Load Balancing and Authentication Troubleshoot EIGRP Issues Configure OSPFv3 for IPv4 and IPv6 Verify the LinkState Database Configure OSPF Stub Areas and Summarization Configure OSPF Authentication Troubleshoot OSPF Issues Implement Routing Protocol Redistribution Manipulate Redistribution Manipulate Redistribution Using Route Maps Troubleshoot Redistribution Issues Implement PBR Configure IBGP and External Border Gateway Protocol (EBGP) Implement BGP Path Selection Configure BGP Advanced Features Configure BGP Route Reflectors Configure MP-BGP for IPv4 and IPv6 Troubleshoot BGP Issues Configure Routing with VRF -Lite Implement Cisco IOS DMVPN Obtain IPv6 Addresses Dynamically Troubleshoot DHCPv4 and DHCPv6 Issues Troubleshoot IPv4 and IPv6 Access Control List (ACL) Issues Configure and Verify Unicast Reverse Path Forwarding (uRPF) Troubleshoot Network Management Protocol Issues: Lab 1 and 2

Definitive Salt training course description Salt is a remote execution framework and configuration management system. This course covers Salt from the basics. After a quick first taste the course moves onto execution modules, salt states, minion and master data, jinja, Salt extensions and then topology and configuration options. Hands on sessions are used to reinforce the theory rather than teach specific manufacturer equipment. What will you learn Install and use Salt. Describe the architecture of Salt. Manage configurations with Salt. Extend Salt. Definitive Salt training course details Who will benefit: Anyone working with Salt. Prerequisites: Linux fundamentals. Duration 2 days Definitive Salt training course contents Introduction What is Salt? High- level architecture, Some quick examples, system management, configuration management, A brief history, Topology options, Extending Salt. Quick start: First taste of Salt Single-master setup, from packages, bootstrap scripts, Starting up, Basic commands, salt: the main workhorse, salt-key: key management, salt-call: execution on the minion, salt-run: co-ordination of jobs on the master, summary of commands, Key management, viewing keys, accepting keys, rejecting keys, key files, Minion targeting, minion ID, list (-L), glob, regular expressions (-E), grains (-G), compound (-C), targeting summary, Additional remote execution details, Conclusion. Execution modules: The functional foundation sys: information and documentation about modules, sys.doc basic documentation, sys.list_modules, sys.list_functions: simple listings, cmd: execute via shell, cmd.run: run any command, pkg: manage packages, virtual modules, pkg.lists_pkgs: list all installed packages, pkg.available version: see what version will be installed, pkg.install: install packages, user: manage users, user.add: add users, user.list_users, user info: get user info, saltutil: access various Salt utilities, Summary. Configuration management: Salt states Salt files overview, SLS example: adding a user, working with the multi-layered state system, Highstate and the top file, the top file, State ordering, require: depend on another state, watch: run based on other changes, odds and ends, Summary. Minion data / master data Grains are minion data, performing basic grain operations, setting grains, targeting with grains in the top file, Pillars are data from the master, querying pillar data, querying other sources with external pillars, Renderers give data options. Extending Salt: part I Introduction to Jinja, Jinja basics, Templating with Jinja, filtering by grains, Custom execution module, Custom state modules, Custom grains, External pillars, Summary. More on the matter Runners, manage minions, manage jobs, The orchestrate runner, The event system, The reactor system, Summary. Extending Salt: part II Python client API, reading configuration data on a master and minion, using the master client (localclient) API, Using the caller client API, Custom runners, writing a custom runner, using the runnerclient API, Summary. Topology and configuration options Master configuration, directories and files, logging, access control, files server options, Topology variations, masterless minions, peer systems, syndication masters, multiple masters. Brief introduction to salt-cloud Overview, Setup AWS and salt-cloud, installing salt-cloud, cloud providers, cloud profiles, cloud maps, Introspection via salt cloud, Creating infrastructure, More information. Using vagrant to run Salt examples YAML.
ITIL 4 Strategist: Direct, Plan and Improve: In-House Training
By IIL Europe Ltd
ITIL® 4 Strategist: Direct, Plan and Improve: In-House Training The ITIL® 4 Strategist: Direct, Plan, and Improve course is based on the ITIL® 4 Strategist Direct, Plan, and Improve candidate syllabus from AXELOS. This course is based on the ITIL® 4 Strategist: Direct, Plan and Improve IT exam specifications from AXELOS. With the help of ITIL® 4 concepts and terminology, exercises, and examples included in the course, candidates acquire the relevant knowledge required to pass the certification exam. This course provides the practical skills necessary to create a 'learning and improving' IT organization, with a strong and effective strategic direction. It was designed to provide practitioners with a practical and strategic method for planning and delivering continual improvement with necessary agility. It covers both practical and strategic elements, making it the universal module that is a key component to both ITIL® 4 Managing Professional and ITIL® 4 Strategic Leader streams. What You Will Learn At the end of this course, participants will be able to: Understand the key concepts of direction, planning, improvement Understand the scope of what is to be directed and/or planned and know how to use key principles and methods of direction and planning in that context Understand the role of GRC and know how to integrate the principles and methods into the service value system Understand and know how to use the key principles and methods of continual improvement for all types of improvements Understand and know how to use the key principles and methods of Communication and Organizational Change Management to direction, planning and improvement Understand and know how to use the key principles and methods of measurement and reporting in direction, planning, and improvement Understand and know how to direct, plan, and improve value streams and practices Course Introduction Let's Get to Know Each Other Course Overview ITIL® 4 Certification Scheme Course Learning Objectives Course Components Course Agenda Exercises Case Study: Axle Car Hire Case Study: HandyPerson on Demand Exam Details Core Concepts of DPI Key Terms Covered in the Module Module Learning Objectives Basics of Direction Basics of Planning Basics of Improvement Other Core Elements DPI through Service Value Chain and Guiding Principles Key Terms Covered in the Module Module Learning Objectives DPI of the SVS DPI of Guiding Principles Role of Direction in Strategy Management Key Terms Covered in the Module Introducing Strategy Management Developing Effective Strategies Implementation of Strategies Key Terms Covered in the Module Module Learning Objectives Managing Risks Making Decisions through Portfolio Management Directing via Governance, Risk, and Compliance (GRC) Introduction to Assessment and Planning Key Terms Covered in the Module Module Learning Objectives Core Concepts of Assessment Conducting Effective Assessments Core Concepts of Planning Assessment and Planning through VSM Key Terms Covered in the Module Module Learning Objectives Introducing VSM Developing Value Stream Maps Knowing More About VSM Measurement, Reporting, and Continual Improvement Key Terms Covered in the Module Module Learning Objectives Measurement and Reporting Alignment of Measurements and Metrics Success Factors and Key Performance Indicators Continual Improvement Measurements and Continual Improvement through Dimensions and SVS Key Terms Covered in the Module Module Learning Objectives Measurements for the Four Dimensions Continual Improvement of the Service Value Chain and Practices OCM Principles and Methods Key Terms Covered in the Module Module Learning Objectives Basics of OCM OCM throughout DPI and Service Value Chain Resistance and Reinforcement Communication Principles and Methods Key Terms Covered in the Module Module Learning Objectives Basics of Effective Communication Communication with Stakeholders SVS Development Using Four Dimensions Key Terms Covered in the Module Module Learning Objectives Organizations and People in the SVS Partners and Suppliers in the SVS Value Streams and Processes in the SVS Information and Technology in the SVS

Prospect Maturation
By EnergyEdge - Training for a Sustainable Energy Future
About this Training Course The prospect maturation process, from a lead to a drillable prospect, is at the heart of the exploration business. This 5 full day course will cover all aspects of the prospect maturation process: play understanding in the context of regional geological understanding, detailed prospect evaluation; realistic risk & volume assessment consistent with the play understanding and prospect details, and an introduction to exploration economics. Throughout the course, there is a strong focus on pragmatic (geo)logical approach for assessing those aspects that are input parameters for a meaningful assessment of prospect risks and volumes, with emphasis on a balanced integration of contributions from different sub-surface disciplines. Many examples from basins from around the world are used to illustrate how traps, reservoirs, seals and charge occur in different basin settings. Specifics topics that will be discussed include the following: The statistical fundamentals for risk and volume assessment will be presented, with practical exercises for understanding the results of a risk & volume assessment as they are displayed in expectation curves. The difference between risk and uncertainty. A full discussion of the essential requirements for a working petroleum system: Trap, reservoir, seal and charge. Examples of how traps, reservoirs, seals and charge work in different basin types around the globe and in Australian basins. Exercises and guidelines for estimating uncertainties for prospect parameters, including advice for deciding which distribution type to use, and how to constrain those distributions for meaningful uncertainty ranges (setting minimum most likely and maximum values). Particular emphasis will be given to estimating hydrocarbon column lengths with their associated uncertainties in undrilled prospects. Prospects and plays: The value of play maps and how these should be used for assessment of prospect risks and for ranking of prospects within a play. Calculating volume ranges for prospects. Calculating volumes for groups of prospects; how to add risked prospect volumes for a statistically correct representation of the volume promise of a portfolio of prospects. Geophysical evidence: Incorporating geophysical evidence (DHIs) consistently and realistically in a risk assessment. An understandable and geology-based workflow, consistent with Bayes theorem, will be presented. Exploration economics. Training Objectives What this course will cover in 5 days: This course describes the various aspects that need to be considered in the prospect maturation process, including: Play development in the context of a sound understanding of the regional geology Detailed prospect evaluation and understanding of the critical aspects of traps, reservoirs, seals and charge Examples from plays and prospects in different basin settings from around the globe Realistic and pragmatic risk and volume assessment, based on the geological understanding of plays and prospects An introduction to exploration economics Examples of plays, oil and gas fields and prospects from basins from around the world, including the Far East, will be given. Target Audience This course is designed primarily for Geoscientists in exploration who would like to improve their expertise of the prospect maturation process and risk and volume assessment. The course has proven to be of value for explorers in the early phase of their career, seasoned explorers and team leaders. It will also benefit staff from disciplines working closely with exploration staff including Prospect Portfolio Analysts, Petrophysicists, Geophysicists and Reservoir Engineers. Course Level Intermediate Training Methods At the end of the course, the participants will have a good understanding of the essentials for realistic risk and volume assessments of exploration prospects. The course should allow participants to produce well-considered and realistic assessments for prospects they may be working on, and to understand and constructively challenge risk and volume assessments of colleagues and/ or partners/ competitors. Each topic is introduced by a lecture, and learning is re-inforced by practical exercises and discussions. Hand-out materials in paper and/or electronic format will be provided. Time will be made available to discuss aspects of prospects that may be brought in by course participants. Trainer Your expert course leader has a PhD in Geology from the University of Utrecht. He worked for 31 years (1979 -2010) with Shell as an exploration geologist in a variety of functions across the globe. As Principle Technical Expert, he was responsible for ensuring that Risk & Volume assessments were carried out consistently and correctly in all of Shell's exploration units. In this capacity, he led and participated in countless prospect review sessions and developed and conducted a successful in-house course on Risks & Volume assessment. As manager of the Exploration Excellence Team, he performed in depth analysis of basins and plays and provided advice on exploration opportunities to senior management. Together with his team, he visited most of Shell's exploration offices, working hands-on with Shell's local exploration teams to generate new play and prospect ideas and to suggest evaluation techniques and technologies to apply. In 2010, he was appointed as extraordinary professor Regional and Petroleum Geology at the VU university of Amsterdam and in 2012 also at the University of Utrecht. He was visiting professor at the University of Malaya (Malaysia). Through his own consultancy, as of 2010, he provides advice on exploration activities to several companies and is regularly invited to carry out technical reviews. Activities cover all continents and include Portfolio Reviews, Prospect assessment, Play-based Exploration, and Geothermal activities. He conducts courses on several topics including Risk & Volume Assessment, Prospect Maturation, Basin Analysis, Play-based Exploration, Trap & Seal Analysis, Petroleum Geology for Non-geologists. Some of his recent publications include: De Jager, J. & van Winden, M. (2020): Play-Based Exploration of the petroleum potential of the Tremp-Graus, AÃnsa and eastern Jaca Sub-basins in the southern Pyrenees. Invited contribution for Digital Geology, EAGE special publication (eds: Grötsch, J. & Pöppelreiter, M.) De Jager, J. (2020). Concepts of Conventional Petroleum Systems. Invited contribution for Regional Geology and Tectonics Volume 1: Global Concepts, Techniques and Methodology (eds: Adam, J., Chiarelly, D. & Scarselli, N.) De Jager, J. (2021): Handbook Risk & Volume Assessment. Self-published De Jager, J., Van Ojik, K & Smit, R. (2023 - in preparation): Geological Development of The Netherlands. In: Geology of The Netherlands (eds: Ten Veen, J., Vis, G-J., De Jager, J. @ Wong, T.) POST TRAINING COACHING SUPPORT (OPTIONAL) To further optimise your learning experience from our courses, we also offer individualized 'One to One' coaching support for 2 hours post training. We can help improve your competence in your chosen area of interest, based on your learning needs and available hours. This is a great opportunity to improve your capability and confidence in a particular area of expertise. It will be delivered over a secure video conference call by one of our senior trainers. They will work with you to create a tailor-made coaching program that will help you achieve your goals faster. Request for further information about post training coaching support and fees applicable for this. Accreditions And Affliations

Microsoft Power BI Desktop In-company (now with live online classes)
By Microsoft Office Training
This course will allow you to explore the potential of self-service business intelligence using Power BI Desktop to analyse and connect to different sources of data, creating Relationships between those different datasets, Query the data using Shaping and data Modelling, to create Visualizations, and publish Reports to different platforms . Course Objectives At the end of this course you will be able to: Connect to data from different sources. Use the Query Editor Perform Power BI desktop data Shaping and Transformation. Create Power BI desktop Modelling. Create Power BI desktop Visualizations and Reports. ' 1 year email support service Take a closer look at the consistent excellent feedback from our growing corporate clients visiting our site ms-officetraining co uk With more than 20 years experience, we deliver courses on all levels of the Desktop version of Microsoft Office and Office 365; ranging from Beginner, Intermediate, Advanced to the VBA level and Business Intelligence. Our trainers are Microsoft certified professionals with a proven track record with several years experience in delivering public, one to one, tailored and bespoke courses. Our competitive rates start from £550.00 per day of training Tailored training courses: You can choose to run the course exactly as they are outlined by us or we can customise it so that it meets your specific needs. A tailored or bespoke course will follow the standard outline but may be adapted to your specific organisational needs. Please visit our site (ms-officetraining co uk) to get a feel of the excellent feedback our courses have had and look at other courses you might be interested in. Introduction to Power BI Power BI Jargon explained A quick look at Power BI Desktop A quick look at the Power BI service Helpful resources Power BI and Excel Introduction to using Excel data in Power BI Upload Excel data to Power BI Import Power View and Power Pivot to Power BI Getting started with Power BI Desktop Overview of Power BI Desktop Accessing Help and Helpful resources Connect to data sources in Power BI Desktop Shaping and Transforming Data with Query Editor Introduction to the Query Editor Data Sources Power BI Desktop can Connect to Introduction to Steps and M code Combining Data Using Merge and Append Queries Data Type Properties Working with Delimiters Clean and transform your data with the Query Editor Text Specific Transformation Tools Number Specific Transformation Tools Date Specific Transformation Tools Split and Merge columns Creating an Index Column Adding Conditional Columns Columns From Examples Grouping and Aggregating data Pivoting and Unpivoting Using filters Modeling the data Introduction to modeling your data How to manage your data relationships Create calculated columns Optimizing data models Create calculated measures Show Values As and Quick Measures Create calculated tables Explore your time-based data Introduction to DAX DAX calculation types DAX functions Visualizations Introduction to visuals in Power BI Create and customize simple visualizations Modify colors in charts and visuals Shapes, text boxes, and images Page layout and formatting Group interactions among visualizations Visual hierarchies and drill-down Using custom visualizations Create a KPI Visualization Geo-Data and Maps Reports, Publishing and Sharing Introduction to the Power BI service Quick insights in Power BI Create and configure a dashboard Ask questions of your data with natural language Create custom Q&A suggestions Share dashboards with your organization Introduction to content packs, security, and groups Publish Power BI Desktop reports Print and export dashboards and reports Create groups in Power BI Use content packs Update content packs Publish to web Who is this course for? Who is this course for? This course facilitates you with knowledge on the potential for Power BI Desktop to analyse and connect to different sources of data, creating Relationships between those different datasets, Query the data using Shaping and data Modelling, and to create Visualizations, and publish Reports to different platforms. Requirements Requirements Before attending this course, delegates should have: - A general knowledge of database concepts (fields, records and relationships) - Familiarity with Excel. Career path Career path Business Intelligence Data Analysis ETL & Data Warehousing

The Magic of Mentoring
By Mpi Learning - Professional Learning And Development Provider
In this course you will understand what mentoring is about, understand your roles in the process. Gain self-insight into your own interpersonal style and way of relating to others that may affect mentoring interactions.

Power BI - introduction (2 day) (In-House)
By The In House Training Company
There is a lot to learn in Power BI, this course takes a comprehensive look at the fundamentals of analysing data and includes a balanced look at the four main components that make up Power BI Desktop: Report view, Data view, Model view, and the Power Query Editor. It also demonstrates how to utilise the online Power BI service. It looks at authoring tools that enable you to connect to and transform data from a variety of sources, allowing you to produce detailed reports through a range of visualisations, in an interactive and dynamic way. It also includes a detailed look at formulas by writing both M functions in Power Query, and DAX functions in Desktop view. This knowledge will allow you to take your reports to the next level. The aim of this course is to provide a complete introduction to understanding the Power BI analysis process, by working hands-on with examples that will equip you with the necessary skills to start applying your learning straight away. 1 Getting Started The Power BI ecosystem Opening Power BI Desktop Power BI's four views Introduction to Dashboards 2 Importing Files Importing data sources Importing an Excel file Importing a CSV file Importing a database Connect to an SQL Server Database Import vs. Direct Query Importing from the web Importing a folder of files Managing file connections 3 Shape Data in the Query Editor The process of shaping data Managing data types Keeping and removing rows Add a custom column Appending tables together Hiding queries in reports Fixing error issues Basic maths operations 4 The Data Model Table relationships Relationship properties 5 Merge Queries Table join kinds Merging tables 6 Inserting Dashboard Visuals Things to keep in mind Inserting maps Formatting Maps Inserting charts Formatting Charts Inserting a tree map Inserting a table, matrix, and card Controlling number formats About report themes Highlighting key points Filter reports with slicers Sync slicers across dashboards Custom web visuals 7 Publish and share Reports Publishing to Power BI service Editing online reports Pinning visuals to a dashboard What is Q&A? Sharing dashboards Exporting reports to PowerPoint Exporting reports as PDF files 8 The Power Query Editor Fill data up and down Split column by delimiter Add a conditional column More custom columns Merging columns 9 The M Functions Inserting text functions Insert an IF function Create a query group 10 Pivoting Tables Pivot a table Pivot and append tables Pivot but don't aggregate Unpivot tables Append mismatched headers 11 Data Modelling Expanded Understanding relationships Mark a date table 12 DAX New Columns New columns and measures New column calculations Insert a SWITCH function 13 Introduction to DAX Measures Common measure functions Insert a SUM function Insert a COUNTROWS function Insert a DISTINCTCOUNT function Insert a DIVIDE function DAX rules 14 The CALCULATE Measure The syntax of CALCULATE Insert a CALCULATE function Control field summarisation Things of note 15 The SUMX measure X iterator functions Anatomy of SUMX Insert a SUMX function When to use X functions 16 Time Intelligence Measures Importance of a calendar table Insert a TOTALYTD function Change financial year end date Comparing historical data Insert a DATEADD function 17 Hierarchies and Groups Mine data using hierarchies Compare data in groups

Tableau Desktop Training - Foundation
By Tableau Training Uk
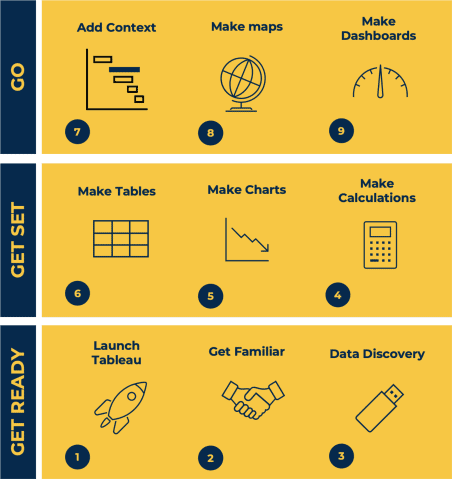
This Tableau Desktop Training course is a jumpstart to getting report writers and analysts with little or no previous knowledge to being productive. It covers everything from connecting to data, through to creating interactive dashboards with a range of visualisations in two days of your time. For Private options, online or in-person, please send us details of your requirements: This Tableau Desktop Training course is a jumpstart to getting report writers and analysts with little or no previous knowledge to being productive. It covers everything from connecting to data, through to creating interactive dashboards with a range of visualisations in two days of your time. Having a quick turnaround from starting to use Tableau, to getting real, actionable insights means that you get a swift return on your investment of time and money. This accelerated approach is key to getting engagement from within your organisation so everyone can immediately see and feel the impact of the data and insights you create. This course is aimed at someone who has not used Tableau in earnest and may be in a functional role, eg. in sales, marketing, finance, operations, business intelligence etc. The course is split into 3 phases and 9 modules: PHASE 1: GET READY MODULE 1: LAUNCH TABLEAU Check Install & Setup Why is Visual Analytics Important MODULE 2: GET FAMILIAR What is possible How does Tableau deal with data Know your way around How do we format charts Dashboard Basics – My First Dashboard MODULE 3: DATA DISCOVERY Connecting to and setting up data in Tableau How Do I Explore my Data – Filters & Sorting How Do I Structure my Data – Groups & Hierarchies, Visual Groups How Tableau Deals with Dates – Using Discrete and Continuous Dates, Custom Dates Phase 2: GET SET MODULE 4: MAKE CALCULATIONS How Do I Create Calculated Fields & Why MODULE 5: MAKE CHARTS Charts that Compare Multiple Measures – Measure Names and Measure Values, Shared Axis Charts, Dual Axis Charts, Scatter Plots Showing Relational & Proportional Data – Pie Charts, Donut Charts, Tree Maps MODULE 6: MAKE TABLES Creating Tables – Creating Tables, Highlight Tables, Heat Maps Phase 3: GO MODULE 7: ADD CONTEXT Reference Lines and Bands MODULE 8: MAKE MAPS Answering Spatial Questions – Mapping, Creating a Choropleth (Filled) Map MODULE 9: MAKE DASHBOARDS Using the Dashboard Interface Dashboard Actions This training course includes over 25 hands-on exercises and quizzes to help participants “learn by doing” and to assist group discussions around real-life use cases. Each attendee receives a login to our extensive training portal which covers the theory, practical applications and use cases, exercises, solutions and quizzes in both written and video format. Students must use their own laptop with an active version of Tableau Desktop 2018.2 (or later) pre-installed. What People Are Saying About This Course “Excellent Trainer – knows his stuff, has done it all in the real world, not just the class room.”Richard L., Intelliflo “Tableau is a complicated and powerful tool. After taking this course, I am confident in what I can do, and how it can help improve my work.”Trevor B., Morrison Utility Services “I would highly recommend this course for Tableau beginners, really easy to follow and keep up with as you are hands on during the course. Trainer really helpful too.”Chelsey H., QVC “He is a natural trainer, patient and very good at explaining in simple terms. He has an excellent knowledge base of the system and an obvious enthusiasm for Tableau, data analysis and the best way to convey results. We had been having difficulties in the business in building financial reports from a data cube and he had solutions for these which have proved to be very useful.”Matthew H., ISS Group
Memory skills and mind-mapping (In-House)
By The In House Training Company
This is an incredibly practical programme which has been developed to enable participants to improve their memory skills. The session focuses on specific techniques that can be used to improve retention of information. It also introduces the principles of mind-mapping By the end of this programme participants will be able to: Explain how our brain processes and stores information Describe the difference between short-term and long-term memory Use specific techniques to improve retention Explain the principles of mind mapping Be able to use mind maps to plan and order information Each participant, no matter how poor they believe their memory to be, will by the close of the session have learnt techniques that enable them to memorise 53 items in a prescriptive order - a massive boost to their confidence in their memory skills. 1 An introduction to the brain's functions Introductory brain-training How the brain works Left / right brain function Short-term and long-term memory Barriers to a good memory 2 Memory techniques Tips and techniques for improving memory Basic word association Chaining and linking Touchstone techniques Use of mnemonics Memory hooks Remembering names 3 Maximising memory Minimising barriers The importance of sleep and diet Supplements which may affect memory 4 Mind-mapping Purpose and principles Creating a mind map Use of colour to delight the eye and tickle the brain How to use the output from a map
Power BI - dashboards (1 day) (In-House)
By The In House Training Company
Power BI is a powerful data visualisation program that allows businesses to monitor data, analyse trends, and make decisions. This course is designed to provide a solid understanding of the reporting side of Power BI, the dashboards, where administrators, and end users can interact with dynamic visuals that communicates information. This course focuses entirely on the creation and design of visualisations in dashboards, including a range of chart types, engaging maps, and different types of tables. Designing dashboards with KPI's (key performance indicators), heatmaps, flowcharts, sparklines, and compare multiple variables with trendlines. This one-day programme focuses entirely on creating dashboards, by using the many visualisation tools available in Power BI. You will learn to build dynamic, user-friendly interfaces in both Power BI Desktop and Power BI Service. 1 Introduction Power BI ecosystem Things to keep in mind Selecting dashboard colours Importing visuals into Power BI Data sources for your analysis Joining tables in Power BI 2 Working with data Utilising a report theme Table visuals Matrix visuals Drilling into hierarchies Applying static filters Group numbers with lists Group numbers with bins 3 Creating visuals Heatmaps in Power BI Visualising time-intelligence trends Ranking categorical totals Comparing proportions View trends with sparklines 4 Comparing variables Insert key performance indicators (KPI) Visualising trendlines as KPI Forecasting with trendlines Visualising flows with Sankey diagrams Creating a scatter plot 5 Mapping options Map visuals Using a filled map Mapping with latitude and longitude Mapping with ArcGIS or ESRI 6 Creating dashboards High-level dashboard Migration analysis dashboard Adding slicers for filtering Promote interaction with nudge prompts Searching the dashboard with a slicer Creating dynamic labels Highlighting key points on the dashboard Customised visualisation tooltips Syncing slicers across pages 7 Sharing dashboards Setting up and formatting phone views Exporting data Creating PDF files Uploading to the cloud Share dashboards in SharePoint online