- Professional Development
- Medicine & Nursing
- Arts & Crafts
- Health & Wellbeing
- Personal Development
1393 Courses in Birmingham
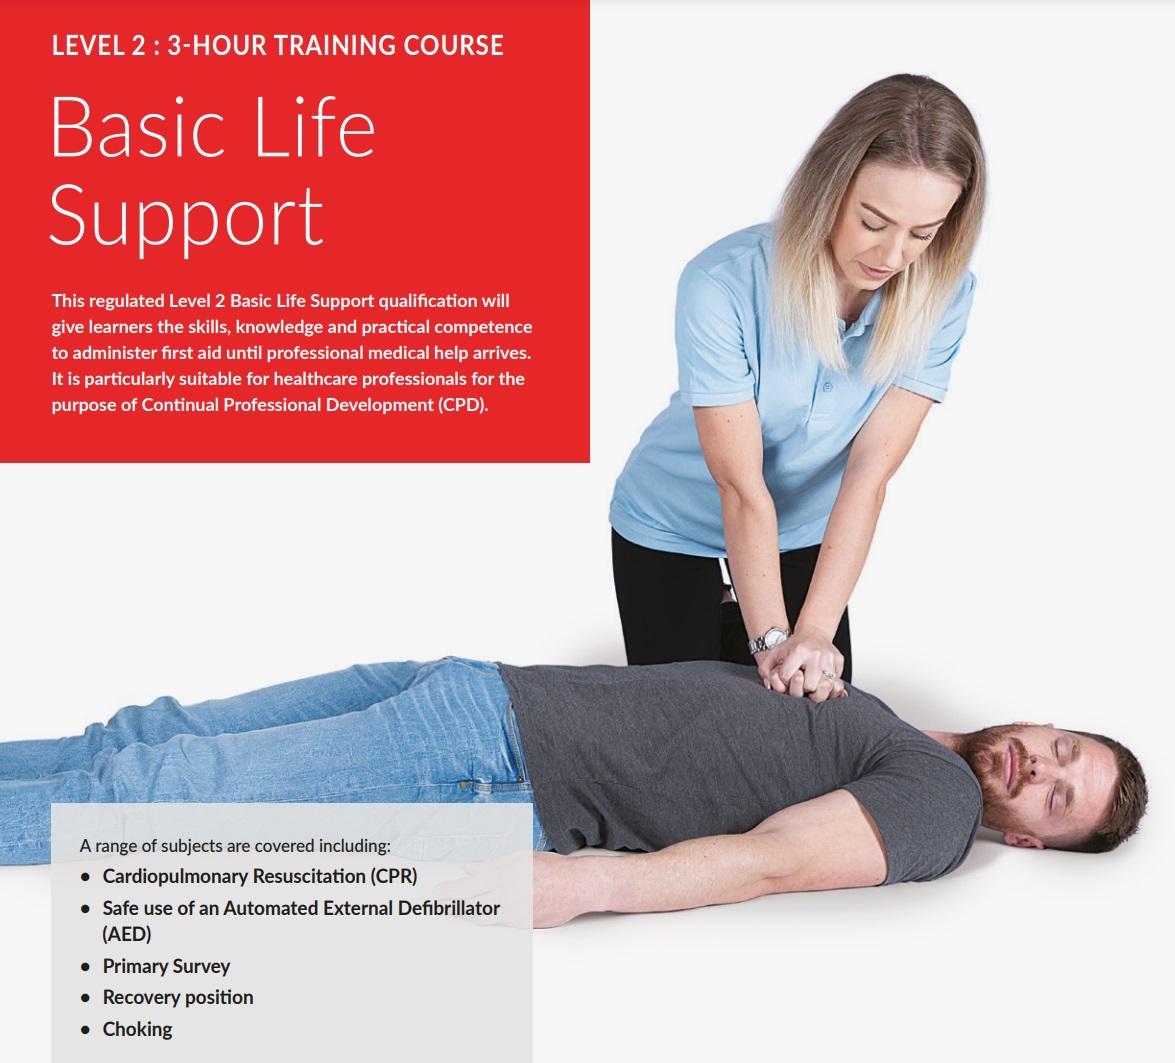
Basic Life Support and Management of Anaphylaxis (RQF)
By BAB Business Group
Anaphylaxis is a severe and life-threatening allergic reaction, which requires immediate medical attention. With the number of sufferers increasing each year, it is extremely important to know what to do when faced with this acute emergency condition. The QA Level 2 Award in Basic Life Support and Management of Anaphylaxis (RQF) qualification has been designed for those who have a specific responsibility at work, at home or in voluntary and community activities, to provide basic life support and manage anaphylaxis when dealing with an emergency. Successful candidates will be able to recognise the signs and symptoms of anaphylaxis, and will be equipped with the vital skills needed to administer safe, prompt and effective treatment.
Tableau Desktop Training - Analyst
By Tableau Training Uk
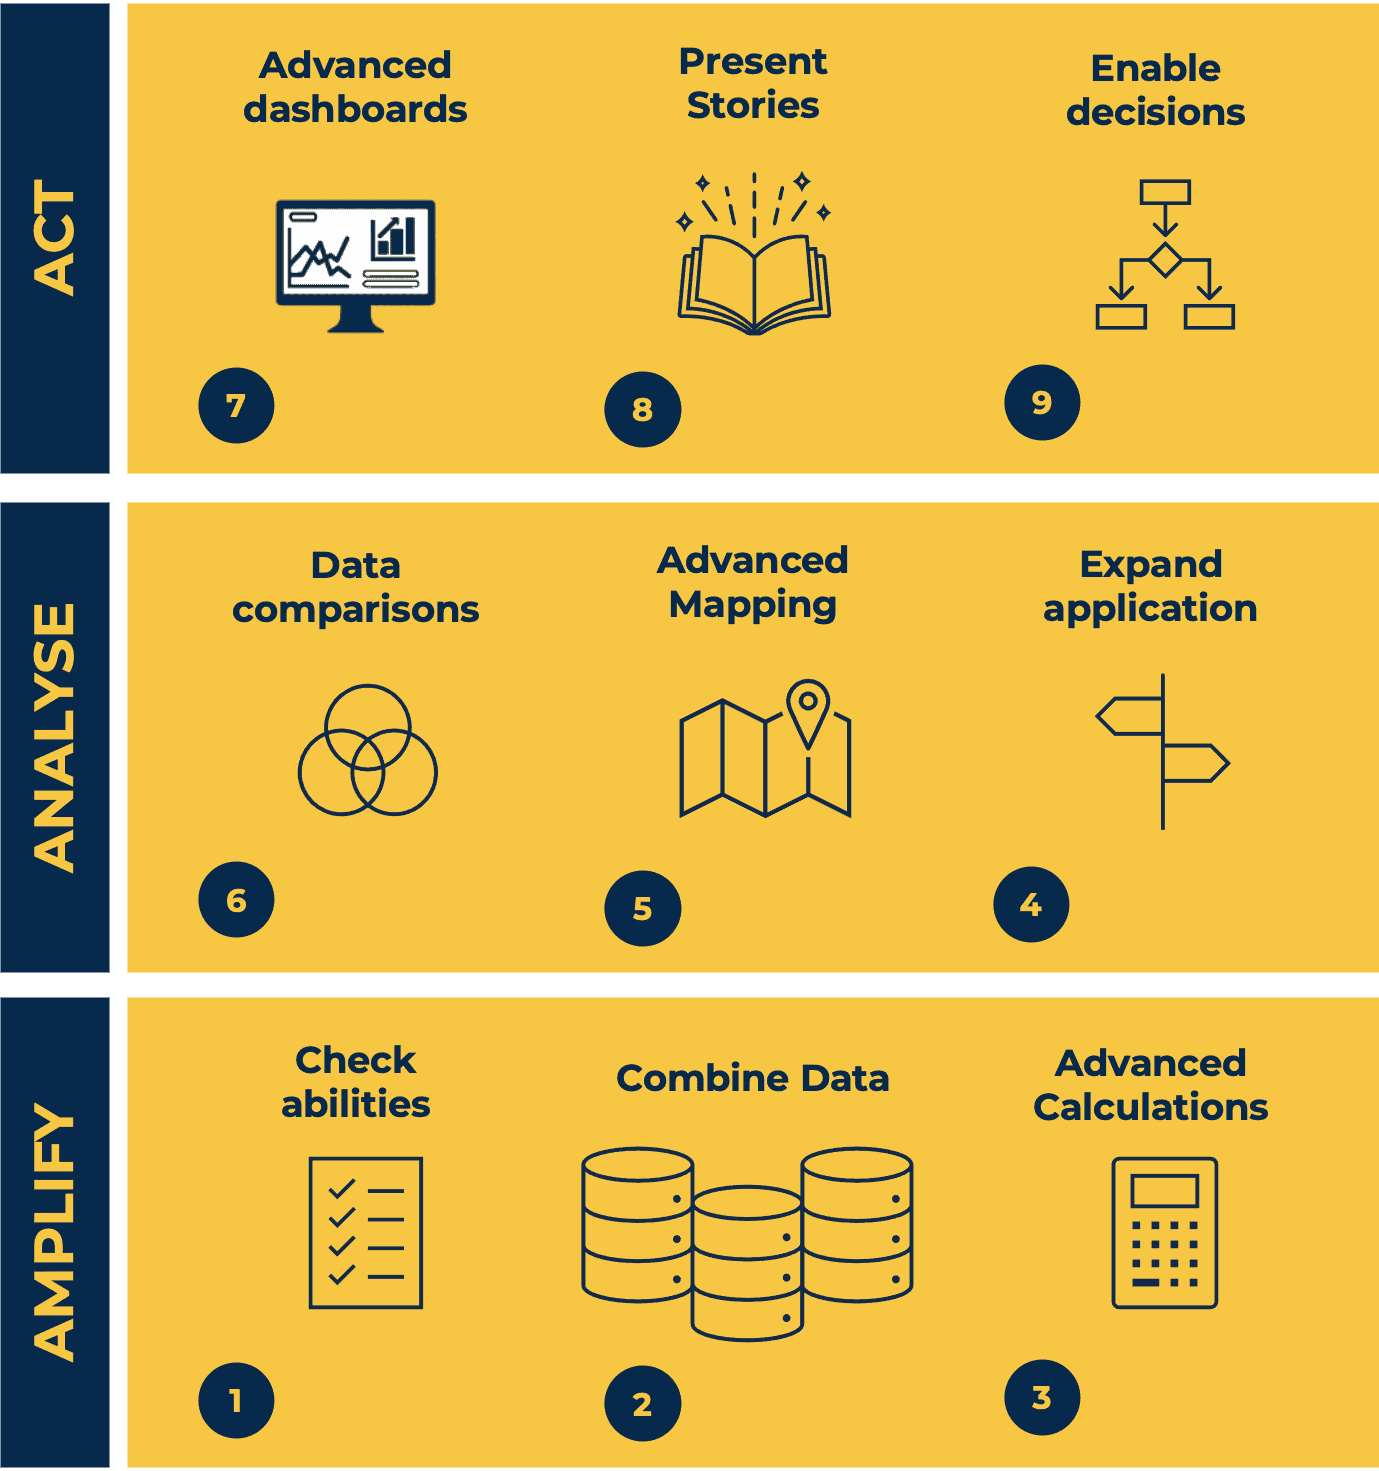
This Tableau Desktop Training intermediate course is designed for the professional who has a solid foundation with Tableau and is looking to take it to the next level. For Private options, online or in-person, please send us details of your requirements: This Tableau Desktop training intermediate course is designed for the professional who has a solid foundation with Tableau and is looking to take it to the next level. Attendees should have a good understanding of the fundamental concepts of building Tableau worksheets and dashboards typically achieved from having attended our Tableau Desktop Foundation Course. At the end of this course you will be able to communicate insights more effectively, enabling your organisation to make better decisions, quickly. The Tableau Desktop Analyst training course is aimed at people who are used to working with MS Excel or other Business Intelligence tools and who have preferably been using Tableau already for basic reporting. The course is split into 3 phases and 9 modules: Phase 1: AMPLIFY MODULE 1: CHECK ABILITIES Revision – What I Should Know What is possibleHow does Tableau deal with dataKnow your way aroundHow do we format chartsHow Tableau deals with datesCharts that compare multiple measuresCreating Tables MODULE 2: COMBINE DATA Relationships Joining Tables – Join Types, Joining tables within the same database, cross database joins, join calculations Blending – How to create a blend with common fields, Custom defined Field relationships and mismatched element names, Calculated fields in blended data sources Unions – Manual Unions and mismatched columns, Wildcard unions Data Extracts – Creating & Editing Data extracts MODULE 3: ADVANCED CALCULATIONS Row Level v Aggregations Aggregating dimensions in calculations Changing the Level of Detail (LOD) of calculations – What, Why, How Adding Table Calculations Phase 2: ANALYSE MODULE 4: EXPAND APPLICATION Making things dynamic with parameters Sets Trend Lines How do we format charts Forecasting MODULE 5: ADVANCED MAPPING Using your own images for spatial analysis Mapping with Spatial files MODULE 6: DATA COMPARISONS Advanced Charts Bar in Bar charts Bullet graphs Creating Bins and Histograms Creating a Box & Whisker plot Phase 3: ACT MODULE 7: ADVANCED DASHBOARDS Using the dashboard interface and Device layout Dashboard Actions and Viz In tooltips Horizontal & Vertical containers Navigate between dashboards MODULE 8: PRESENT STORIES Telling data driven stories MODULE 9: ENABLE DECISIONS What is Tableau Server Publishing & Permissions How can your users engage with content This training course includes over 25 hands-on exercises and quizzes to help participants “learn by doing” and to assist group discussions around real-life use cases. Each attendee receives a login to our extensive training portal which covers the theory, practical applications and use cases, exercises, solutions and quizzes in both written and video format. Students must bring their own laptop with an active version of Tableau Desktop 2018.2 (or later) pre-installed. What People Are Saying About This Course “Course was fantastic, and completely relevant to the work I am doing with Tableau. I particularly liked Steve’s method of teaching and how he applied the course material to ‘real-life’ use-cases.”Richard W., Dashboard Consulting Ltd “This course was extremely useful and excellent value. It helped me formalise my learning and I have taken a lot of useful tips away which will help me in everyday work.” Lauren M., Baillie Gifford “I would definitely recommend taking this course if you have a working knowledge of Tableau. Even the little tips Steve explains will make using Tableau a lot easier. Looking forward to putting what I’ve learned into practice.”Aron F., Grove & Dean “Steve is an excellent teacher and has a vast knowledge of Tableau. I learned a huge amount over the two days that I can immediately apply at work.”John B., Mporium “Steve not only provided a comprehensive explanation of the content of the course, but also allowed time for discussing particular business issues that participants may be facing. That was really useful as part of my learning process.”Juan C., Financial Conduct Authority “Course was fantastic, and completely relevant to the work I am doing with Tableau. I particularly liked Steve’s method of teaching and how he applied the course material to ‘real-life’ use-cases.”Richard W., Dashboard Consulting Ltd “This course was extremely useful and excellent value. It helped me formalise my learning and I have taken a lot of useful tips away which will help me in everyday work.” Lauren M., Baillie Gifford “I would definitely recommend taking this course if you have a working knowledge of Tableau. Even the little tips Steve explains will make using Tableau a lot easier. Looking forward to putting what I’ve learned into practice.”Aron F., Grove & Dean “Steve is an excellent teacher and has a vast knowledge of Tableau. I learned a huge amount over the two days that I can immediately apply at work.”John B., Mporium
Level 2 Award in Principles of Manual Handling (RQF)
By BAB Business Group
Did you know that incorrect manual handling is one of the most common causes of injury at work? The QA Level 2 Award in Principles of Manual Handling (RQF) is a regulated and nationally recognised qualification, designed to cover the basic principles of manual handling. This theory-based qualification is ideal for all employees as it provides candidates with an awareness of safe manual handling practices and the risks of unsafe manual handling. With subjects covered in just half a day, this course is an ideal way to reduce the risk of workplace manual handling injuries, whilst minimising disruption to your organisation’s day to day activities! Please note that this qualification does not include practical sessions. Those requiring practical training should undertake the QA Level 2 Award in Safe Moving and Handling (RQF).
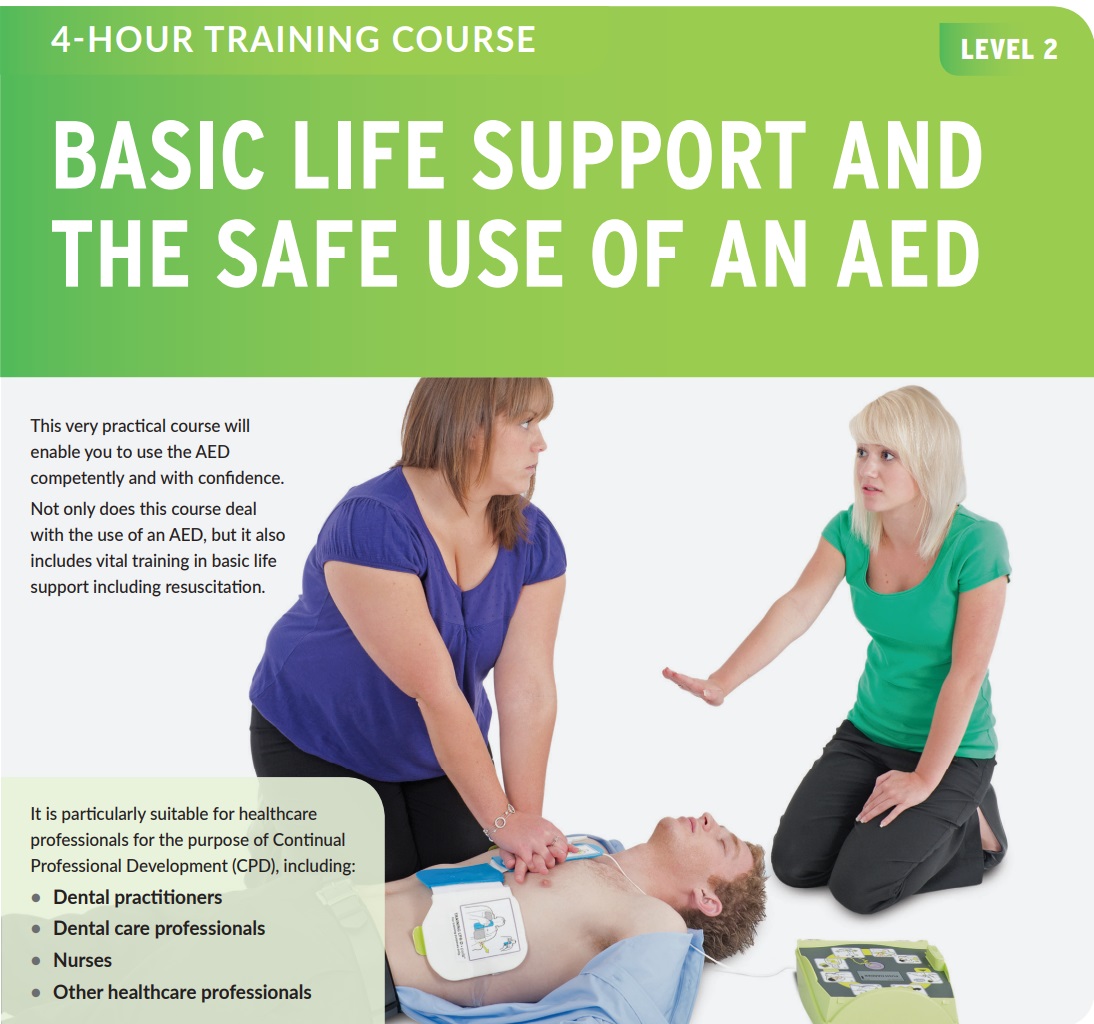
Basic Life Support (BLS) & AED (RQF)
By Emergency Medics
Basic Life Support (BLS) and Safe use of AED training

10 practical ways to save time using ChatGPT and AI tools (In-House)
By The In House Training Company
ChatGPT, along with other AI tools, aims not to replace the human touch in management, but to enhance it. By addressing repetitive, daily tasks, these tools free up managers to concentrate on core responsibilities like strategic decision-making, team development, and innovation. As we move further into the digital age, integrating tools such as ChatGPT isn't a luxury; it's the future of proactive leadership. In this guide, we'll delve into 10 practical ways through which AI can elevate your efficiency and refine the quality of your work. Gain familiarity with prominent AI tools in the market Efficiently compose and respond to emails Generate concise summaries of complex reports and data. Obtain quick insights, data, and research across varied topics Streamline the writing of articles, training notes, and posts Craft interview tests, form relevant questions, and design checklists for the hiring process 1 Streamlining emails An inbox can be a goldmine of information but also a significant time drain for managers. Here's how to optimise it: Drafting responses: Give the AI a brief, and watch it craft a well-structured response. Sorting and prioritising: By employing user-defined rules and keywords, ChatGPT can flag important emails, ensuring no vital communication slips through the cracks. 2 Efficient report writing Reports, especially routine ones, can be time-intensive. Here's a smarter approach: Automate content: Supply key data points to the AI, and let it weave them into an insightful report. Proofreading: Lean on ChatGPT for grammar checks and consistency, ensuring each report remains crisp and error-free. 3 Rapid research From competitor insights to market trends, research is a pivotal part of management. Data synthesis: Feed raw data to the AI and receive succinct summaries in return. Question-answering: Pose specific questions about a dataset to ChatGPT and extract swift insights without diving deep into the entire content. 4 Reinventing recruitment Hiring can be a lengthy process. Here's how to make it more efficient: Resume screening: Equip the AI to spot keywords and qualifications, ensuring that only the most fitting candidates are shortlisted. Preliminary interviews: Leverage ChatGPT for the initial rounds of interviews by framing critical questions and evaluating the responses. 5 Enhancing training Especially for extensive teams, training can be a monumental task. Here's how ChatGPT can assist: Customised content: Inform the AI of your training goals, and it will draft tailored content suitable for various roles. PowerPoint design: Create visually appealing slide presentations on any topic in minimal time.


Data Analysis and Visualization with Microsoft Excel
By Mpi Learning - Professional Learning And Development Provider
This course is designed for students who already have foundational knowledge and skills in Excel and who wish to perform robust and advanced data and statistical analysis with Microsoft Excel using PivotTables, use tools such as Power Pivot and the Data Analysis ToolPak to analyze data and visualize data and insights using advanced visualizations in charts and dashboards in Excel.