- Professional Development
- Medicine & Nursing
- Arts & Crafts
- Health & Wellbeing
- Personal Development
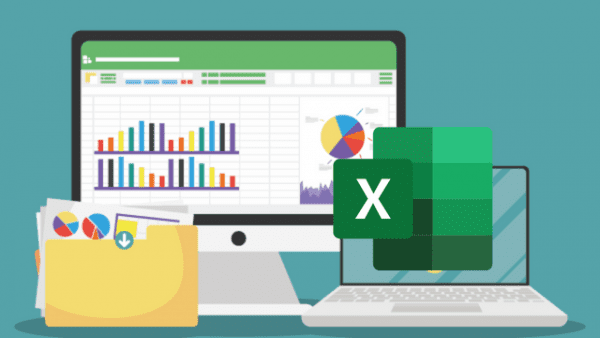
136 Excel Analytics courses in Nottingham delivered Online
55125 Quick SQL Server Analysis Services
By Nexus Human
Duration 2 Days 12 CPD hours This course is intended for This course is intended for SQL professionals, Microsoft Analysis Services cube and report developers, and business intelligence professionals. Overview ?Understand common Analysis Services solutions.?Understand version changes of SSAS from 2008-2014.?Understand Analysis Services installation and architecture.?Understand how to choose the right model.?Understand the Analysis Services tools available.?Understand the multidimensional model.?Utilize data sources and data source views.?Create a cube.?Understand and utilize dimensions.?Understand and utilize attributes.?Understand and utilize relationships.?Understand and utilize hierarchies.?Understand and utilize measures and measure groups.?Understand and utilize calculated members.?Understand and utilize perspectives.?Understand and utilize translations.?Browse perspectives and translations.?Understand and utilize deployment options.?Understand and utilize processing strategies.?Understand and utilize security.?Deploy a multidimensional model.?Understand the tabular model.?Create a tabular project.?Analyze the data using Microsoft Excel.?Create and configure calculated measures and calculated fields.?Backup and Restore. This course is intended for IT professionals who are interested in quickly learning how to utilize an Analysis Services multidimensional or tabular solution. Course Overview Introduction Course Materials Facilities Prerequisites What We'll Be Discussing Lab 1: Course Overview Introduction to Microsoft SQL Server Analysis Services Common Analysis Services Solutions Version Changes of SSAS from 2008-2014 Analysis Services Installation and Architecture: One Product, Two Models Choosing the Right Model Analysis Services Tools Lab 1: Introduction to Microsoft SQL Server Analysis Services The Multidimensional Solution Understanding the Multidimensional Model Utilizing Data Sources and Data Source Views Creating a Cube Lab 1: The Multidimensional Solution Dissecting with Dimensions Developing Dimensions Utilizing Attributes Relating with Relationships Handling Hierarchies Lab 1: Dissecting with Dimensions Managing Measures Measures and Measure Groups Calculated Members Lab 1: Managing Measures Configuring Cube Options Understanding Perspectives Utilizing Translations Browsing Perspectives and Translations Lab 1: Configuring Cube Options Deploying Examining Deployment Options Processing Strategies Exploring Security Lab 1: Deploying The Tabular Solution Understanding the Tabular Model Creating a Tabular Project Deploying Browsing the Model Querying the Solution and Understanding DAX Maintaining and Optimizing Lab 1: The Tabular Solution

B6158 IBM Cognos Analytics - Author Reports Fundamentals (v11.0.x)
By Nexus Human
Duration 3 Days 18 CPD hours This course is intended for Report Authors Overview What is IBM Cognos Analytics ? Reporting Examine dimensionally modelled and dimensional data sources Examine personal data sources and data modules Examine List reports Aggregate measure/fact data Use shared dimensions to create multi-fact queries Add repeated information to reports Create crosstab reports Create complex crosstab reports Format, sort, and aggregate data in a crosstab report Create discontinuous crosstab reports Create Visualization reports Add business logic to reports using IBM Cognos Analytics ? Reporting Focus reports using filters Focus reports using prompts Augment reports using calculations Extend report functionality in IBM Cognos Analytics - Reporting Customize reports with conditional formatting Conditionally format one crosstab measure based on another Drill-through definitions Enhance the report layout Use additional report building techniques This offering provides Business and Professional Authors with an introduction to report building techniques using relational data models. Techniques to enhance, customize, and manage professional reports will be explored. Activities will illustrate and reinforce key concepts during this learning opportunity. What is IBM Cognos Analytics - Reporting? Create a simple list report Create a report from a dimensionally modeled relational data source Examine personal data sources and data modules Upload personal data Upload custom images Use navigation paths Create a report from a personal data source Examine list reports Group data in a list Format columns in a list Include headers and footers in a list Enhance a list report Aggregate measure/fact data Identify differences in aggregation Explore data aggregation Use shared dimensions to create multi-fact queries Create a multi-fact query in a list report Add repeated information to reports Create a mailing list report Create crosstab reports Add measures to a crosstab Data sources for a crosstab Create a simple crosstab report Create complex crosstab reports Add items as peers Create crosstab nodes and crosstab members Create a complex crosstab report Format, sort, and aggregate data in a crosstab Sort, format, and aggregate a crosstab report Create discontinuous crosstab reports Present unrelated items using a discontinuous crosstab Create a visualization report Create and format a visualization report Create a report that uses a Map visualization Show the same data graphically and numerically Focus reports using filters Apply filters to a report Apply a detail filter on fact data in a report Apply a summary filter to a report Focus reports using prompts Create a prompt by adding a parameter Add a value prompt to a report Add a Select & search prompt to a report Create a cascading prompt Augment reports using calculations Add calculations to a report Display prompt selections in the report title Customize reports with conditional formatting Create a multilingual report Highlight exceptional data and conditionally render a column Drill-through definitions Let users navigate to related data in IBM Cognos Analytics Enhance report layout Create a report structured on data items Create a condensed list report Use additional report building techniques Section a report and reuse objects within the same report Reuse layout components in a different report Explore options for reports that contain no data Additional course details: Nexus Humans B6158 IBM Cognos Analytics - Author Reports Fundamentals (v11.0.x) training program is a workshop that presents an invigorating mix of sessions, lessons, and masterclasses meticulously crafted to propel your learning expedition forward. This immersive bootcamp-style experience boasts interactive lectures, hands-on labs, and collaborative hackathons, all strategically designed to fortify fundamental concepts. Guided by seasoned coaches, each session offers priceless insights and practical skills crucial for honing your expertise. Whether you're stepping into the realm of professional skills or a seasoned professional, this comprehensive course ensures you're equipped with the knowledge and prowess necessary for success. While we feel this is the best course for the B6158 IBM Cognos Analytics - Author Reports Fundamentals (v11.0.x) course and one of our Top 10 we encourage you to read the course outline to make sure it is the right content for you. Additionally, private sessions, closed classes or dedicated events are available both live online and at our training centres in Dublin and London, as well as at your offices anywhere in the UK, Ireland or across EMEA.
Advanced Analytics with Python
By Nexus Human
Duration 3 Days 18 CPD hours This course is intended for Before taking this course delegates should already be familiar with basic analytics techniques, comfortable with basic data manipulation tools such as spreadsheets and databases and already familiar with at least one programming language Overview This course teaches delegates who are already familiar with analytics techniques and at least one programming language how to effectively use the programming language for three tasks: data manipulation and preparation, statistical analysis and advanced analytics (including predictive modelling and segmentation). Mastery of these techniques will allow delegates to immediately add value in their work place by extracting valuable insight from company data to allow better, data-driven decisions. Outcomes: After completing the course, delegates will be capable of writing production-ready R code to perform advanced analytics tasks enabling their organisations make better, data-driven decisions. Becoming a world class data analytics practitioner requires mastery of the most sophisticated data analytics tools. These programming languages are some of the most powerful and flexible tools in the data analytics toolkit. Topic 1 Intro to our chosen language Topic 2 Basic programming conventions Topic 3 Data structures Topic 4 Accessing data Topic 5 Descriptive statistics Topic 6 Data visualisation Topic 7 Statistical analysis Topic 8 Advanced data manipulation Topic 9 Advanced analytics ? predictive modelling Topic 10 Advanced analytics ? segmentation
Introduction to Salesforce.com Analytics - Building Reports and Dashboards
By Nexus Human
Duration 1 Days 6 CPD hours This course is intended for New administrators, business analysts or report writers who are new to creating reports or dashboards within Salesforce. Overview A student in this class will learn the basic Salesforce object model, and how to create and secure reports and dashboards. The instructor will lead students through exercises to create tabular, summary, matrix and join reports. Students will learn advanced reporting functionality such as charting, report summary fields, bucket fields, conditional highlighting, advanced report filters and building custom report types. Finally, the student will learn how to create and run dashboards and schedule and email reports and dashboards. This course is specifically designed to teach administrators, business analysts or report writers how to utilize the basic and advanced analytic capabilities of Salesforce. Introductions / Login to Training OrgsOverview of Salesforce Object ModelTabular, Summary, Matrix, Join ReportsCharts, Bucket Fields, Report Summary Fields, Conditional HighlightingCustom Report TypesDashboardsReport & Dashboard Scheduling Additional course details: Nexus Humans Introduction to Salesforce.com Analytics - Building Reports and Dashboards training program is a workshop that presents an invigorating mix of sessions, lessons, and masterclasses meticulously crafted to propel your learning expedition forward. This immersive bootcamp-style experience boasts interactive lectures, hands-on labs, and collaborative hackathons, all strategically designed to fortify fundamental concepts. Guided by seasoned coaches, each session offers priceless insights and practical skills crucial for honing your expertise. Whether you're stepping into the realm of professional skills or a seasoned professional, this comprehensive course ensures you're equipped with the knowledge and prowess necessary for success. While we feel this is the best course for the Introduction to Salesforce.com Analytics - Building Reports and Dashboards course and one of our Top 10 we encourage you to read the course outline to make sure it is the right content for you. Additionally, private sessions, closed classes or dedicated events are available both live online and at our training centres in Dublin and London, as well as at your offices anywhere in the UK, Ireland or across EMEA.
Tableau Advanced v10.3
By Nexus Human
Duration 2 Days 12 CPD hours This course is intended for This course is intended for those who need to use Tableau Desktop to build complex visuals and dashboards to present information or to monitor data about their organization. Overview Upon completion of this course, participants will be able to:Select the best method to work with multiple data sourcesCreate complex visuals using calculations and parametersApply best practices to improve the layout and aesthetics of dashboards This course enables participants to create complex visualizations and to combine them into interactive dashboards to share with others using Tableau Desktop. The Data Data Interpreter Data Joins Same Database Cross Databases Spatial Join New! Data Blending New Union Custom SQL Tableau Extract TDE Hyper Clipboard Database Changes Automatic Updates Calculations Regular Calculations Quick Table Calculations Table Calculations Level of Detail (LOD) Expressions Complex Visualizations Custom Background Map Web Map Servers Dual Maps Bar in Bar Graph Bullet Graph Pareto Chart Sparkline Report Top N Within a Category Report Waterfall Chart Funnel Chart Pattern Analysis using the Path Shelf Building Better Dashboards Best Practices for Design Best Practices for Performance Creating a Template Workbook Using Layout Containers Dashboard Extenders New! Generating A Performance Summary Additional course details: Nexus Humans Tableau Advanced v10.3 training program is a workshop that presents an invigorating mix of sessions, lessons, and masterclasses meticulously crafted to propel your learning expedition forward. This immersive bootcamp-style experience boasts interactive lectures, hands-on labs, and collaborative hackathons, all strategically designed to fortify fundamental concepts. Guided by seasoned coaches, each session offers priceless insights and practical skills crucial for honing your expertise. Whether you're stepping into the realm of professional skills or a seasoned professional, this comprehensive course ensures you're equipped with the knowledge and prowess necessary for success. While we feel this is the best course for the Tableau Advanced v10.3 course and one of our Top 10 we encourage you to read the course outline to make sure it is the right content for you. Additionally, private sessions, closed classes or dedicated events are available both live online and at our training centres in Dublin and London, as well as at your offices anywhere in the UK, Ireland or across EMEA.
Advanced Tableau
By Nexus Human
Duration 2.5 Days 15 CPD hours This course is intended for This course is intended for those with a basic understanding of Tableau who want to pursue mastery of the advanced features. Overview The goal of this course is to present essential Tableau concepts and its advanced functionalities to help better prepare and analyze data. This course will use Tableau Hyper, Tableau Prep and more. Getting Up to Speed ? a Review of the Basics Connecting Tableau to your data Connecting to Tableau Server Connecting to saved data sources Measure Names and Measure Values Three essential Tableau concepts Exporting data to other devices Summary All About Data ? Getting Your Data Ready Data mining and knowledge discovery process models CRISP?DM All About Data ? Joins, Blends, and Data Structures All About Data - Joins, Blends, and Data Structures Introduction to joins Introduction to complex joins Exercise: observing join culling Introduction to join calculations Introduction to spatial joins Introduction to unions Understanding data blending Order of operations No dimensions from a secondary source Introduction to scaffolding Introduction to data structures Exercise: adjusting the data structure for different questions Summary Table Calculations Table Calculations A definition and two questions Introduction to functions Directional and non-directional table calculations Application of functions Summary Level of Detail Calculations Level of Detail Calculations Building playgrounds Playground I: FIXED and EXCLUDE Playground II: INCLUDE Practical application Exercise: practical FIXED Exercise: practical INCLUDE Exercise: practical EXCLUDE Summary Beyond the Basic Chart Types Beyond the Basic Chart Types Improving popular visualizations Custom background images Tableau extensions Summary Mapping Mapping Extending Tableau's mapping capabilities without leaving Tableau Extending Tableau mapping with other technology Exercise: connecting to a WMS server Exploring the TMS file Exploring Mapbox Accessing different maps with a dashboard Creating custom polygons Converting shape files for Tableau Exercise: polygons for Texas Heatmaps Summary Tableau for Presentations Tableau for Presentations Getting the best images out of Tableau From Tableau to PowerPoint Embedding Tableau in PowerPoint Animating Tableau Story points and dashboards for Presentations Summary Visualization Best Practices and Dashboard Design Visualization Best Practices and Dashboard Design Visualization design theory Formatting rules Color rules Visualization type rules Compromises Keeping visualizations simple Dashboard design Dashboard layout Sheet selection Summary Advanced Analytics Advanced Analytics Self-service Analytics Use case ? Self-service Analytics Use case ? Geo-spatial Analytics Summary Improving Performance Improving Performance Understanding the performance-recording dashboard Exercise: exploring performance recording in Tableau desktop Performance-recording dashboard events Behind the scenes of the performance- recording dashboard Hardware and on-the-fly techniques Hardware considerations On-the-fly-techniques Single Data Source > Joining > Blending Three ways Tableau connects to data Using referential integrity when joining Advantages of blending Efficiently working with data sources Tuning data sources Working efficiently with large data sources Intelligent extracts Understanding the Tableau data extract Constructing an extract for optimal performance Exercise: summary aggregates for improved performance Optimizing extracts Exercise: materialized calculations Using filters wisely Extract filter performance Data source filter performance Context filters Dimension and measure filters Table-calculation filters Efficient calculations Boolean/Numbers > Date > String Additional performance considerations Avoid overcrowding a dashboard Fixing dashboard sizing Setting expectations Summary Additional course details: Nexus Humans Advanced Tableau training program is a workshop that presents an invigorating mix of sessions, lessons, and masterclasses meticulously crafted to propel your learning expedition forward. This immersive bootcamp-style experience boasts interactive lectures, hands-on labs, and collaborative hackathons, all strategically designed to fortify fundamental concepts. Guided by seasoned coaches, each session offers priceless insights and practical skills crucial for honing your expertise. Whether you're stepping into the realm of professional skills or a seasoned professional, this comprehensive course ensures you're equipped with the knowledge and prowess necessary for success. While we feel this is the best course for the Advanced Tableau course and one of our Top 10 we encourage you to read the course outline to make sure it is the right content for you. Additionally, private sessions, closed classes or dedicated events are available both live online and at our training centres in Dublin and London, as well as at your offices anywhere in the UK, Ireland or across EMEA.
Unlock the power of data with our 'Sales Analysis in Excel' course. Dive into e-commerce sales analysis and craft insightful sales analysis reports. Discover how to manipulate sales data, forecast trends, and automate workbook functionality. Elevate your career with advanced Excel skills! Learning Outcomes of Sales Analysis in Excel: Master data manipulation techniques for e-commerce sales analysis. Create comprehensive sales reports with Excel's advanced functions. Visualize data effectively using charts, PivotTables, and PivotCharts. Forecast future trends and make data-driven decisions. Automate repetitive tasks to boost efficiency and productivity. Why buy this Sales Analysis in Excel? Unlimited access to the course for forever Digital Certificate, Transcript, student ID all included in the price Absolutely no hidden fees Directly receive CPD accredited qualifications after course completion Receive one to one assistance on every weekday from professionals Immediately receive the PDF certificate after passing Receive the original copies of your certificate and transcript on the next working day Easily learn the skills and knowledge from the comfort of your home Certification After studying the course materials of the Sales Analysis in Excel there will be a written assignment test which you can take either during or at the end of the course. After successfully passing the test you will be able to claim the pdf certificate for £5.99. Original Hard Copy certificates need to be ordered at an additional cost of £9.60. Who is this course for? Business analysts seeking to enhance their data analysis skills. Sales professionals aiming to leverage Excel for deeper insights. Aspiring data scientists interested in e-commerce sales data. Students and graduates looking to gain a competitive edge. Entrepreneurs striving to optimize their sales strategies. Prerequisites This Sales Analysis in Excel does not require you to have any prior qualifications or experience. You can just enrol and start learning.This Sales Analysis in Excel was made by professionals and it is compatible with all PC's, Mac's, tablets and smartphones. You will be able to access the course from anywhere at any time as long as you have a good enough internet connection. Career path Data Analyst: £25,000 - £40,000 Per Annum Business Analyst: £30,000 - £50,000 Per Annum Sales Analyst: £25,000 - £45,000 Per Annum Financial Analyst: £30,000 - £55,000 Per Annum Market Research Analyst: £25,000 - £40,000 Per Annum Excel Specialist: £22,000 - £35,000 Per Annum Course Curriculum Modifying a Worksheet Insert, Delete, and Adjust Cells, Columns, and Rows 00:10:00 Search for and Replace Data 00:09:00 Use Proofing and Research Tools 00:07:00 Managing Workbooks Manage Worksheets 00:05:00 Manage Workbook and Worksheet Views 00:07:00 Manage Workbook Properties 00:06:00 Working with Functions Work with Ranges 00:18:00 Use Specialized Functions 00:11:00 Work with Logical Functions 00:23:00 Work with Date & Time Functions 00:08:00 Work with Text Functions 00:11:00 Working with Lists Sort Data 00:10:00 Filter Data 00:10:00 Query Data with Database Functions 00:09:00 Outline and Subtotal Data 00:09:00 Analyzing Data Welcome to the Course 00:03:00 Apply Intermediate Conditional Formatting 00:07:00 Apply Advanced Conditional Formatting 00:05:00 Visualizing Data with Charts Create Charts 00:13:00 Modify and Format Charts 00:12:00 Use Advanced Chart Features 00:12:00 Using PivotTables and PivotCharts Create a PivotTable 00:13:00 Analyze PivotTable Data 00:12:00 Present Data with PivotCharts 00:07:00 Filter Data by Using Timelines and Slicers 00:11:00 Working with Multiple Worksheets and Workbooks Use Links and External References 00:12:00 Use 3-D References 00:06:00 Consolidate Data 00:05:00 Creating Sparklines and Mapping Data Create Sparklines 00:07:00 MapData 00:07:00 Forecasting Data Determine Potential Outcomes Using Data Tables 00:08:00 Determine Potential Outcomes Using Scenarios 00:09:00 Use the Goal Seek Feature 00:04:00 Forecasting Data Trends 00:05:00 Using Lookup Functions and Formula Auditing Use Lookup Functions 00:13:00 Trace Cells 00:09:00 Watch and Evaluate Formulas 00:08:00 Automating Workbook Functionality Apply Data Validation 00:13:00 Search for Invalid Data and Formulas with Errors 00:04:00 Work with Macros 00:18:00

From business to research, having a solid grasp of Excel Data analysis can open doors of opportunity in various industries. Learn this valuable skill set from the comfort of your home with the Data Analysis In Excel course. This course will introduce you to the ins and outs of Excel data analysis. This Data Analysis In Excel course will help you establish a solid foundation in Excel data analysis. This course will help you pick up the skills to visualise data with charts in Excel. Here, you will also learn about Pivot Tables and Charts. Furthermore, the course will teach you how to work with multiple Workbooks. In addition, you will learn about Lookup factions and how to use them. By the end of this course, you will know the essentials of automating Workbook functionality. This course will assist you in securing effective data analysis skills. In addition, you will receive a QLS-endorsed certificate of achievement. This certificate will enhance your employability in the relevant job market. Join now! Learning Outcomes Understand the basic principles of data analysis with Excel Learn how to visualise data with Excel charts Build your expertise in using Pivot Tables and Charts Grasp the techniques of working with multiple Worksheets and Workbooks Know the process of automating Workbook functionality Certificate of Achievement Endorsed Certificate of Achievement from the Quality Licence Scheme Upon successful completion of the final assessment, you will be eligible to apply for the Quality Licence Scheme Endorsed Certificate of achievement. This certificate will be delivered to your doorstep through the post for £99. An extra £10 postage charge will be required for students leaving overseas. CPD Accredited Certificate After the successful completion of the final assessment, you will receive a CPD-accredited certificate of achievement. The PDF certificate is for 9.99, and it will be sent to you immediately after through e-mail. You can get the hard copy for 15.99, which will reach your doorsteps by post. Method of Assessment At the end of the course, there will be an MCQ assessment. In order to pass this exam, you must score at least 60%. When you submit the assessment, it will be examined, and the results will be given to you immediately. Career path This course is designed to help you extant your knowledge and understanding of this sector. After completing the course, you will be able to explore career options such as Data Analyst Research Assistant Researcher Business Analyst