- Professional Development
- Medicine & Nursing
- Arts & Crafts
- Health & Wellbeing
- Personal Development
3093 Engineering courses delivered Online
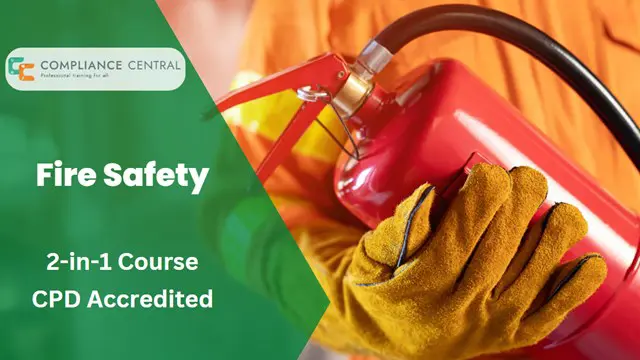
Fire Safety - Emergency Training
By Compliance Central
Fire Safety course is for those who want to advance in this field. Throughout this course, you will learn the essential skills and gain the knowledge needed to become well versed in Fire Safety. Our course starts with the basics of Fire Safety and gradually progresses towards advanced topics. Therefore, each lesson of this Fire Safety is intuitive and easy to understand. So, stand out in the job market by completing the Fire Safety course. Get an accredited certificate and add it to your resume to impress your employers. Along with the Fire Safety course, you also get: Lifetime Access Unlimited Retake Exam & Tutor Support Easy Accessibility to the Course Materials- Anytime, Anywhere - From Any Smart Device (Laptop, Tablet, Smartphone Etc.) 100% Learning Satisfaction Guarantee The Courses You Get When You Enrol In This Fire Safety & Construction Bundle: Course 01: Fire Safety & Prevention Course 02: Construction Site Safety Course Learn at your own pace from the comfort of your home, as the rich learning materials of this course are accessible from any place at any time. The curriculums are divided into tiny bite-sized modules by industry specialists. And you will get answers to all your queries from our experts. So, enrol and excel in your career with Compliance Central. Course Curriculum Fire Safety & Prevention Module 01: Electrical, Fire and Gas Safety Module 02: Measures of Fire Safety Module 03: Fire Emergency: Evacuation Procedures Module 04: The Fire Plan and Safety Arrangements Construction Site Safety Course Module 1: Health and Safety at Work and the Laws Module 2: Site Management Module 3: Risk and Value Management Module 4: Communications, Information and Documentation of Construction Module 5: Health and Safety in Construction Management Module 6: Managing for Health and Safety Module 7: Introduction and Basics Module 8: Safety Precautions Module 9: Electrical Incidents Module 10: Reducing and Controlling Risks Module 11: Introduction, Regulations and Duties Module 12: Assessment and Prevention of the Risks Module 13: Work at Height Equipment Module 14: Working in Confined Spaces and the Laws Module 15: Risk Assessment Module 16: Control Measures Module 17: Emergency Procedures Who is this course for? Anyone from any background can enrol in this Fire Safety course. Requirements To enrol in this Fire Safety course, all you need is a basic understanding of the English Language and an internet connection. Career path After completing this course, you can explore trendy and in-demand jobs related to Fire Safety. Certificates CPD Accredited PDF Certificate Digital certificate - Included 2 CPD Accredited PDF Certificates for Free CPD Accredited Hard Copy Certificate Hard copy certificate - £9.99 CPD Accredited Hard Copy Certificate for £9.99 each. Delivery Charge: Inside the UK: Free Outside of the UK: £9.99
Fire Safety and Equipment Course
By Training Tale
Fire Safety and Equipment Course Online This Fire Safety and Equipment Course was designed to teach employees about the hazards of workplace fires. It goes into the causes of fire in great detail and what fire safety precautions and evacuation processes your company should have in place. The Fire Safety and Equipment Course is structured into modules and submodules to make it easier for learners to grasp the concept, beginning with essential information and progressing to the most advanced level. The course covers both theoretical and practical aspects of all aspects of fire safety. It is critical to be aware of fire safety in the workplace, not only to comply with the law but also to keep people safe. It is everyone's responsibility to help prevent fires from starting and properly evacuate if required. This course will provide you with the knowledge you need to achieve these requirements. So, enrol on this Fire Safety and Equipment Course now and start learning instantly! Other courses are included with Fire Safety and Equipment Bundle Course Course 01: Level 2 Fire Safety Course 02: Workplace First Aid Training Course 03: Level 5 Health and Safety at Work Others Benefits of this Fire Safety and Equipment Course Free 3 PDF Certificate Lifetime Access Free Retake Exam Tutor Support [ Note: Free PDF certificate as soon as completing the Fire Safety and Equipment Course] Fire Safety and Equipment Course Course Curriculum of Fire Safety and Equipment Course Module 01: Introduction to Fire Safety Module 02: Fires in the Workplace Module 03: Fire Hazards Module 04: Fire Spread Module 05: Fire Safety Standards Module 06: Protecting People and Property Module 07: Methods of Extinguishing Fires Module 08: Fixed Fire Fighting Instructions Module 09: Fire Risk Assessments Module 10: Fire Procedures Module 11: Action in the Event of Fire Module 12: Role of the Fire Warden Assessment Method of Fire Safety and Equipment Course After completing each module of the Fire Safety and Equipment Course, you will find automated MCQ quizzes. To unlock the next module, you need to complete the quiz task and get at least 60% marks. Certification of Fire Safety and Equipment Course After completing the MCQ/Assignment assessment for this Fire Safety and Equipment Course, you will be entitled to a Certificate of Completion from Training Tale. The certificate is in PDF format, which is completely free to download. A printed version is also available upon request. It will also be sent to you through a courier for £13.99. Who is this course for? Fire Safety and Equipment Course Fire Safety and Equipment Course is suitable for: Students, Graduates, Trainees, Professionals, Students, Tutors, Executives, Home scholars, Beginners, Experts, Job Seekers, People with a passion for personal development! Requirements Fire Safety and Equipment Course There are no specific requirements for Fire Safety and Equipment Course because it does not require any advanced knowledge or skills. Career path Fire Safety and Equipment Course Whether you want to enhance or start, the Fire Safety and Equipment Course will make pursuing a career in fire safety easier. So, express your expertise, distinguish yourself from the competition, and succeed! Certificates Certificate of completion Digital certificate - Included

Heating, Ventilation & Air Conditioning (HVAC) Technician- CPD Certified
(5)By Online Training Academy
Heating, Ventilation & Air Conditioning (HVAC) Technicians play a pivotal role in maintaining indoor air quality and ensuring optimal comfort levels in various settings, making them indispensable in the modern world. With a growing emphasis on energy efficiency and environmental sustainability, the demand for skilled Heating, Ventilation & Air Conditioning (HVAC) technicians continues to rise. Job opportunities for Heating, Ventilation & Air Conditioning (HVAC) technicians in the UK are abundant, driven by a surge in construction projects, residential developments, and commercial ventures. According to recent data, the average salary for HVAC technicians in the UK ranges from £25,000 to £35,000 per year, Despite economic fluctuations, the Heating, Ventilation & Air Conditioning (HVAC) sector in the UK remains resilient, with sustained growth projected in response to evolving regulations and consumer preferences. The increasing focus on indoor air quality, energy efficiency standards, and climate control measures ensures a steady demand for skilled Heating, Ventilation & Air Conditioning (HVAC) technicians. Key Features: This Heating, Ventilation & Air Conditioning (HVAC) Technician Course Includes: This HVAC Technician Course is CPD Certified Free Certificate Developed by Specialist Lifetime Access Course Curriculum Heating, Ventilation & Air Conditioning (HVAC) Technician: Module 01: Fundamentals of Heating, Ventilation & Air Conditioning (HVAC) Module 02: Principles of Heating and Psychrometrics Module 03: HVAC System Varieties Module 04: Heating and Ventilation Techniques Module 05: Air Conditioning Systems for HVAC Professionals Module 06: Compressors, Water Chillers, and Fan Operations Module 07: Piping for HVAC Specialists Module 08: Duct System Design in HVAC Module 09: Refrigeration Principles and Refrigerants Module 10: Specialised Applications in HVAC Module 11: HVAC System Selection Criteria Module 12: Safety Protocols in the HVAC Industry Learning Outcomes: Demonstrate understanding of Heating, Ventilation & Air Conditioning (HVAC) fundamentals for practical system applications. Apply principles of heating and psychrometrics in Heating, Ventilation & Air Conditioning (HVAC) system configurations. Identify and differentiate various Heating, Ventilation & Air Conditioning (HVAC) system types and their functionalities. Implement heating and ventilation techniques for efficient environmental control systems. Analyse air conditioning systems, compressors, water chillers, and fan operations. Design duct systems and piping, adhering to safety and industry protocols. Certification After completing this Heating, Ventilation & Air Conditioning (HVAC) Technician course, you will get a free Certificate. CPD 10 CPD hours / points Accredited by The CPD Quality Standards (CPD QS) Who is this course for? This Heating, Ventilation & Air Conditioning (HVAC) Technician course is accessible to anyone eager to learn more about this topic. Through this course, you'll gain a solid understanding of Heating, Ventilation & Air Conditioning (HVAC). Moreover, this course is ideal for: Individuals aspiring to Heating, Ventilation & Air Conditioning (HVAC) technician roles. Maintenance personnel seeking Heating, Ventilation & Air Conditioning (HVAC) system knowledge. Engineers interested in expanding Heating, Ventilation & Air Conditioning (HVAC) design expertise. Building management professionals enhancing Heating, Ventilation & Air Conditioning (HVAC) operation understanding. Construction industry workers pursuing Heating, Ventilation & Air Conditioning (HVAC) system specialisation. Requirements There are no requirements needed to enrol into this Heating, Ventilation & Air Conditioning (HVAC) Technician course. We welcome individuals from all backgrounds and levels of experience to enrol into this Heating, Ventilation & Air Conditioning (HVAC) Technician course. Career path After finishing the Heating, Ventilation & Air Conditioning course there will be multiple job opportunities for you. Some of the Job sectors of Heating, Ventilation & Air Conditioning (HVAC) are: HVAC Technician - £25K to 35K/year HVAC Engineer - £30K to 45K/year Refrigeration Specialist - £28K to 40K/year HVAC System Designer - £35K to 50K/year Air Conditioning Technician - £22K to 32K/year Certificates Digital certificate Digital certificate - Included Certificate of Completion Digital certificate - Included Will be downloadable when all lectures have been completed.
Heating, Ventilation & Air Conditioning (HVAC) Technician- CPD Certified
(5)By Online Training Academy
Heating, Ventilation & Air Conditioning (HVAC) Technicians play a pivotal role in maintaining indoor air quality and ensuring optimal comfort levels in various settings, making them indispensable in the modern world. With a growing emphasis on energy efficiency and environmental sustainability, the demand for skilled Heating, Ventilation & Air Conditioning (HVAC) technicians continues to rise. Job opportunities for Heating, Ventilation & Air Conditioning (HVAC) technicians in the UK are abundant, driven by a surge in construction projects, residential developments, and commercial ventures. According to recent data, the average salary for HVAC technicians in the UK ranges from £25,000 to £35,000 per year, Despite economic fluctuations, the Heating, Ventilation & Air Conditioning (HVAC) sector in the UK remains resilient, with sustained growth projected in response to evolving regulations and consumer preferences. The increasing focus on indoor air quality, energy efficiency standards, and climate control measures ensures a steady demand for skilled Heating, Ventilation & Air Conditioning (HVAC) technicians. Key Features: This Heating, Ventilation & Air Conditioning (HVAC) Technician Course Includes: This HVAC Technician Course is CPD Certified Developed by Specialist Lifetime Access Course Curriculum Heating, Ventilation & Air Conditioning (HVAC) Technician: Module 01: Fundamentals of Heating, Ventilation & Air Conditioning (HVAC) Module 02: Principles of Heating and Psychrometrics Module 03: HVAC System Varieties Module 04: Heating and Ventilation Techniques Module 05: Air Conditioning Systems for HVAC Professionals Module 06: Compressors, Water Chillers, and Fan Operations Module 07: Piping for HVAC Specialists Module 08: Duct System Design in HVAC Module 09: Refrigeration Principles and Refrigerants Module 10: Specialised Applications in HVAC Module 11: HVAC System Selection Criteria Module 12: Safety Protocols in the HVAC Industry Learning Outcomes: Demonstrate understanding of Heating, Ventilation & Air Conditioning (HVAC) fundamentals for practical system applications. Apply principles of heating and psychrometrics in Heating, Ventilation & Air Conditioning (HVAC) system configurations. Identify and differentiate various Heating, Ventilation & Air Conditioning (HVAC) system types and their functionalities. Implement heating and ventilation techniques for efficient environmental control systems. Analyse air conditioning systems, compressors, water chillers, and fan operations. Design duct systems and piping, adhering to safety and industry protocols. CPD 10 CPD hours / points Accredited by The CPD Quality Standards Who is this course for? This Heating, Ventilation & Air Conditioning (HVAC) Technician course is accessible to anyone eager to learn more about this topic. Through this course, you'll gain a solid understanding of Heating, Ventilation & Air Conditioning (HVAC). Moreover, this course is ideal for: Individuals aspiring to Heating, Ventilation & Air Conditioning (HVAC) technician roles. Maintenance personnel seeking Heating, Ventilation & Air Conditioning (HVAC) system knowledge. Engineers interested in expanding Heating, Ventilation & Air Conditioning (HVAC) design expertise. Building management professionals enhancing Heating, Ventilation & Air Conditioning (HVAC) operation understanding. Construction industry workers pursuing Heating, Ventilation & Air Conditioning (HVAC) system specialisation. Requirements There are no requirements needed to enrol into this Heating, Ventilation & Air Conditioning (HVAC) Techniciancourse. We welcome individuals from all backgrounds and levels of experience to enrol into this Heating, Ventilation & Air Conditioning (HVAC) Technician course. Career path After finishing the Heating, Ventilation & Air Conditioning course there will be multiple job opportunities for you. Some of the Job sectors of Heating, Ventilation & Air Conditioning (HVAC) are: HVAC Technician - £25K to 35K/year HVAC Engineer - £30K to 45K/year Refrigeration Specialist - £28K to 40K/year HVAC System Designer - £35K to 50K/year Air Conditioning Technician - £22K to 32K/year Certificates Digital certificate Digital certificate - Included Will be downloadable when all lectures have been completed.
Wildlife Rehabilitation
By IOMH - Institute of Mental Health
Overview of Wildlife Rehabilitation Wildlife Rehabilitation is a meaningful and rewarding field that helps wild animals recover from injuries and return safely to their natural homes. In the UK, more than 70,000 wild animals are treated every year by people who care deeply about protecting nature. The RSPCA alone helps around 16,000 injured or sick animals each year, showing how important trained professionals in Wildlife Rehabilitation are. Our Wildlife Rehabilitation course teaches you everything you need to know, from telling different species apart to understanding how to care for animals with serious health problems. You will learn how to give first aid, check an animal’s health, keep proper records, and follow the right steps when releasing animals back into the wild. The course also covers the behaviours animals need to survive once they are released. As cities grow and more natural spaces disappear, wild animals face new dangers like road accidents and habitat loss. This creates a strong need for people trained in Wildlife Rehabilitation who can give animals a second chance. With a mix of practical knowledge and care, this Wildlife Rehabilitation course helps you build the skills to support injured wildlife and be part of a growing effort to protect the natural world. Start learning today and become a helping hand for wildlife in need. This Wildlife Rehabilitation course will help you to learn: Recognise common wild animals and understand how they behave in nature Check the basic health of injured or orphaned wildlife Use first aid to help hurt animals feel better and stay safe Control the spread of diseases in wildlife care areas Know when an animal is ready to go back to the wild Keep clear and legal records of the care and release process Perks of Learning with IOMH One-to-one support from a dedicated tutor throughout your course. Study online - whenever and wherever you want. Instant Digital/ PDF certificate 100% money back guarantee 12 months access Who is this course for? This course is suitable for: People who love animals and want to help save wild ones Vet assistants who want to learn more about treating wild animals Volunteers in conservation who want better wildlife care skills Anyone who wants to work at a wildlife rescue centre or animal sanctuary Wildlife centre workers who want to grow their knowledge and skills Process of Evaluation After studying the Wildlife Rehabilitation Course, your skills and knowledge will be tested with an MCQ exam or assignment. You have to get a score of 60% to pass the test and get your certificate. Certificate of Achievement Certificate of Completion - Digital / PDF Certificate After completing the Wildlife Rehabilitation Course, you can order your CPD Accredited Digital / PDF Certificate for £5.99. (Each) Certificate of Completion - Hard copy Certificate You can get the CPD Accredited Hard Copy Certificate for £12.99. (Each) Shipping Charges: Inside the UK: £3.99 International: £10.99 Requirements There is no prerequisite to enrol in this course. Career Path This Wildlife Rehabilitation Course will help the learners to pursue a variety of careers. Such as: Wildlife Rehabilitation Specialist – £22,000 to £35,000 per year Wildlife Care Assistant – £18,000 to £27,000 per year Conservation Officer (Wildlife) – £24,000 to £38,000 per year Animal Welfare Officer – £21,000 to £32,000 per year Wildlife Rescue Technician – £19,000 to £29,000 per year Course Curriculum Module 01: Introduction to Wildlife Rehabilitation Introduction to Wildlife Rehabilitation 00:25:00 Module 02: Wildlife Species Identification and Behaviour Wildlife Species Identification and Behaviour 00:23:00 Module 03: Basic Animal Health Basic Animal Health 00:23:00 Module 04: Wildlife First Aid and Initial Assessment Wildlife First Aid and Initial Assessment 00:31:00 Module 05: Controlling Wildlife Diseases Controlling Wildlife Diseases 00:23:00 Module 06: Wildlife Rehabilitation Techniques Wildlife Rehabilitation Techniques 00:28:00 Module 07: Release Criteria and Post-Release Monitoring Release Criteria and Post-Release Monitoring 00:21:00 Module 08: Interaction with Animal Interaction with Animal 00:24:00 Module 09: Rehabilitation Documentation and Reporting Rehabilitation Documentation and Reporting 00:22:00 Module 10: Wildlife Rehabilitation Ethics and Conservation Wildlife Rehabilitation Ethics and Conservation 00:21:00

IT Consultant - IT Consulting and Project Management
By Compliance Central
Are you looking to enhance your IT Consultant skills? If yes, then you have come to the right place. Our comprehensive course on IT Consultant will assist you in producing the best possible outcome by mastering the IT Consultant skills. The IT Consultant course is for those who want to be successful. In the IT Consultant course, you will learn the essential knowledge needed to become well versed in IT Consultant. Our IT Consultant course starts with the basics of IT Consultant and gradually progresses towards advanced topics. Therefore, each lesson of this IT Consultant course is intuitive and easy to understand. Why would you choose the IT Consultant course from Compliance Central: Lifetime access to IT Consultant course materials Full tutor support is available from Monday to Friday with the IT Consultant course Learn IT Consultant skills at your own pace from the comfort of your home Gain a complete understanding of IT Consultant course Accessible, informative IT Consultant learning modules designed by experts Get 24/7 help or advice from our email and live chat teams with the IT Consultant Study IT Consultant in your own time through your computer, tablet or mobile device A 100% learning satisfaction guarantee with your IT Consultant Course IT Consultant Curriculum Breakdown of the IT Consultant Course Course Outline: Section 01: How People Use Computers Section 02: System Hardware Section 03: Device Ports and Peripherals Section 04: Data Storage and Sharing Section 05: Understanding Operating Systems Section 06: Setting Up and Configuring a PC Section 07: Setting Up and Configuring a Mobile Device Section 08: Managing Files Section 09: Using and Managing Application Software Section 10: Configuring Network and Internet Connectivity Section 11: IT Security Threat Mitigation Section 12: Computer Maintenance and Management Section 13: IT Troubleshooting Section 14: Understanding Databases Section 15: Developing and Implementing Software CPD 10 CPD hours / points Accredited by CPD Quality Standards Who is this course for? The IT Consultant course helps aspiring professionals who want to obtain the knowledge and familiarise themselves with the skillsets to pursue a career in IT Consultant. It is also great for professionals who are already working in IT Consultant and want to get promoted at work. Requirements To enrol in this IT Consultant course, all you need is a basic understanding of the English Language and an internet connection. Career path IT Project Manager: £40,000 to £80,000 per year IT Business Analyst: £35,000 to £60,000 per year IT Consultant: £35,000 to £70,000 per year Solutions Architect: £45,000 to £85,000 per year IT Service Delivery Manager: £40,000 to £70,000 per year IT Program Manager: £50,000 to £95,000 per year Certificates CPD Accredited PDF Certificate Digital certificate - Included CPD Accredited PDF Certificate CPD Accredited Hard Copy Certificate Hard copy certificate - £10.79 CPD Accredited Hard Copy Certificate Delivery Charge: Inside the UK: Free Outside of the UK: £9.99 each

Environmental Health Officer
By Compliance Central
Are you looking to enhance your Environmental Health Officer skills? If yes, then you have come to the right place. Our comprehensive course on Environmental Health Officer will assist you in producing the best possible outcome by mastering the Environmental Health Officer skills. The Environmental Health Officer course is for those who want to be successful. In the Environmental Health Officer course, you will learn the essential knowledge needed to become well versed in Environmental Health Officer. Our Environmental Health Officer course starts with the basics of Environmental Health Officer and gradually progresses towards advanced topics. Therefore, each lesson of this Environmental Health Officer course is intuitive and easy to understand. Why would you choose the Environmental Health Officer course from Compliance Central: Lifetime access to Environmental Health Officer course materials Full tutor support is available from Monday to Friday with the Environmental Health Officer course Learn Environmental Health Officer skills at your own pace from the comfort of your home Gain a complete understanding of Environmental Health Officer course Accessible, informative Environmental Health Officer learning modules designed by experts Get 24/7 help or advice from our email and live chat teams with the Environmental Health Officer course Study Environmental Health Officer in your own time through your computer, tablet or mobile device A 100% learning satisfaction guarantee with your Environmental Health Officer course Environmental Health Officer Curriculum Breakdown of the Environmental Health Officer Course Module 01: Intro to Environmental Health Module 02: Waste, Pollution and Pollutants Module 03: Environment, Pollution, Climate Change and Health Module 04: Recovering Resources and Managing Waste Module 05: Food Waste Module 06: Plastic Module 07: Air Pollution Module 08: Water Module 09: Environmental Sustainability CPD 10 CPD hours / points Accredited by CPD Quality Standards Who is this course for? The Environmental Health Officer course helps aspiring professionals who want to obtain the knowledge and familiarise themselves with the skillsets to pursue a career in Environmental Health Officer. It is also great for professionals who are already working in Environmental Health Officer and want to get promoted at work. Requirements To enrol in this Environmental Health Officer course, all you need is a basic understanding of the English Language and an internet connection. Career path The Environmental Health Officer course will enhance your knowledge and improve your confidence in exploring opportunities in various sectors related to Environmental Health Officer. Environmental Health Practitioner: £25,000 to £40,000 per year Public Health Officer: £28,000 to £45,000 per year Occupational Health and Safety Specialist: £30,000 to £50,000 per year Certificates CPD Accredited PDF Certificate Digital certificate - Included CPD Accredited PDF Certificate CPD Accredited Hard Copy Certificate Hard copy certificate - £10.79 CPD Accredited Hard Copy Certificate Delivery Charge: Inside the UK: Free Outside of the UK: £9.99 each
Course Overview Learn the Latest Skills | Acknowledged by CPD | MCQ Based Exam & Tutor Support | Interactive Video Training Building surveying is one of the broadest areas of surveying practice and includes a variety of occupations. You will be required to provide a range of services linked to building upkeep and maintenance, including building design, renovation, or alteration, as well as other property and construction-related tasks. Therefore, in order to exhibit your proficiency in building surveying practice, it's imperative that you comprehend essential knowledge of construction technology, contracts, and building pathology. The fundamentals of contract administration, construction and environmental services, design and specification, inspection, and legal and regulatory compliance are topics covered in our course. Training in these key areas will furnish you with important knowledge and techniques for this multi-disciplined industry and will give you a practical skill set with which to implement key building surveying techniques. What Will You Learn? Introduction to building survey Learn about building information modelling and technology Understand work breakdown structure Reporting various aspects of the building sites All the legal aspects of building survey What classes are included in this package? Earn a digital Certificate upon successful completion acknowledged by UK and internationally acknowledged lesson There are no set schedules, so you can work at your own pace. Our email and live chat specialists are available to assist you 24 hours a day, 7 days a week. On weekdays, you'll have access to a full-time tutor. Learn in a user-friendly, cutting-edge online learning environment. High-quality e-learning study materials Lifetime Access Benefit from instant feedback through mock exams and multiple-choice assessments Who Should Take This Course? This Construction Surveyor course has been designed to train those individuals who work as Building Surveyors or are preparing to do so. It may also benefit comparable roles in the construction industry. Career Path Training offered by the Construction Surveyor could potentially benefit a range of roles but would particularly enhance careers in: Surveyor Contractor Civil Engineer Project Manager Course Design The course is delivered through our online learning platform, accessible through any internet-connected device. There are no formal deadlines or teaching schedules, meaning you are free to study the course at your own pace. You are taught through a combination of Video lessons Online study materials Mock exams Multiple-choice assessments Assignment Certificate of Achievements from Janets Upon successful completion of the course, you will be able to obtain your course completion e-certificate free of cost. Print copy by post is also available at an additional cost of £9.99 and PDF Certificate at £4.99. Method of Assessment On successful completion of the Construction Surveyor, you will be required to sit an online multiple-choice assessment. You will need to score 60% or above to pass the course.

Red Hat Application Development I: Programming in Java EE (AD183)
By Nexus Human
Duration 5 Days 30 CPD hours This course is intended for This course is designed for Java developers who want to learn more about the specifications that comprise the world of Java Enterprise Edition (Java EE), Proficiency in developing Java SE applications, with 2+ years of experience required, Proficiency in using an IDE such as Red Hat Developer Studio or Eclipse, Experience with Maven is recommended but not required. Overview Red Hat Application Development I: Programming in Java EE Virtual Training exposes experienced Java Standard Edition (Java SE) developers to the world of Java Enterprise Edition (Java EE). As an experienced Java Standard Edition (Java SE) developer, this course introduces you to the world of Java Enterprise Edition (Java EE). You will learn about the various specifications that make up Java EE. Through hands-on labs, you will transform a simple Java SE command line application into a multi-tiered enterprise application using various Java EE specifications, including Enterprise Java Beans, Java Persistence API, Java Messaging Service, JAX-RS for REST services, Contexts and Dependency Injection (CDI), and JAAS for securing the application. This course is based on Red Hat© Enterprise Application Platform 7.0. 1 - TRANSITION TO MULTI-TIERED APPLICATIONS Describe Java EE features and distinguish between Java EE and Java SE applications. 2 - PACKAGE AND DEPLOY APPLICATIONS TO AN APPLICATION SERVER Describe the architecture of a Java EE application server, package an application, and deploy the application to an EAP server. 3 - CREATE ENTERPRISE JAVA BEANS Develop Enterprise Java Beans, including message-driven beans. 4 - MANAGE PERSISTENCE Create persistence entities with validations. 5 - MANAGE ENTITY RELATIONSHIPS Define and manage JPA entity relationships. 6 - CREATE REST SERVICES Create REST APIs using the JAX-RS specification. 7 - IMPLEMENT CONTEXTS AND DEPENDENCY INJECTION Describe typical use cases for using CDI and successfully implement it in an application. 8 - SECURE JAVA EE APPLICATIONS Use JAAS to secure a Java EE application. 9 - SECURE JAVA EE APPLICATIONS Use JAAS to secure a Java EE application. 10 - COMPREHENSIVE REVIEW OF RED HAT JBOSS DEVELOPMENT I: JAVA EE Demonstrate proficiency of the knowledge and skills obtained during the course. Additional course details: Nexus Humans Red Hat Application Development I: Programming in Java EE (AD183) training program is a workshop that presents an invigorating mix of sessions, lessons, and masterclasses meticulously crafted to propel your learning expedition forward. This immersive bootcamp-style experience boasts interactive lectures, hands-on labs, and collaborative hackathons, all strategically designed to fortify fundamental concepts. Guided by seasoned coaches, each session offers priceless insights and practical skills crucial for honing your expertise. Whether you're stepping into the realm of professional skills or a seasoned professional, this comprehensive course ensures you're equipped with the knowledge and prowess necessary for success. While we feel this is the best course for the Red Hat Application Development I: Programming in Java EE (AD183) course and one of our Top 10 we encourage you to read the course outline to make sure it is the right content for you. Additionally, private sessions, closed classes or dedicated events are available both live online and at our training centres in Dublin and London, as well as at your offices anywhere in the UK, Ireland or across EMEA.

Complete Bid Writing Training - CPD Accredited
By Training Tale
Bid Writing: Bid Writing Online Training Are you interested in pursuing a career in bid writing? To help you brush up on the fundamentals of bid writing and take the first step towards becoming an expert, we have designed the ideal Bid Writing Course for you. This Bid Writing: Bid Writing Course offers a comprehensive overview, ensuring a deep understanding of Bid Writing. Through the Bid Writing: Bid Writing Course, you will learn how to plan, structure and develop the bids. Also, the Bid Writing Course teaches the proposal Process, understanding clients and presentation. Moreover, the Bid Writing Course is fruitful for learning about cost, quality, pricing and sales. Enrol our Bid Writing: Bid Writing Course to get a proper understanding of Bid Writing and allow you to accelerate your career. Special Offers of this Bid Writing: Bid Writing Course This Bid Writing: Bid Writing Course includes a FREE PDF Certificate. Lifetime access to this Bid Writing: Bid Writing Course Instant access to this Bid Writing: Bid Writing Course Get FREE Tutor Support from Monday to Friday in this Bid Writing: Bid Writing Course Main Course: Bid Writing Course Free Courses included with this Bid Writing: Bid Writing Course Course 01: Business Writing Course Course 02: Level 5 Report Writing Course 03: Minute Taking Course Course 04: Public Speaking Course [ Note: Free PDF certificate as soon as completing the Bid Writing: Bid Writing Course] Bid Writing: Bid Writing Online Training Industry Experts Designed this Bid Writing: Bid Writing course into 12 detailed modules. Course Curriculum of Bid Writing Module 01: Bid Writing Module 02: Planning and Developing the Bid Module 03: Structured Approach to Writing Bids Module 04: Understanding the Proposal Module 05: Proposal Process of Bid Writing Module 06: Focusing on Clients and Customers Module 07: Finding Unique Selling Points Module 08: Estimation Method of Bid Writing Module 09: Costing and Pricing of Bid Writing Module 10: Quality Control (Editing) Module 11: Client Presentation Module 12: Templates for Proposal Building Assessment Method of Bid Writing: Bid Writing Course After completing each module of the Bid Writing: Bid Writing, you will find automated MCQ quizzes. To unlock the next module, you must complete the quiz task and get at least 60% marks. Certification of Bid Writing: Bid Writing Course After completing the MCQ/Assignment assessment for this Bid Writing: Bid Writing, you will be entitled to a Certificate of Completion from Training Tale. Who is this course for? Bid Writing: Bid Writing Online Training The Bid Writing: Bid Writing Course is ideal for anyone interested in Bid Writing. Requirements Bid Writing: Bid Writing Online Training Students who intend to enrol in this Bid Writing: Bid Writing must meet the following requirements: Bid Writing: Good command of the English language Bid Writing: Must be vivacious and self-driven Bid Writing: Basic computer knowledge Bid Writing: A minimum of 16 years of age is required Career path Bid Writing: Bid Writing Online Training Completing the Bid Writing: Bid Writing Course can open exciting career opportunities in various fields related to Bid Writing. Certificates Certificate of completion Digital certificate - Included