- Professional Development
- Medicine & Nursing
- Arts & Crafts
- Health & Wellbeing
- Personal Development
4434 EDI courses
Tableau for Data-Driven Decision Makers
By Nexus Human
Duration 1 Days 6 CPD hours This course is intended for This course is designed for professionals in a variety of job roles who receive Tableau data visualizations from data analysts or from data visualization engineers. These data report recipients want to take advantage of the many Tableau features and capabilities that enable them to explore the data behind the initial analysis, perform additional analysis to ask next-level questions of the data, and to customize visualizations and dashboards to share new insights and create compelling reports. Overview Explore Tableau reports. Analyze data to get answers and insights. Sort and group data for analysis and reporting. Filter views. Prepare reports. Troubleshoot, collaborate, and share views and analysis As data acquisition, access, analysis, and reporting are interwoven with our businesses and lives, more and more data is collected about business and personal activities. This abundance of data and the computing power to analyze it has increased the use of data analysis and data visualization across a broad range of job roles. Decision makers of all types, including managers and executives, must interact with, interpret, and develop reports based on data and analysis provided to them. Tableau© software is designed for data analysis and the creation of visualizations. Data analysts prepare data, perform initial analysis, and create visualizations that are then passed on to business data-driven decision makers. These decision makers can use Tableau's tools to explore the data, perform further analysis to find new insights, make decisions, and create customized reports to share their findings. Prerequisites To ensure your success in this course, you should have experience managing data with Microsoft© Excel© or Google Sheets? Lesson 1: Exploring Tableau Reports Topic A: Data Analysis Workflow with Tableau Topic B: Explore Views Topic C: Edit Workbooks Lesson 2: Analyzing Data to Get Answers and Insights Topic A: Configure Marks with the Marks Card Topic B: Ask New Questions by Changing Aggregation Topic C: Find Answers with Calculations Topic D: Answer Questions with Table Calculations Lesson 3: Sorting and Grouping Data for Analysis and Reporting Topic A: Sort Data Topic B: Group Data Lesson 4: Filtering Views Topic A: Filter Data to Refine Analysis Topic B: Create Interactive Filters for Reports Lesson 5: Preparing Reports Topic A: Format and Annotate Views to Tell Your Story Topic B: Emphasize Data in Reports Topic C: Animate Visualizations for Clarity Lesson 6: Troubleshooting, Sharing, and Collaborating Topic A: Troubleshoot Data Issues Topic B: Collaborate in Tableau Online Topic C: Collaborate with Non-Tableau Users

Microsoft Power BI Desktop (live online classes)
By Microsoft Office Training
This course will allow you to explore the potential of self-service business intelligence using Power BI Desktop to analyse and connect to different sources of data, creating Relationships between those different datasets, Query the data using Shaping and data Modelling, to create Visualizations, and publish Reports to different platforms . Course Objectives At the end of this course you will be able to: Connect to data from different sources. Use the Query Editor Perform Power BI desktop data Shaping and Transformation. Create Power BI desktop Modelling. Create Power BI desktop Visualizations and Reports. ' 1 year email support service Take a closer look at the consistent excellent feedback from our growing corporate clients visiting our site ms-officetraining co uk With more than 20 years experience, we deliver courses on all levels of the Desktop version of Microsoft Office and Office 365; ranging from Beginner, Intermediate, Advanced to the VBA level and Business Intelligence. Our trainers are Microsoft certified professionals with a proven track record with several years experience in delivering public, one to one, tailored and bespoke course Tailored training courses: in in company training, you can choose to run the course exactly as they are outlined by us or we can customise it so that it meets your specific needs. A tailored or bespoke course will follow the standard outline but may be adapted to your specific organisational needs. Please visit our site (ms-officetraining co uk) to get a feel of the excellent feedback our courses have had and look at other courses you might be interested in. Introduction to Power BI Power BI Jargon explained A quick look at Power BI Desktop A quick look at the Power BI service Helpful resources Power BI and Excel Introduction to using Excel data in Power BI Upload Excel data to Power BI Import Power View and Power Pivot to Power BI Getting started with Power BI Desktop Overview of Power BI Desktop Accessing Help and Helpful resources Connect to data sources in Power BI Desktop Shaping and Transforming Data with Query Editor Introduction to the Query Editor Data Sources Power BI Desktop can Connect to Introduction to Steps and M code Combining Data Using Merge and Append Queries Data Type Properties Working with Delimiters Clean and transform your data with the Query Editor Text Specific Transformation Tools Number Specific Transformation Tools Date Specific Transformation Tools Split and Merge columns Creating an Index Column Adding Conditional Columns Columns From Examples Grouping and Aggregating data Pivoting and Unpivoting Using filters Modeling the data Introduction to modeling your data How to manage your data relationships Create calculated columns Optimizing data models Create calculated measures Show Values As and Quick Measures Create calculated tables Explore your time-based data Introduction to DAX DAX calculation types DAX functions Visualizations Introduction to visuals in Power BI Create and customize simple visualizations Modify colors in charts and visuals Shapes, text boxes, and images Page layout and formatting Group interactions among visualizations Visual hierarchies and drill-down Using custom visualizations Create a KPI Visualization Geo-Data and Maps Reports, Publishing and Sharing Introduction to the Power BI service Quick insights in Power BI Create and configure a dashboard Ask questions of your data with natural language Create custom Q&A suggestions Share dashboards with your organization Introduction to content packs, security, and groups Publish Power BI Desktop reports Print and export dashboards and reports Create groups in Power BI Use content packs Update content packs Publish to web Who is this course for? Who is this course for? This course facilitates you with knowledge on the potential for Power BI Desktop to analyse and connect to different sources of data, creating Relationships between those different datasets, Query the data using Shaping and data Modelling, and to create Visualizations, and publish Reports to different platforms. Requirements Requirements Before attending this course, delegates should have: - A general knowledge of database concepts (fields, records and relationships) - Familiarity with Excel. Career path Career path Business Intelligence Data Analysis ETL & Data Warehousing

Microsoft Power BI Desktop (now with live online classes)
By Microsoft Office Training
This course will allow you to explore the potential of self-service business intelligence using Power BI Desktop to analyse and connect to different sources of data, creating Relationships between those different datasets, Query the data using Shaping and data Modelling, to create Visualizations, and publish Reports to different platforms . Course Objectives At the end of this course you will be able to: Connect to data from different sources. Use the Query Editor Perform Power BI desktop data Shaping and Transformation. Create Power BI desktop Modelling. Create Power BI desktop Visualizations and Reports. ' 1 year email support service Take a closer look at the consistent excellent feedback from our growing corporate clients visiting our site ms-officetraining co uk With more than 20 years experience, we deliver courses on all levels of the Desktop version of Microsoft Office and Office 365; ranging from Beginner, Intermediate, Advanced to the VBA level and Business Intelligence. Our trainers are Microsoft certified professionals with a proven track record with several years experience in delivering public, one to one, tailored and bespoke course Tailored training courses: in in company training, you can choose to run the course exactly as they are outlined by us or we can customise it so that it meets your specific needs. A tailored or bespoke course will follow the standard outline but may be adapted to your specific organisational needs. Please visit our site (ms-officetraining co uk) to get a feel of the excellent feedback our courses have had and look at other courses you might be interested in. Introduction to Power BI Power BI Jargon explained A quick look at Power BI Desktop A quick look at the Power BI service Helpful resources Power BI and Excel Introduction to using Excel data in Power BI Upload Excel data to Power BI Import Power View and Power Pivot to Power BI Getting started with Power BI Desktop Overview of Power BI Desktop Accessing Help and Helpful resources Connect to data sources in Power BI Desktop Shaping and Transforming Data with Query Editor Introduction to the Query Editor Data Sources Power BI Desktop can Connect to Introduction to Steps and M code Combining Data Using Merge and Append Queries Data Type Properties Working with Delimiters Clean and transform your data with the Query Editor Text Specific Transformation Tools Number Specific Transformation Tools Date Specific Transformation Tools Split and Merge columns Creating an Index Column Adding Conditional Columns Columns From Examples Grouping and Aggregating data Pivoting and Unpivoting Using filters Modeling the data Introduction to modeling your data How to manage your data relationships Create calculated columns Optimizing data models Create calculated measures Show Values As and Quick Measures Create calculated tables Explore your time-based data Introduction to DAX DAX calculation types DAX functions Visualizations Introduction to visuals in Power BI Create and customize simple visualizations Modify colors in charts and visuals Shapes, text boxes, and images Page layout and formatting Group interactions among visualizations Visual hierarchies and drill-down Using custom visualizations Create a KPI Visualization Geo-Data and Maps Reports, Publishing and Sharing Introduction to the Power BI service Quick insights in Power BI Create and configure a dashboard Ask questions of your data with natural language Create custom Q&A suggestions Share dashboards with your organization Introduction to content packs, security, and groups Publish Power BI Desktop reports Print and export dashboards and reports Create groups in Power BI Use content packs Update content packs Publish to web Who is this course for? Who is this course for? This course facilitates you with knowledge on the potential for Power BI Desktop to analyse and connect to different sources of data, creating Relationships between those different datasets, Query the data using Shaping and data Modelling, and to create Visualisations, and publish Reports to different platforms. Requirements Requirements Before attending this course, delegates should have: - A general knowledge of database concepts (fields, records and relationships) - Familiarity with Excel. Career path Career path Business Intelligence Data Analysis ETL & Data Warehousing
Sketchup One to One Basic to Intermediate Level
By Real Animation Works
Sketchup face to face training customised and bespoke.

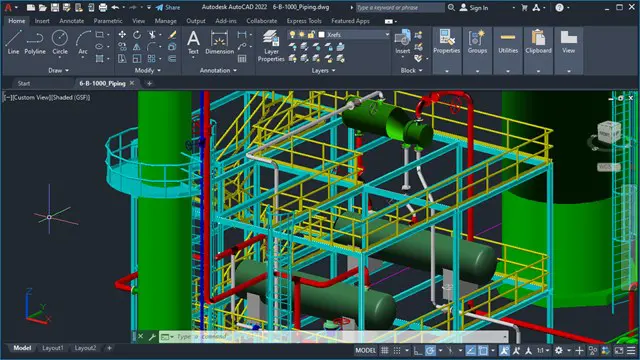
AutoCAD 3D modeling course
By Real Animation Works
Autocad face to face training customised and bespoke.
Communication Skills 1 Day Training in Solihull
By Mangates
Our classroom training provides you the opportunity to interact with instructors and benefit from face-to-face instruction. For more queries, reach out to us: info@mangates.com

Communication Skills 1 Day Training in Plymouth
By Mangates
Our classroom training provides you the opportunity to interact with instructors and benefit from face-to-face instruction. For more queries, reach out to us: info@mangates.com
Communication Skills 1 Day Training in Newcastle
By Mangates
Our classroom training provides you the opportunity to interact with instructors and benefit from face-to-face instruction. For more queries, reach out to us: info@mangates.com
Communication Skills 1 Day Training in Guildford
By Mangates
Our classroom training provides you the opportunity to interact with instructors and benefit from face-to-face instruction. For more queries, reach out to us: info@mangates.com
Communication Skills 1 Day Training in Cambridge
By Mangates
Our classroom training provides you the opportunity to interact with instructors and benefit from face-to-face instruction. For more queries, reach out to us: info@mangates.com