- Professional Development
- Medicine & Nursing
- Arts & Crafts
- Health & Wellbeing
- Personal Development
3138 Development courses in London delivered Live Online
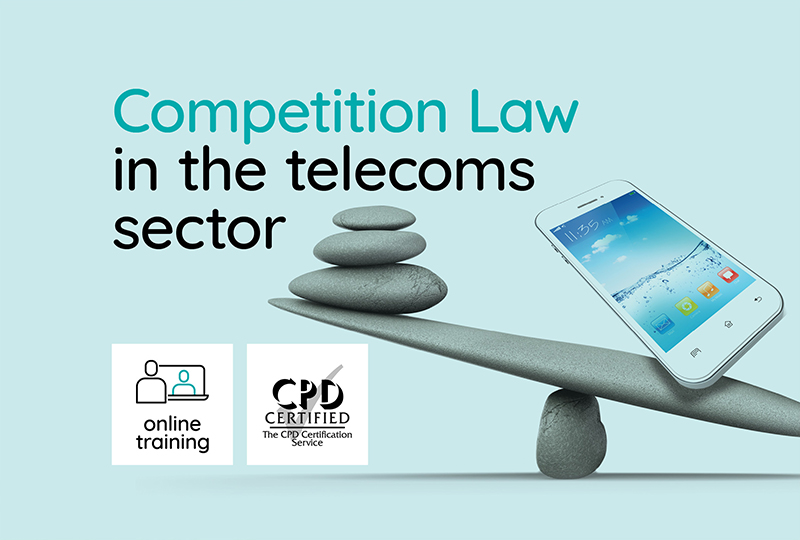
Competition Law in the telecoms sector
By Cullen International SA
Competition in the communications sector is complex and fast-changing. This presents both risks and opportunities to providers, as well as challenges for public authorities. Would you like to gain expert insights on the practical applications of competition law in the regulated telecoms industry? Then, this training is for you! Presented by experts through practical case examples, this online training will guide you through the latest competition law developments affecting the telecoms industry and give you a full overview of the role played by competiton law in shaping the telecoms market. Topics covered include: Relationship between competition law and sector-specific telecoms regulation Market definition Telecoms mergers Antitrust aspects of network co-operation Typical abuses of dominance in the telecoms sector Broadband state aid When: 17-19 September 2024 - 9 hours of interactive sessions spread over 3 days Where: Online, using Microsoft Teams Cannot make it to one of the sessions? All sessions will be recorded and made available to registered participants.

M.D.D 6 FACE TO FACE SESSIONS PACKAGE (SINGLES)
(27)By Miss Date Doctor Dating Coach London, Couples Therapy
Dating advice for singles Online dating tips Confidence-building and reflection exercises How to be a better dater tips Understanding your core values Dating education M.D.D Contemporary CBT exercises https://relationshipsmdd.com/product/6-face-to-face-sessions-package/


Effecting Business Process Improvement: Virtual In-House Training
By IIL Europe Ltd
Effecting Business Process Improvement: Virtual In-House Training Business analysts facilitate the solution of business problems. The solutions are put into practice as changes to the way people perform in their organizations and the tools they use. The business analyst is a change agent who must understand the basic principles of quality management. This course covers the key role that business analysts play in organizational change management. What you will Learn You will learn how to: Define and document a business process Work with various business modeling techniques Perform an enterprise analysis in preparation for determining requirements Analyze business processes to discern problems Foundation Concepts Overview of business analysis and process improvement Defining the business process Introducing the proactive business analyst Focusing on business process improvement for business analysts Launching a Successful Business Process Improvement Project Overview of the launch phase Understanding and creating organizational strategy Selecting the target process Aligning the business process improvement project's goals and objectives with organizational strategy Defining the Current Process Overview of current process phase Documenting the business process Business modeling options: work-flow models Business modeling options: Unified Modeling Language (UML) model adaptations for business processes Analyzing the Current Process Process analysis overview Evaluation: establishing the control group Opportunity techniques: multi-discipline problem-solving Opportunity techniques: matrices Building and Sustaining a Recommended Process Overview of the recommended process and beyond Impact analysis Recommended process Transition to the business case Return to proactive state

Project Quality Management: Virtual In-House Training
By IIL Europe Ltd
Project Quality Management: Virtual In-House Training In today's environment, quality is the responsibility of everyone. Project success is no longer just the fulfillment of a project on schedule, on budget, and within the scope. Today, projects aren't successful unless the customer's needs are met at the highest level of quality at the lowest cost to the organization. Project Managers must know customer needs, and manage to them throughout the project lifecycle, in order to gain acceptance. Project Quality Management provides an interactive, hands-on environment for participants to practice identification of critical quality requirements (quality planning), fulfillment of those requirements through well-designed processes (Quality Assurance), and statistical awareness of technical specifications of project deliverables (Quality Control). What You Will Learn You'll learn how to: Plan for higher quality project deliverables Measure key performance indicators on projects, processes, and products Turn data into useful project information Take action on analyzed data that will drive down non-value-added costs and drive up customer acceptance and satisfaction Reduce defects and waste in current project management processes Foundation Concepts Quality Defined Customer Focus Financial Focus Quality Management Process Management Cost of Quality Planning for Quality Project Manager Role in Planning Voice of the Customer Quality Management Plan Measurement System Accuracy Data Gathering Data Sampling Manage Quality Process Management Process Mapping Process Analysis Value Stream Mapping Standardization Visual Workplace and 5S Error Proofing (Poka-Yoke) Failure Mode and Effect Analysis Control Quality The Concept of Variation Common Cause Special Cause Standard Business Reports Tracking Key Measurements Control Charts Data Analysis Variation Root Cause Analysis Variance Management Designing for Quality
Influencing Skills
By Mpi Learning - Professional Learning And Development Provider
One of the keys to success today is our ability to effectively influence others.

GenAIBIZ: Making ChatGPT and Generative AI Work for You (Exam GAZ-110)
By Nexus Human
Duration 1 Days 6 CPD hours This course is intended for This course is primarily designed for business leaders, consultants, product and project managers, and other decision makers who are interested in unlocking new business opportunities and augmenting existing business processes using generative AI. It's also a great starting point for any business professionals who want to investigate generative AI solutions for their own individual tasks and workflows. This course is also designed to assist students in preparing for the CertNexus GenAIBIZ (Exam GAZ-110) credential. Overview In this course, you will identify ways in which generative AI can bring significant value to the organization. You will: Describe the fundamentals of AI and generative AI. Generate text using AI. Generate code using AI. Generate images and video using AI. Generate audio using AI. Identify the challenges of generative AI. Implement organizational strategies for generative AI. This course is designed to demystify generative AI for business professionals, as well as to trace its power to actionable, real-world business goals. It will give you the essential knowledge of generative AI you'll need to elevate the organization in these exciting times. GenAIBIZÿoffers business professionals with the ability to describe the fundamentals of AI and generative AI; generate text, code, images, video, and audio using generative AI; identify the challenges of generative AI; and implement organizational strategies for generative AI. Exam voucher is included.This course may earn you a Credly badge. Lesson 1: AI Fundamentals Topic A: AI Concepts Topic B: Generative AI Concepts Lesson 2: Generating Text Using AI Topic A: Identify Text Generation Concepts Topic B: Solve Business Problems Using Text Generation Lesson 3: Generating Code Using AI Topic A: Identify Code Generation Concepts Topic B: Solve Business Problems Using Code Generation Lesson 4: Generating Images and Video Using AI Topic A: Identify Image and Video Generation Concepts Topic B: Solve Business Problems Using Image and Video Generation Lesson 5: Generating Audio Using AI Topic A: Identify Audio Generation Concepts Topic B: Solve Business Problems Using Audio Generation Lesson 6: Identifying Challenges of Generative AI Topic A: Identify Shortcomings of Generative AI Topic B: Identify Ethical Risks of Generative AI Topic C: Identify Business Concerns of Generative AI Lesson 7: Implementing Business Strategies for Generative AI Topic A: Apply Best Practices for Generative AI in the Organization Topic B: Evaluate the Results of Generative AI Projects

Critical Thinking
By Nexus Human
Duration 1 Days 6 CPD hours This course is intended for This course is intended for individuals who want to become more rational and disciplined thinkers. Overview Upon successful completion of this course, students will boost their performance with an increase in their decision-making ability. In this course, students will learn develop their ability to analyze and evaluate information. 1 - GETTING STARTED Icebreaker Housekeeping Items The Parking Lot Workshop Objectives 2 - COMPONENTS OF CRITICAL THINKING Applying Reason Open Mindedness Analysis Logic Case Study 3 - NON-LINEAR THINKING Step Out of Your Comfort Zone Don't Jump to Conclusions Expect and Initiate Change Being Ready to Adapt Case Study 4 - LOGICAL THINKING Ask the Right Questions Organize the Data Evaluate the Information Draw Conclusions Case Study 5 - CRITICAL THINKERS (I) Active Listening Be Curious Be Disciplined Be Humble Case Study 6 - CRITICAL THINKERS (II) Seeing the Big Picture Objectivity Using Your Emotions Being Self-Aware Case Study 7 - EVALUATE INFORMATION Making Assumptions Watch out for Bias Ask Clarifying Questions SWOT Analysis Case Study 8 - BENEFITS OF CRITICAL THINKING Being More Persuasive Better Communication Better Problem Solving Increased Emotional Intelligence Case Study 9 - CHANGING YOUR PERSPECTIVE Limitations of Your Point of View Considering Others Viewpoint Influences on Bias When New Information Arrives Case Study 10 - PROBLEM SOLVING Identify Inconsistencies Trust Your Instincts Asking Why? Evaluate the Solution(s) Case Study 11 - PUTTING IT ALL TOGETHER Retaining Your New Skills Reflect and Learn From Mistakes Always Ask Questions Practicing Critical Thinking Case Study 12 - WRAPPING UP Words from the Wise Review of Parking Lot Lessons Learned Completion of Action Plans and Evaluations
STGO Awareness, Abnormal Loads & Escort Vehicles Course - Online - June 2025
By Total Compliance
STGO Abnormal Loads