- Professional Development
- Medicine & Nursing
- Arts & Crafts
- Health & Wellbeing
- Personal Development
Overview This comprehensive course on Android Studio Admob Integration: Start Showing Ads in Your Mobile App Today! will deepen your understanding on this topic. After successful completion of this course you can acquire the required skills in this sector. This Android Studio Admob Integration: Start Showing Ads in Your Mobile App Today! comes with accredited certification from CPD, which will enhance your CV and make you worthy in the job market. So enrol in this course today to fast track your career ladder. How will I get my certificate? You may have to take a quiz or a written test online during or after the course. After successfully completing the course, you will be eligible for the certificate. Who is This course for? There is no experience or previous qualifications required for enrolment on this Android Studio Admob Integration: Start Showing Ads in Your Mobile App Today!. It is available to all students, of all academic backgrounds. Requirements Our Android Studio Admob Integration: Start Showing Ads in Your Mobile App Today! is fully compatible with PC's, Mac's, Laptop, Tablet and Smartphone devices. This course has been designed to be fully compatible with tablets and smartphones so you can access your course on Wi-Fi, 3G or 4G. There is no time limit for completing this course, it can be studied in your own time at your own pace. Career Path Learning this new skill will help you to advance in your career. It will diversify your job options and help you develop new techniques to keep up with the fast-changing world. This skillset will help you to- Open doors of opportunities Increase your adaptability Keep you relevant Boost confidence And much more! Course Curriculum 1 sections • 3 lectures • 00:50:00 total length •Module 01: Banner Ads Tutorial: 00:24:00 •Module 02: Interstitial Ads Tutorial: 00:16:00 •Module 03: Rewarded Video Ads Tutorial: 00:10:00

Register on the An Introduction To Moho Pro/Anime Studio 2D Illustration-Animation today and build the experience, skills and knowledge you need to enhance your professional development and work towards your dream job. Study this course through online learning and take the first steps towards a long-term career. The course consists of a number of easy to digest, in-depth modules, designed to provide you with a detailed, expert level of knowledge. Learn through a mixture of instructional video lessons and online study materials. Receive online tutor support as you study the course, to ensure you are supported every step of the way. Get an e-certificate as proof of your course completion. The An Introduction To Moho Pro/Anime Studio 2D Illustration-Animation is incredibly great value and allows you to study at your own pace. Access the course modules from any internet-enabled device, including computers, tablet, and smartphones. The course is designed to increase your employability and equip you with everything you need to be a success. Enrol on the now and start learning instantly! What You Get With The An Introduction To Moho Pro/Anime Studio 2D Illustration-Animation Receive a e-certificate upon successful completion of the course Get taught by experienced, professional instructors Study at a time and pace that suits your learning style Get instant feedback on assessments 24/7 help and advice via email or live chat Get full tutor support on weekdays (Monday to Friday) Course Design The course is delivered through our online learning platform, accessible through any internet-connected device. There are no formal deadlines or teaching schedules, meaning you are free to study the course at your own pace. You are taught through a combination of Video lessons Online study materials Certification Upon successful completion of the course, you will be able to obtain your course completion e-certificate free of cost. Print copy by post is also available at an additional cost of £9.99 and PDF Certificate at £4.99. Who Is This Course For: The course is ideal for those who already work in this sector or are an aspiring professional. This course is designed to enhance your expertise and boost your CV. Learn key skills and gain a professional qualification to prove your newly-acquired knowledge. Requirements: The online training is open to all students and has no formal entry requirements. To study the An Introduction To Moho Pro/Anime Studio 2D Illustration-Animation, all your need is a passion for learning, a good understanding of English, numeracy, and IT skills. You must also be over the age of 16. Course Content Introduction An Overview of Moho 00:07:00 Revised Course Objectives 00:05:00 Rigging Your Character Body Bone Structure Requirements of a Solid Character Body Bone Structure 00:11:00 Pose, Proportion, Perspective and Joints 00:12:00 Bone Correction, Angle Constraints and Target Bones 00:12:00 Illustration Constructing Perfect Knee and Elbow Joints (Part 1) 00:14:00 Constructing Perfect Knee and Elbow Joints (Part 2) 00:09:00 Drawing Your Character Torso 00:15:00 Tracing Your Character Head and Face 00:17:00 Cartoon Eyes Option Using Layer Masks 00:08:00 Rigging Your Character Binding Bones to Your Character 00:07:00 Rigging Switch Layer Hands, Feet and Mouth 00:11:00 Rigging Facial Smart Bone Dials 00:15:00 Animation Animating a Walk Cycle (Part 1) 00:13:00 Animating a Walk Cycle (Part 2) 00:07:00 Lip Syncing with Papagayo 00:13:00 Camera and Background Animation 00:14:00 Conclusion What Now? 00:02:00 Frequently Asked Questions Are there any prerequisites for taking the course? There are no specific prerequisites for this course, nor are there any formal entry requirements. All you need is an internet connection, a good understanding of English and a passion for learning for this course. Can I access the course at any time, or is there a set schedule? You have the flexibility to access the course at any time that suits your schedule. Our courses are self-paced, allowing you to study at your own pace and convenience. How long will I have access to the course? For this course, you will have access to the course materials for 1 year only. This means you can review the content as often as you like within the year, even after you've completed the course. However, if you buy Lifetime Access for the course, you will be able to access the course for a lifetime. Is there a certificate of completion provided after completing the course? Yes, upon successfully completing the course, you will receive a certificate of completion. This certificate can be a valuable addition to your professional portfolio and can be shared on your various social networks. Can I switch courses or get a refund if I'm not satisfied with the course? We want you to have a positive learning experience. If you're not satisfied with the course, you can request a course transfer or refund within 14 days of the initial purchase. How do I track my progress in the course? Our platform provides tracking tools and progress indicators for each course. You can monitor your progress, completed lessons, and assessments through your learner dashboard for the course. What if I have technical issues or difficulties with the course? If you encounter technical issues or content-related difficulties with the course, our support team is available to assist you. You can reach out to them for prompt resolution.

From Data to Insights with Google Cloud Platform
By Nexus Human
Duration 3 Days 18 CPD hours This course is intended for Data Analysts, Business Analysts, Business Intelligence professionals Cloud Data Engineers who will be partnering with Data Analysts to build scalable data solutions on Google Cloud Platform Overview This course teaches students the following skills: Derive insights from data using the analysis and visualization tools on Google Cloud Platform Interactively query datasets using Google BigQuery Load, clean, and transform data at scale Visualize data using Google Data Studio and other third-party platforms Distinguish between exploratory and explanatory analytics and when to use each approach Explore new datasets and uncover hidden insights quickly and effectively Optimizing data models and queries for price and performance Want to know how to query and process petabytes of data in seconds? Curious about data analysis that scales automatically as your data grows? Welcome to the Data Insights course! This four-course accelerated online specialization teaches course participants how to derive insights through data analysis and visualization using the Google Cloud Platform. The courses feature interactive scenarios and hands-on labs where participants explore, mine, load, visualize, and extract insights from diverse Google BigQuery datasets. The courses also cover data loading, querying, schema modeling, optimizing performance, query pricing, and data visualization. This specialization is intended for the following participants: Data Analysts, Business Analysts, Business Intelligence professionals Cloud Data Engineers who will be partnering with Data Analysts to build scalable data solutions on Google Cloud Platform To get the most out of this specialization, we recommend participants have some proficiency with ANSI SQL. Introduction to Data on the Google Cloud Platform Highlight Analytics Challenges Faced by Data Analysts Compare Big Data On-Premises vs on the Cloud Learn from Real-World Use Cases of Companies Transformed through Analytics on the Cloud Navigate Google Cloud Platform Project Basics Lab: Getting started with Google Cloud Platform Big Data Tools Overview Walkthrough Data Analyst Tasks, Challenges, and Introduce Google Cloud Platform Data Tools Demo: Analyze 10 Billion Records with Google BigQuery Explore 9 Fundamental Google BigQuery Features Compare GCP Tools for Analysts, Data Scientists, and Data Engineers Lab: Exploring Datasets with Google BigQuery Exploring your Data with SQL Compare Common Data Exploration Techniques Learn How to Code High Quality Standard SQL Explore Google BigQuery Public Datasets Visualization Preview: Google Data Studio Lab: Troubleshoot Common SQL Errors Google BigQuery Pricing Walkthrough of a BigQuery Job Calculate BigQuery Pricing: Storage, Querying, and Streaming Costs Optimize Queries for Cost Lab: Calculate Google BigQuery Pricing Cleaning and Transforming your Data Examine the 5 Principles of Dataset Integrity Characterize Dataset Shape and Skew Clean and Transform Data using SQL Clean and Transform Data using a new UI: Introducing Cloud Dataprep Lab: Explore and Shape Data with Cloud Dataprep Storing and Exporting Data Compare Permanent vs Temporary Tables Save and Export Query Results Performance Preview: Query Cache Lab: Creating new Permanent Tables Ingesting New Datasets into Google BigQuery Query from External Data Sources Avoid Data Ingesting Pitfalls Ingest New Data into Permanent Tables Discuss Streaming Inserts Lab: Ingesting and Querying New Datasets Data Visualization Overview of Data Visualization Principles Exploratory vs Explanatory Analysis Approaches Demo: Google Data Studio UI Connect Google Data Studio to Google BigQuery Lab: Exploring a Dataset in Google Data Studio Joining and Merging Datasets Merge Historical Data Tables with UNION Introduce Table Wildcards for Easy Merges Review Data Schemas: Linking Data Across Multiple Tables Walkthrough JOIN Examples and Pitfalls Lab: Join and Union Data from Multiple Tables Advanced Functions and Clauses Review SQL Case Statements Introduce Analytical Window Functions Safeguard Data with One-Way Field Encryption Discuss Effective Sub-query and CTE design Compare SQL and Javascript UDFs Lab: Deriving Insights with Advanced SQL Functions Schema Design and Nested Data Structures Compare Google BigQuery vs Traditional RDBMS Data Architecture Normalization vs Denormalization: Performance Tradeoffs Schema Review: The Good, The Bad, and The Ugly Arrays and Nested Data in Google BigQuery Lab: Querying Nested and Repeated Data More Visualization with Google Data Studio Create Case Statements and Calculated Fields Avoid Performance Pitfalls with Cache considerations Share Dashboards and Discuss Data Access considerations Optimizing for Performance Avoid Google BigQuery Performance Pitfalls Prevent Hotspots in your Data Diagnose Performance Issues with the Query Explanation map Lab: Optimizing and Troubleshooting Query Performance Advanced Insights Introducing Cloud Datalab Cloud Datalab Notebooks and Cells Benefits of Cloud Datalab Data Access Compare IAM and BigQuery Dataset Roles Avoid Access Pitfalls Review Members, Roles, Organizations, Account Administration, and Service Accounts

PL-200T00 Microsoft Power Platform Functional Consultant
By Nexus Human
Duration 5 Days 30 CPD hours This course is intended for A Microsoft Power Platform Functional Consultant is responsible for creating and configuring apps, automations, and solutions. They act as the liaison between users and the implementation team. The functional consultant promotes utilization of solutions within an organization. The functional consultant may perform discovery, engage subject matter experts and stakeholders, capture requirements, and map requirements to features. They implement components of a solution including application enhancements, custom user experiences, system integrations, data conversions, custom process automation, and simple visualizations. This course will teach you to use Microsoft Power Platform solutions to simplify, automate, and empower business processes for organizations in the role of a Functional Consultant. A Microsoft Power Platform Functional Consultant is responsible for creating and configuring apps, automations, and solutions. They act as the liaison between users and the implementation team. The functional consultant promotes utilization of solutions within an organization. The functional consultant may perform discovery, engage subject matter experts and stakeholders, capture requirements, and map requirements to features. They implement components of a solution including application enhancements, custom user experiences, system integrations, data conversions, custom process automation, and simple visualizations. This course may contain a 1-day Applied Workshop. This workshop will allow you to practice your Functional Consultant skills by creating an end-to-end solution to solve a problem for a fictitious company. The solution will include a Microsoft Dataverse database, Power Apps canvas app, and Power Automate flows. Prerequisites Experience as an IT professional or student Working knowledge of Microsoft Power Platform and its key components Knowledge of Microsoft Dataverse (or general data modeling) and security concepts 1 - Describe the business value of the Microsoft Power Platform Explore Microsoft Power Platform Describe the business value of the Power Platform Explore connectors and Microsoft Dataverse Describe how Power Platform works with Microsoft 365 apps and services Explore how Power Platform works with Microsoft Teams Describe how Power Platform works with Microsoft Dynamics 365 apps Describe how Power Platform solutions consume Microsoft Azure services Explore how Microsoft Power Platform apps work together Use Artificial Intelligence to increase productivity 2 - Core components of Power Pages Get started with Power Pages Core tools and components of Power Pages Overview of Power Pages security Overview of Power Pages extensibility 3 - Explore Power Pages templates Site design templates Scenario-based templates Dynamics 365 Power Pages site templates 4 - Explore Power Pages design studio Work with pages Page components Site styling and templates 5 - Explore Power Pages design studio data and security features Data workspace in Power Pages design studio Power Pages security features 6 - Introduction to Power Pages administration Power Pages administrative tools Set up workspace in Power Pages design studio 7 - Get started building with Power BI Use Power BI Building blocks of Power BI Tour and use the Power BI service 8 - Get data with Power BI Desktop Overview of Power BI Desktop Explore Power BI Desktop Connect to data sources Get data from Excel Transform data to include in a report Combine data from multiple sources Clean data to include in a report 9 - Model data in Power BI How to manage your data relationships Create calculated columns Optimize data models Create measures Create calculated tables Explore time-based data 10 - Use visuals in Power BI Create and customize simple visualizations Create slicers Map visualizations Matrices and tables Create scatter, waterfall, and funnel charts Modify colors in charts and visuals Page layout and formatting 11 - Explore data in Power BI Quick insights in Power BI Create and configure a dashboard Ask questions of your data with natural language Create custom Q&A suggestions Share dashboards with your organization Display visuals and tiles in full screen Edit tile details and add widgets Get more space on your dashboard 12 - Publish and share in Power BI Publish Power BI Desktop reports Print and export dashboards and reports Introducing Power BI Mobile Create workspaces in Power BI Build apps Use apps Integrate OneDrive for Business with Power BI Publish to web 13 - Create and manage workspaces in Power BI Distribute a report or dashboard Monitor usage and performance Recommend a development life cycle strategy Troubleshoot data by viewing its lineage Configure data protection 14 - Manage semantic models in Power BI Use a Power BI gateway to connect to on-premises data sources Configure a semantic model scheduled refresh Configure incremental refresh settings Manage and promote semantic models Troubleshoot service connectivity Boost performance with query caching (Premium) 15 - Create dashboards in Power BI Configure data alerts Explore data by asking questions Review Quick insights Add a dashboard theme Pin a live report page to a dashboard Configure a real-time dashboard Set mobile view 16 - Implement row-level security Configure row-level security with the static method Configure row-level security with the dynamic method 17 - Create tables in Dataverse Table characteristics Table relationships Dataverse logic and security Dataverse auditing Dual-write vs. virtual tables 18 - Manage tables in Dataverse Identify tables and table types in Dataverse Create a custom table Enable attachments within a table Licensing requirements for each table type 19 - Create and manage columns within a table in Dataverse Define columns in Microsoft Dataverse Column types in Microsoft Dataverse Add a column to a table Create a primary name column Restrictions that apply to columns in a table Create an auto numbering column Create an alternate key 20 - Create a relationship between tables in Dataverse Relate one or more tables - Introduction Relationship types that are available in Microsoft Dataverse Create a one-to-many relationship between tables Create a many-to-many relationship between tables Edit or delete relationships 21 - Working with choices in Dataverse Define choice column Standard choices column 22 - Get started with security roles in Dataverse Understand environment roles Adding or disabling an environment user Understand security concepts in Dataverse Understand user security roles and security role defaults Check the roles that a user belongs to Configure Dataverse teams for security Configure Dataverse group teams for security 23 - Use administration options for Dataverse Use Microsoft Power Platform Admin Center portal Tenant storage capacity Advanced Customization options in Power Apps Portal Enable and disable auditing 24 - Manage Dynamics 365 model-driven app settings and security Configure role-based security Manage teams and business units Explore settings and customizations 25 - Introduction to Microsoft Power Platform security and governance Identify Microsoft Power Platform environments Data Loss Prevention policies Microsoft Power Platform Center of Excellence Starter Kit 26 - Get started with model-driven apps in Power Apps Introducing model-driven apps Components of model-driven apps Design model-driven apps Incorporate business process flows 27 - Configure forms, charts, and dashboards in model-driven apps Forms overview Form elements Configure multiple forms Use specialized form components Configure views overview Configure grids Create and edit views Configure charts overview Dashboards overview Use interactive streams and tiles 28 - Get started with Power Apps canvas apps Power Apps building blocks Ways to build Power Apps Power Apps related technologies Additional Power Apps related technologies Designing a Power Apps app 29 - Connect to other data in a Power Apps canvas app Overview of the different data sources Work with action-based data sources Power Automate is a companion to Power Apps 30 - How to build the UI in a canvas app in Power Apps Use themes to quickly change the appearance of your app Branding a control Icons Images Personalization Using the tablet or phone form factors 31 - Manage apps in Power Apps Power Apps review 32 - Build your first app with Power Apps and Dataverse for Teams Create your first app with the hero template Customize your app with Power Apps Studio Publish your app Install template apps 33 - Access Dataverse in Power Pages websites Use lists to display multiple Dataverse records Use forms to interact with Dataverse data 34 - Authentication and user management in Power Pages Power Pages authentication settings User registration in Power Pages Authentication management for Power Pages users Power Pages authentication providers 35 - Power Pages maintenance and troubleshooting Power Pages website maintenance Power Pages website troubleshooting 36 - Define and create business rules in Dataverse Define business rules - Introduction Define the components of a business rule Create a business rule 37 - Get started with Power Automate Introducing Power Automate Troubleshoot flows 38 - Use the Admin center to manage environments and data policies in Power Automate Administer flows Export and import flows Learn how to distribute button flows 39 - Use Dataverse triggers and actions in Power Automate Dataverse triggers Query data Create, update, delete, and relate actions 40 - Extend Dataverse with Power Automate Set up a flow and configure its trigger Email Dataverse record Add to-do items Test and run your flow 41 - Introduction to expressions in Power Automate Get started with expressions Notes make things easier Types of functions Write complex expressions 42 - Build your first Power Automate for desktop flow Set up the environment Explore Power Automate for desktop Create your first Power Automate for desktop flow Record Power Automate for desktop actions Edit and test recorded actions 43 - Run a Power Automate for desktop flow in unattended mode Set up an unattended desktop flow Create a new cloud flow that calls an existing flow in unattended mode Perform a test run Best practices 44 - Optimize your business process with process advisor Get familiar with process advisor Create your first recording Edit recordings and group actions Analyze recordings and interpret results Automation recommendations 45 - Get started with Microsoft Copilot Studio bots Get started working with environments Create bots and work with the Microsoft Copilot Studio interface Create topics Test bots Publish bots and analyze performance 46 - Enhance Microsoft Copilot Studio bots Use Power Automate to add actions Transfer conversations to agents by using Omnichannel for Customer Service Create topics for existing support content Analyze bot performance 47 - Manage topics in Microsoft Copilot Studio Work with bot topics Branch a topic Create topics for existing support content Work with system fallback topics Manage topics 48 - Manage Power Virtual Agents Environments in Microsoft Copilot Studio Bot topics permissions Bot entities and flow permissions Monitor and diagnose Administer and manage Export and import bots Authentication 49 - Get started building with Power BI Use Power BI Building blocks of Power BI Tour and use the Power BI service 50 - Get data with Power BI Desktop Overview of Power BI Desktop Explore Power BI Desktop Connect to data sources Get data from Excel Transform data to include in a report Combine data from multiple sources Clean data to include in a report 51 - Model data in Power BI How to manage your data relationships Create calculated columns Optimize data models Create measures Create calculated tables Explore time-based data 52 - Use visuals in Power BI Create and customize simple visualizations Create slicers Map visualizations Matrices and tables Create scatter, waterfall, and funnel charts Modify colors in charts and visuals Page layout and formatting 53 - Explore data in Power BI Quick insights in Power BI Create and configure a dashboard Ask questions of your data with natural language Create custom Q&A suggestions Share dashboards with your organization Display visuals and tiles in full screen Edit tile details and add widgets Get more space on your dashboard 54 - Publish and share in Power BI Publish Power BI Desktop reports Print and export dashboards and reports Introducing Power BI Mobile Create workspaces in Power BI Build apps Use apps Integrate OneDrive for Business with Power BI Publish to web 55 - Manage solutions in Power Apps and Power Automate Add and remove apps, flows, and entities in a solution Edit a solution-aware app, flow, and table Build and deploy a complex solution with flows, apps, and entities Automate solution management 56 - Load/export data and create data views in Dataverse View data in a table Create or edit views of data in a table Load data into a table Export data from a table Add, update, or delete data in a table by using Excel Import data using Power Query Generate a new dataflow from an Excel Template Dataflow and Azure integration 57 - Get started with AI Builder Choose an AI capability Create your first model Ways to use your models 58 - Manage models in AI Builder Model lifecycle Manage model versions Share your models 59 - Use AI Builder in Power Automate AI Builder in Power Automate saves time Advanced usage of AI Builder in Power Automate 60 - Functional Consultant skills Create entity relationship diagrams Create and document mock-ups Document functional requirements and artifacts Complete fit-gap analysis Discuss stakeholder management responsibilities Understand industry accelerators Define Application Lifecycle Management Participate in testing Evaluate options Define connectors Understand Power Apps component framework 61 - Solution Architect series: Plan application lifecycle management for Power Platform Key considerations for ALM Solutions Configuration and reference data Release process ALM with Azure DevOps
Right Aligned – Inside Design – Branding Our Studio
By Right Aligned
In this series we are going behind–the–scenes with established studios and hearing how they created their own brand.

The Art of Doing: Dive Into Android Development with Kotlin
By Packt
This course will help you to gain a mastery level understanding of the fundamentals of Android Studio, Android app development, and the Kotlin programming language by building six full-fledged applications as well as many more 'learning' applications throughout the course.
1 to 1 Vocal coaching
By Gadd Music Vocal Studio
Gadd Music Vocal Studio Your Rock \ Pop singing teacher

AI-050T00 Develop Generative AI Solutions with Azure OpenAI Service
By Nexus Human
Duration 1 Days 6 CPD hours This course is intended for The audience for this course includes software developers and data scientists who need to use large language models for generative AI. Some programming experience is recommended, but the course will be valuable to anyone seeking to understand how the Azure OpenAI service can be used to implement generative AI solutions. Note Generative AI is a fast-evolving field of artificial intelligence, and the Azure OpenAI service is subject to frequent changes. The course materials are maintained to reflect the latest version of the service at the time of writing. Azure OpenAI Service provides access to OpenAI's powerful large language models such as GPT; the model behind the popular ChatGPT service. These models enable various natural language processing (NLP) solutions to understand, converse, and generate content. Users can access the service through REST APIs, SDKs, and Azure OpenAI Studio. In this course, you'll learn how to provision Azure OpenAI service, deploy models, and use them in generative AI applications. Prerequisites Familiarity with Azure and the Azure portal. Experience programming with C# or Python. 1 - Get started with Azure OpenAI Service Access Azure OpenAI Service Use Azure OpenAI Studio Explore types of generative AI models Deploy generative AI models Use prompts to get completions from models Test models in Azure OpenAI Studio's playgrounds 2 - Build natural language solutions with Azure OpenAI Service Integrate Azure OpenAI into your app Use Azure OpenAI REST API Use Azure OpenAI SDK 3 - Apply prompt engineering with Azure OpenAI Service Understand prompt engineering Write more effective prompts Provide context to improve accuracy 4 - Generate code with Azure OpenAI Service Construct code from natural language Complete code and assist the development process Fix bugs and improve your code 5 - Generate images with Azure OpenAI Service What is DALL-E? Explore DALL-E in Azure OpenAI Studio Use the Azure OpenAI REST API to consume DALL-E models 6 - Use your own data with Azure OpenAI Service Understand how to use your own data Add your own data source Chat with your model using your own data Additional course details: Nexus Humans AI-050T00: Develop Generative AI Solutions with Azure OpenAI Service training program is a workshop that presents an invigorating mix of sessions, lessons, and masterclasses meticulously crafted to propel your learning expedition forward. This immersive bootcamp-style experience boasts interactive lectures, hands-on labs, and collaborative hackathons, all strategically designed to fortify fundamental concepts. Guided by seasoned coaches, each session offers priceless insights and practical skills crucial for honing your expertise. Whether you're stepping into the realm of professional skills or a seasoned professional, this comprehensive course ensures you're equipped with the knowledge and prowess necessary for success. While we feel this is the best course for the AI-050T00: Develop Generative AI Solutions with Azure OpenAI Service course and one of our Top 10 we encourage you to read the course outline to make sure it is the right content for you. Additionally, private sessions, closed classes or dedicated events are available both live online and at our training centres in Dublin and London, as well as at your offices anywhere in the UK, Ireland or across EMEA.
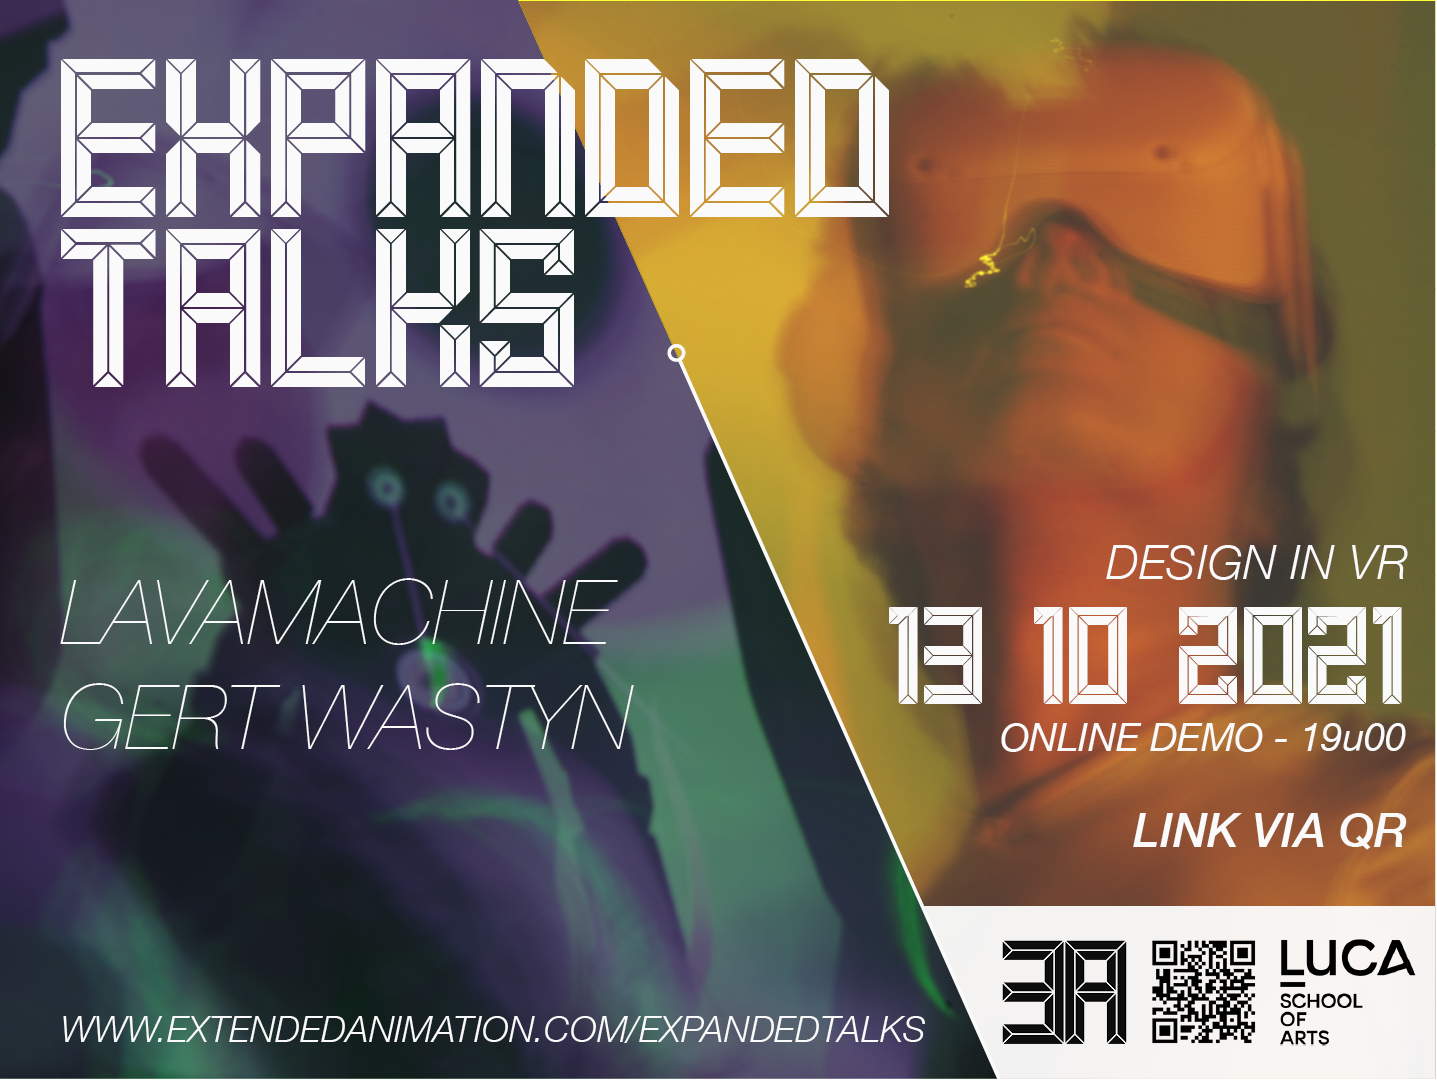
Expanded Talks: Design in VR w/ animation studio Lavamachine
By LUCA School of Arts
Expanded Talks webinar about design in with VR on 13/10 at 19h CET. Live demo with studio Lavamachine Design in VR with Multibrush and other VR tools.
Robotic Process Automation - RPA Fundamentals and Build a Robot
By Packt
This course will help you get a deeper understanding of Robotic Process Automation (RPA) with hands-on experience by helping you build your own automated robot using UiPath Studio.