- Professional Development
- Medicine & Nursing
- Arts & Crafts
- Health & Wellbeing
- Personal Development
25880 Courses in Cardiff delivered Online
Tableau Advanced v10.3
By Nexus Human
Duration 2 Days 12 CPD hours This course is intended for This course is intended for those who need to use Tableau Desktop to build complex visuals and dashboards to present information or to monitor data about their organization. Overview Upon completion of this course, participants will be able to:Select the best method to work with multiple data sourcesCreate complex visuals using calculations and parametersApply best practices to improve the layout and aesthetics of dashboards This course enables participants to create complex visualizations and to combine them into interactive dashboards to share with others using Tableau Desktop. The Data Data Interpreter Data Joins Same Database Cross Databases Spatial Join New! Data Blending New Union Custom SQL Tableau Extract TDE Hyper Clipboard Database Changes Automatic Updates Calculations Regular Calculations Quick Table Calculations Table Calculations Level of Detail (LOD) Expressions Complex Visualizations Custom Background Map Web Map Servers Dual Maps Bar in Bar Graph Bullet Graph Pareto Chart Sparkline Report Top N Within a Category Report Waterfall Chart Funnel Chart Pattern Analysis using the Path Shelf Building Better Dashboards Best Practices for Design Best Practices for Performance Creating a Template Workbook Using Layout Containers Dashboard Extenders New! Generating A Performance Summary Additional course details: Nexus Humans Tableau Advanced v10.3 training program is a workshop that presents an invigorating mix of sessions, lessons, and masterclasses meticulously crafted to propel your learning expedition forward. This immersive bootcamp-style experience boasts interactive lectures, hands-on labs, and collaborative hackathons, all strategically designed to fortify fundamental concepts. Guided by seasoned coaches, each session offers priceless insights and practical skills crucial for honing your expertise. Whether you're stepping into the realm of professional skills or a seasoned professional, this comprehensive course ensures you're equipped with the knowledge and prowess necessary for success. While we feel this is the best course for the Tableau Advanced v10.3 course and one of our Top 10 we encourage you to read the course outline to make sure it is the right content for you. Additionally, private sessions, closed classes or dedicated events are available both live online and at our training centres in Dublin and London, as well as at your offices anywhere in the UK, Ireland or across EMEA.

Advanced Tableau
By Nexus Human
Duration 2.5 Days 15 CPD hours This course is intended for This course is intended for those with a basic understanding of Tableau who want to pursue mastery of the advanced features. Overview The goal of this course is to present essential Tableau concepts and its advanced functionalities to help better prepare and analyze data. This course will use Tableau Hyper, Tableau Prep and more. Getting Up to Speed ? a Review of the Basics Connecting Tableau to your data Connecting to Tableau Server Connecting to saved data sources Measure Names and Measure Values Three essential Tableau concepts Exporting data to other devices Summary All About Data ? Getting Your Data Ready Data mining and knowledge discovery process models CRISP?DM All About Data ? Joins, Blends, and Data Structures All About Data - Joins, Blends, and Data Structures Introduction to joins Introduction to complex joins Exercise: observing join culling Introduction to join calculations Introduction to spatial joins Introduction to unions Understanding data blending Order of operations No dimensions from a secondary source Introduction to scaffolding Introduction to data structures Exercise: adjusting the data structure for different questions Summary Table Calculations Table Calculations A definition and two questions Introduction to functions Directional and non-directional table calculations Application of functions Summary Level of Detail Calculations Level of Detail Calculations Building playgrounds Playground I: FIXED and EXCLUDE Playground II: INCLUDE Practical application Exercise: practical FIXED Exercise: practical INCLUDE Exercise: practical EXCLUDE Summary Beyond the Basic Chart Types Beyond the Basic Chart Types Improving popular visualizations Custom background images Tableau extensions Summary Mapping Mapping Extending Tableau's mapping capabilities without leaving Tableau Extending Tableau mapping with other technology Exercise: connecting to a WMS server Exploring the TMS file Exploring Mapbox Accessing different maps with a dashboard Creating custom polygons Converting shape files for Tableau Exercise: polygons for Texas Heatmaps Summary Tableau for Presentations Tableau for Presentations Getting the best images out of Tableau From Tableau to PowerPoint Embedding Tableau in PowerPoint Animating Tableau Story points and dashboards for Presentations Summary Visualization Best Practices and Dashboard Design Visualization Best Practices and Dashboard Design Visualization design theory Formatting rules Color rules Visualization type rules Compromises Keeping visualizations simple Dashboard design Dashboard layout Sheet selection Summary Advanced Analytics Advanced Analytics Self-service Analytics Use case ? Self-service Analytics Use case ? Geo-spatial Analytics Summary Improving Performance Improving Performance Understanding the performance-recording dashboard Exercise: exploring performance recording in Tableau desktop Performance-recording dashboard events Behind the scenes of the performance- recording dashboard Hardware and on-the-fly techniques Hardware considerations On-the-fly-techniques Single Data Source > Joining > Blending Three ways Tableau connects to data Using referential integrity when joining Advantages of blending Efficiently working with data sources Tuning data sources Working efficiently with large data sources Intelligent extracts Understanding the Tableau data extract Constructing an extract for optimal performance Exercise: summary aggregates for improved performance Optimizing extracts Exercise: materialized calculations Using filters wisely Extract filter performance Data source filter performance Context filters Dimension and measure filters Table-calculation filters Efficient calculations Boolean/Numbers > Date > String Additional performance considerations Avoid overcrowding a dashboard Fixing dashboard sizing Setting expectations Summary Additional course details: Nexus Humans Advanced Tableau training program is a workshop that presents an invigorating mix of sessions, lessons, and masterclasses meticulously crafted to propel your learning expedition forward. This immersive bootcamp-style experience boasts interactive lectures, hands-on labs, and collaborative hackathons, all strategically designed to fortify fundamental concepts. Guided by seasoned coaches, each session offers priceless insights and practical skills crucial for honing your expertise. Whether you're stepping into the realm of professional skills or a seasoned professional, this comprehensive course ensures you're equipped with the knowledge and prowess necessary for success. While we feel this is the best course for the Advanced Tableau course and one of our Top 10 we encourage you to read the course outline to make sure it is the right content for you. Additionally, private sessions, closed classes or dedicated events are available both live online and at our training centres in Dublin and London, as well as at your offices anywhere in the UK, Ireland or across EMEA.
Health & Safety Awareness
By Prima Cura Training
All employees should be aware of and knowledgeable about health and safety in the workplace. This course is ideal for all staff and employees at all levels, providing them with the underpinning health and safety knowledge that they will require to work safely and efficiently on a daily basis.

BOX310 SAP BusinessObjects Dashboards 4.1
By Nexus Human
Duration 3 Days 18 CPD hours This course is intended for The primary audience for this course are Application Consultants, Business Analysts, and Business Process Owners/Team Leads/Power Users. In this course, students are enabled to transform Excel workbooks into captivating dashboards for executives and business users. Introduction to Dashboards Creating Interactive Dashboards Using an Embedded Excel Workbook in the Dashboard Data Visualizations with Charts Using Data in a Range Using Data in a Series Preparing Future Data by Ignoring End Blanks Dashboard Distribution Distributing a Dashboard Single Value Components Using Single Value Components Alerts Setting Up Alerts Selectors Using Selectors Setting Default Values for Selectors Selecting Multiple Items Common Components Using Images in a Dashboard Using Tables in a Dashboard Using an Interactive Calendar in a Dashboard Adding a URL to a Dashboard Components Used as Selectors Using the Chart Component as a Selector Using the Map Component as a Selector Format Options Configuring Proportional Size and Position Using Themes to Apply Formats Using Templates to Apply Formats Applying Globalization Dynamic Visability Adding Dynamic Visibility Using Formulas to Create Dynamic Visibility Creating Multi-Layer Dashboards Dashboard Design Optimization Optimizing Dashboard Design Dashboard Connection to Live Data Using Live Data Sources Setting Up an XML Connection Using Web Services to Connect to Data Using the Query Browser to Connect to Data Using the Portal Data Connection to Connect to Data Additional course details: Nexus Humans BOX310 SAP BusinessObjects Dashboards 4.1 training program is a workshop that presents an invigorating mix of sessions, lessons, and masterclasses meticulously crafted to propel your learning expedition forward. This immersive bootcamp-style experience boasts interactive lectures, hands-on labs, and collaborative hackathons, all strategically designed to fortify fundamental concepts. Guided by seasoned coaches, each session offers priceless insights and practical skills crucial for honing your expertise. Whether you're stepping into the realm of professional skills or a seasoned professional, this comprehensive course ensures you're equipped with the knowledge and prowess necessary for success. While we feel this is the best course for the BOX310 SAP BusinessObjects Dashboards 4.1 course and one of our Top 10 we encourage you to read the course outline to make sure it is the right content for you. Additionally, private sessions, closed classes or dedicated events are available both live online and at our training centres in Dublin and London, as well as at your offices anywhere in the UK, Ireland or across EMEA.
B6098 IBM Cognos Analytics - Author Active Reports (v11.0)
By Nexus Human
Duration 1 Days 6 CPD hours This course is intended for Report authors wanting to develop interactive report content, or content disconnected from IBM Cognos servers. In this course, participants increase their IBM Cognos Analytics experience by building interactive reports using Active Report controls, which can be distributed to and consumed by users in a disconnected environment, including mobile devices. Introduction to IBM Cognos Active Reports Examine IBM Cognos Active Reports Convert an existing report into an Active Report Add interactions in Active Reports using Active Report connections Create a basic Active Report Examine interactive behavior of Active Report controls Save a report in the IBM Cognos Analytics portal Save an Active Report to an MHT file Save an Active Report as a report template Use an Active Report as a prompt page Understand Active Report security Use Active Report Connections Examine Active Report connections Filter and select in controls using Active Report connections Examine variables Use a single variable to control multiple controls Use multiple variables to show different data in different controls Use Active Report controls to support mobile device usage Active Report Charts & Decks Add charts to active reports Understand and optimize chart behavior Examine decks and data decks Optimize use of decks Review Master Detail relationships Examine RAVE visualizations
Tue 25 Mar 2025 - Resilience, stress and boundaries
By Hospice Income Generation Network
Resilience, stress and boundaries - essential skills for fundraisers Facilitated by Claire Warner Charity Culture, Wellbeing & Leadership Specialist Aimed at those working in fundraising and marcomms roles in UK hospices - - - Fundraising is tough. It’s emotionally demanding, fast-paced, and often unpredictable. To keep going, you need more than passion—you need resilience, stress management, and strong boundaries to protect your wellbeing. Join us for this interactive, practical workshop. You’ll learn: ✅ How to build resilience and stay steady under pressure ✅ The signs of stress and quick strategies to manage it ✅ How to set and maintain boundaries to prevent burnout This session isn’t just theory - we’ll share real-life tools, group discussions, and practical exercises to help you navigate the challenges of your role with confidence. - - - Claire Warner (she/her) is a Charity Culture, Wellbeing & Leadership Specialist. Before developing this specialism, Claire had 19 years working in the charity sector, including 10 years in Director / Senior Leader roles. But it was a period of significant unwellbeing (breast cancer) that led Claire to the career change. And it was in conducting a large piece of research into sector wellbeing, that Claire recognised this significant gap in provision and went on to create Lift. In 2020, Claire won the Best Digital Leader Award at the Social CEO Awards for her wellbeing work during the pandemic. In 2021, she curated the first Charity Workplace Wellbeing Summit and was named as one of Charity Times Magazine’s 20 Pandemic Pioneers. Claire lives in rural Lancashire with her husband, their two daughters, Rowan the dog and horses Maddie and Bernie.

SGI Webinar - THOUGHT LEADERSHIP WEBINAR
By Centre for Competitiveness
Learn how to drive innovation in your organisation and foster a creative, adaptive and sustainable work environment.

Keep Going With QuickBooks 2021 for Windows
By Nexus Human
Duration 2 Days 12 CPD hours Overview What's New in This Guide? The behind-the-scenes journal entry for transactions is now included. This course is a continuation of topics following ?Get Started with QuickBooks 2021 for Windows?. First-time QuickBooks users will learn the basic features of the software. Experienced QuickBooks users will quickly learn the new features and functionality of QuickBooks 2021. This course covers features that are in QuickBooks Pro and Premier 2021. Memorizing Transactions Entering a New Memorized Transaction Editing a Memorized Transaction Deleting a Memorized Transaction Grouping Memorized Transactions Using a Memorized Transaction Printing the Memorized Transaction List Customizing Forms Creating a Custom Template Modifying a Template Printing Forms Using Other QuickBooks Accounts Other QuickBooks Account Types Working with Credit Card Transactions Working with Fixed Assets Working with Long-Term Liability Accounts Using the Loan Manager Creating Reports Working with Quick Reports Working with Preset Reports Sharing Reports Exporting Reports to Microsoft Excel Printing Reports Creating Graphs Creating QuickInsight Graphs Using QuickZoom with Graphs Working with the Sales Graph Customizing Graphs Printing Graphs Tracking and Paying Sales Tax Using Sales Tax in QuickBooks Setting Up Tax Rates and Agencies Indicating Who and What Gets Taxed Applying Tax to Each Sale Determining What You Owe Paying Your Tax Agencies Preparing Payroll with QuickBooks Using Payroll Tracking Setting Up for Payroll Setting Up Employee Payroll Information Setting Up a Payroll Schedule Writing a Payroll Check Printing Paycheck Stubs Tracking Your Tax Liabilities Paying Payroll Taxes Preparing Payroll Tax Forms Using Online Banking Setting Up an Internet Connection Setting Up Bank Feeds for Accounts Viewing, Downloading, and Adding Online Transactions Creating Online Payments Transferring Funds Online Canceling Online Payments Managing Company Files Using QuickBooks in Multi-user Mode Setting Up Users and Passwords Setting a Closing Date Sharing Files with an Accountant Updating QuickBooks Backing Up and Restoring a Company File Condensing a Company File Estimating, Time Tracking, and Job Costing Creating Job Estimates Creating an Invoice from an Estimate Displaying Reports for Estimates Updating the Job Status Tracking Time Displaying Reports for Time Tracking Tracking Vehicle Mileage Displaying Vehicle Mileage Reports Displaying Other Job Reports Writing Letters Using the Letters and Envelopes Wizard Customizing Letter Templates Additional course details: Nexus Humans Keep Going With QuickBooks 2021 for Windows training program is a workshop that presents an invigorating mix of sessions, lessons, and masterclasses meticulously crafted to propel your learning expedition forward. This immersive bootcamp-style experience boasts interactive lectures, hands-on labs, and collaborative hackathons, all strategically designed to fortify fundamental concepts. Guided by seasoned coaches, each session offers priceless insights and practical skills crucial for honing your expertise. Whether you're stepping into the realm of professional skills or a seasoned professional, this comprehensive course ensures you're equipped with the knowledge and prowess necessary for success. While we feel this is the best course for the Keep Going With QuickBooks 2021 for Windows course and one of our Top 10 we encourage you to read the course outline to make sure it is the right content for you. Additionally, private sessions, closed classes or dedicated events are available both live online and at our training centres in Dublin and London, as well as at your offices anywhere in the UK, Ireland or across EMEA.
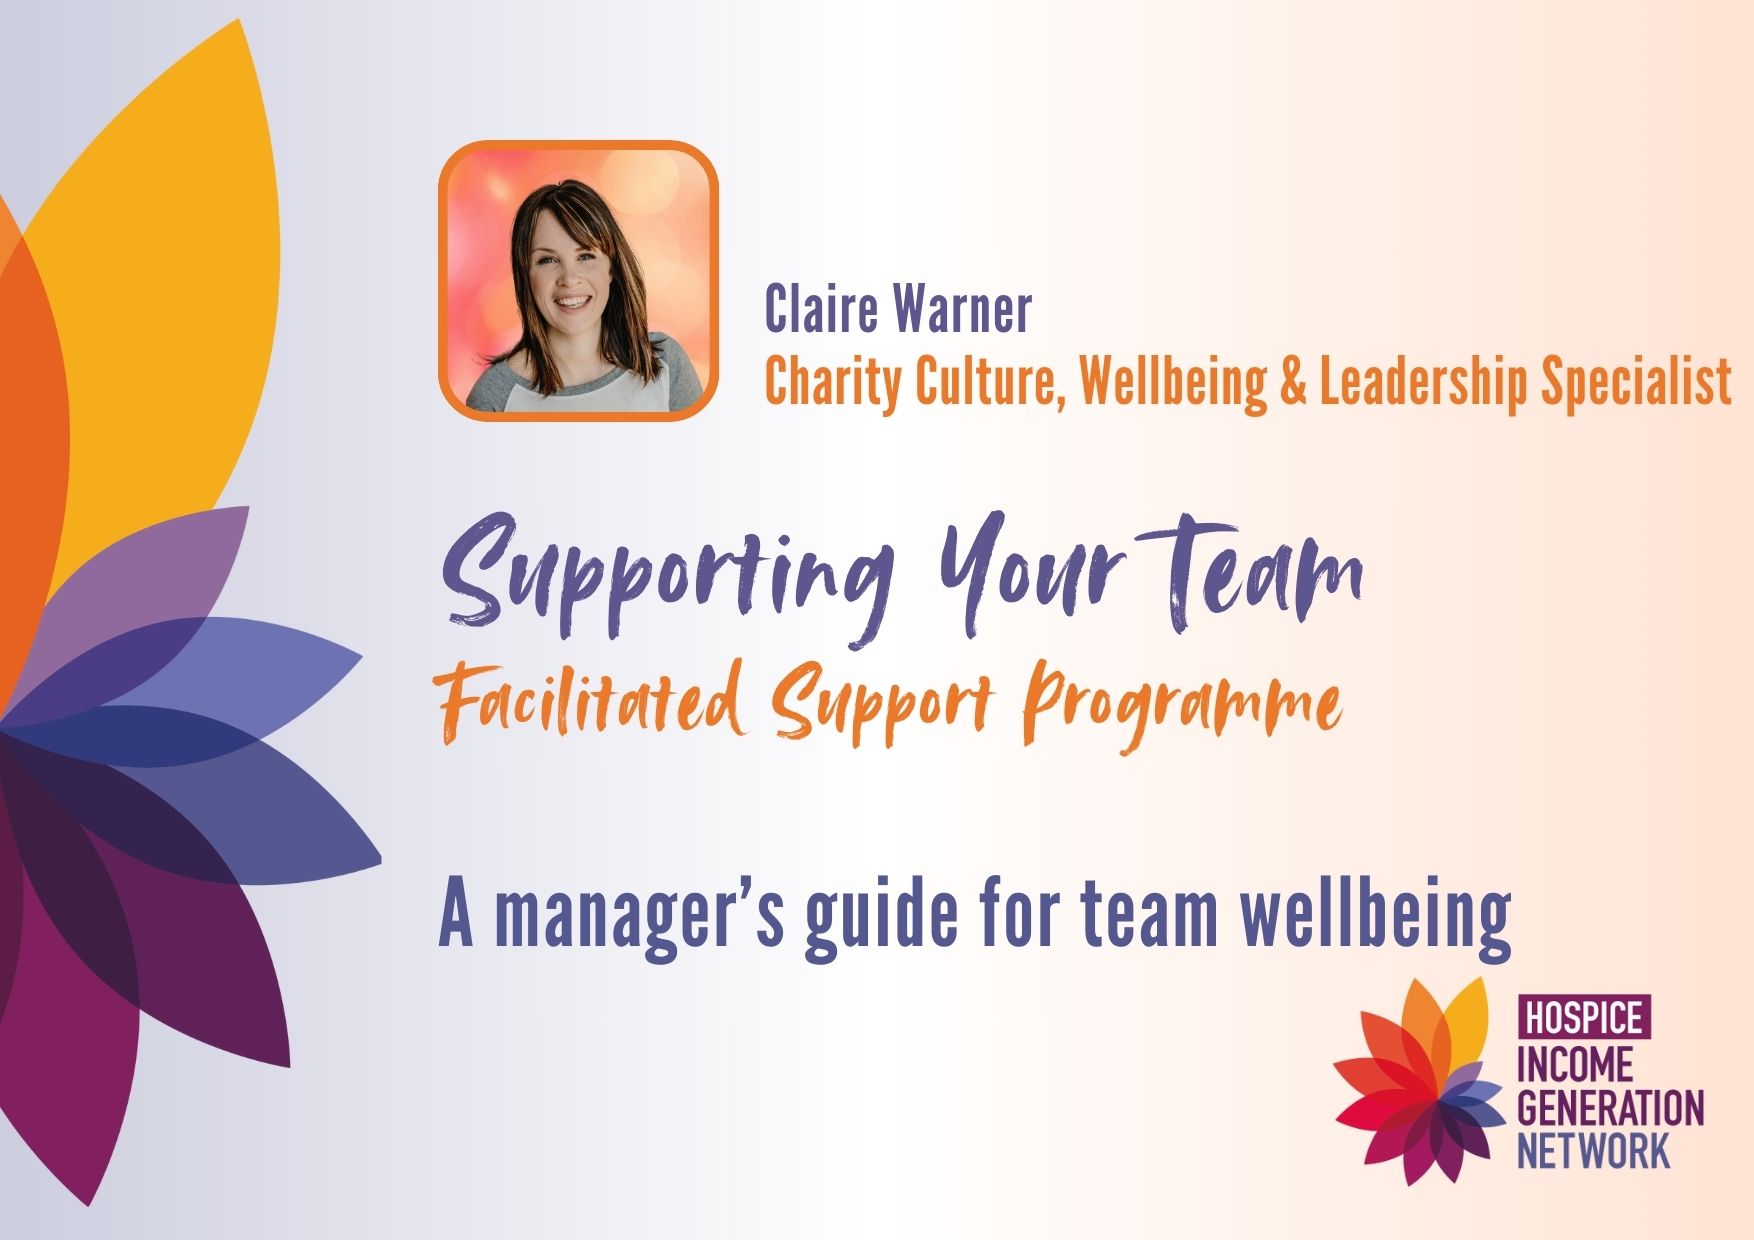
Wed 23 Apr 2025 - Supporting your team
By Hospice Income Generation Network
Supporting your team - a manager's guide Facilitated by Claire Warner Charity Culture, Wellbeing & Leadership Specialist Aimed at managers | heads of | directors working in fundraising and marcomms leadership roles in UK hospices Please only sign up for this session if you have line management responsibility - - - Managing a team of fundraisers isn’t just about hitting targets - it’s about keeping your people motivated, engaged, and well-supported. Hospice fundraising comes with unique pressures, and as a manager, you play a crucial role in helping your team navigate them. This practical, interactive workshop will help you: ✅ Recognise the early signs of stress and burnout in your team ✅ Create a culture of support, resilience, and psychological safety ✅ Implement strategies to balance high performance with team wellbeing With real-life examples, discussion, and actionable takeaways, you’ll leave with the tools and confidence to be a stronger, more effective leader for your fundraisers. - - - Claire Warner (she/her) is a Charity Culture, Wellbeing & Leadership Specialist. Before developing this specialism, Claire had 19 years working in the charity sector, including 10 years in Director / Senior Leader roles. But it was a period of significant unwellbeing (breast cancer) that led Claire to the career change. And it was in conducting a large piece of research into sector wellbeing, that Claire recognised this significant gap in provision and went on to create Lift. In 2020, Claire won the Best Digital Leader Award at the Social CEO Awards for her wellbeing work during the pandemic. In 2021, she curated the first Charity Workplace Wellbeing Summit and was named as one of Charity Times Magazine’s 20 Pandemic Pioneers. Claire lives in rural Lancashire with her husband, their two daughters, Rowan the dog and horses Maddie and Bernie.