- Professional Development
- Medicine & Nursing
- Arts & Crafts
- Health & Wellbeing
- Personal Development
1154 Courses in Bradford delivered Online
Excel Data Analysis
By NextGen Learning
Excel Data Analysis Course Overview The Excel Data Analysis course is designed to equip learners with the essential skills needed to analyse and interpret data using Microsoft Excel. This course covers a range of tools and techniques that are vital for processing, summarising, and visualising data. Learners will explore functions, pivot tables, charts, and data manipulation strategies that will enable them to work efficiently with data sets. By the end of the course, learners will be able to transform raw data into meaningful insights, making it an invaluable skill for professionals across various industries. Whether you're looking to improve your data skills or progress in your career, this course offers the foundational knowledge required for data analysis in Excel. Course Description This course delves into the core aspects of Excel Data Analysis, starting with basic functions and advancing to complex data manipulation techniques. Learners will explore how to create and manage pivot tables, perform data filtering, and apply functions such as VLOOKUP and INDEX MATCH. Visualisation tools like charts and graphs will be covered, enabling learners to present their findings in a clear and impactful way. Additionally, learners will be introduced to data modelling, conditional formatting, and advanced formula techniques that will enhance their data analysis capabilities. The course is structured to provide a comprehensive understanding of Excel’s data analysis features, building competency for a wide range of practical applications in both personal and professional settings. Excel Data Analysis Curriculum Module 01: Introduction to Excel for Data Analysis Module 02: Using Excel Functions for Data Manipulation Module 03: Working with Pivot Tables and Pivot Charts Module 04: Data Visualisation: Creating Charts and Graphs Module 05: Advanced Excel Functions for Complex Data Analysis Module 06: Data Filtering and Sorting Techniques Module 07: Conditional Formatting for Data Insights Module 08: Introduction to Data Modelling and Forecasting Module 09: Data Analysis Best Practices and Case Studies (See full curriculum) Who is this course for? Individuals seeking to enhance their data analysis skills. Professionals aiming to advance in data-centric roles. Beginners with an interest in data analysis and Excel. Anyone looking to improve their Excel knowledge for career development. Career Path Data Analyst Business Analyst Financial Analyst Marketing Analyst Operations Manager Administrative Assistant Project Manager Research and Development Analyst

Data visualization and infographics
By Fire Plus Algebra
The insights gained from data analysis are only truly valuable when you can be clearly expressed to other people – bosses, colleagues, clients, customers, or other stakeholders. In this workshop you’ll learn how to turn raw qualitative or quantitative data into a clear visual story through infographics and data visualization. We'll discuss the key principles for planning an effective visual, look at examples of best (and worst) practice, and learn repeatable and practical design techniques for enhancing the story. We'll also give you an overview of useful tools that will help you turn your idea into a finished infographic or data visualization. You could be conjuring up eye-catching slide decks, building effective reports and dashboards, pitching to investors, or presenting persuasive data to your most important customers. This is a fully interactive online workshop, so be prepared to join discussions and get hands on with building your own visualisations. Takeaways Be able to evaluate the elements that make an infographic or visualization effective. Learn quick and repeatable visual tricks for ensuring infographics convey a clear message. Understand how to tailor your approach to different audiences and context. Discover a bunch of free tools and resources to help you build your own visualizations. Understand how online, interactive visualizations work and how to create them. Delivery We deliver our courses over Zoom, to maximise flexibility. The training can be delivered in a single day, or across multiple sessions. All of our courses are live and interactive – every session includes a mix of formal tuition and hands-on exercises. To ensure this is possible, the number of attendees is capped at 16 people. Tutor Alan Rutter is the founder of Fire Plus Algebra. He is a specialist in communicating complex subjects through data visualisation, writing and design. He teaches for General Assembly and runs in-house training for public sector clients including the Home Office, the Department of Transport, the Biotechnology and Biological Sciences Research Council, the Health Foundation, and numerous local government and emergency services teams. He previously worked with Guardian Masterclasses on curating and delivering new course strands, including developing and teaching their B2B data visualisation courses. He oversaw the iPad edition launches of Wired, GQ, Vanity Fair and Vogue in the UK, and has worked with Condé Nast International as product owner on a bespoke digital asset management system for their 11 global markets. Testimonials "Just to say what a great course this was. I have made my first report employing some of the ideas and tools you showed us – to rapturous responses! The next actions are clear for all and they all understood it! Thank you for helping me to organise my data and thoughts, showing how to present the key message up front, and how to keep it simple and focused. Gearing up for another report now!" Kay Anderson | Head of Finance | Mima "We have been using Tableau to display data for some time but knew we could do more to engage our end users. Alan’s training gave us a framework to start thinking about what we wanted to achieve with our visualisations and analysis, and some great tips on how to display information for maximum impact. Alan was an engaging trainer and we found the workshops very energising." Ellen Austin | Senior Data Analyst | London School of Economics

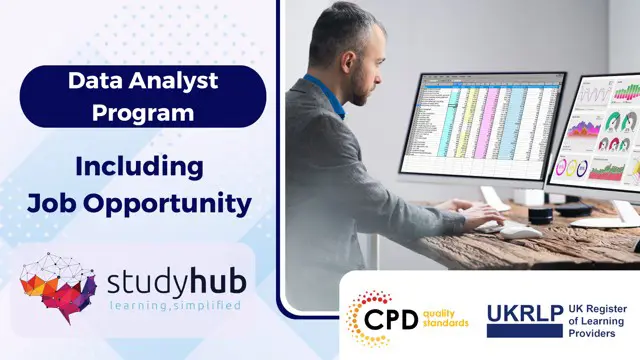
Certified Data Analyst Pathway - Job Ready Program with Career & Money Back Guarantee
(3)By Studyhub UK
Start Your Journey to Becoming a Data Analyst Expert Today, and Make Up to •75,000 The data analytics field is growing rapidly, and there is a high demand for qualified data analysts. With our Data Analyst Program, you can learn the skills you need to succeed in this exciting field. We will help you until you find a job, so you won't have to worry about a thing. Just gain knowledge and learn skills, getting you a job is our duty. Enrol today and take your career to the next level! With our program, we go above and beyond traditional training. We understand that landing a job isn't just about having the right skills-it's about having the right support system by your side. That's why we are committed to being with you every step of the way, from your job search to your ultimate success. Why Choose Us Here's what makes our Data Analyst Program stand out from the crowd: Personalised Job Search Assistance: We're in this together! Our dedicated team will work tirelessly to support your entire job searching process. From crafting a standout resume to submitting it to top companies, we'll ensure you have a compelling application that gets noticed. Expertly Crafted CV: Your resume is your ticket to the interview room. Our professional resume writers will create a customised CV highlighting your unique skills and experiences. This will maximise your chances of standing out among the competition. Strategic Placement: We understand the power of casting a wide net. We'll strategically submit your CV to various platforms and networks, expanding your reach and connecting you with valuable opportunities that align with your career goals. One-On-One Consultation Sessions with Industry Experts: Gain invaluable insights and guidance from seasoned professionals who have thrived in the data analysis field. Our consultation sessions provide you with insider tips, tricks, and advice, empowering you to navigate the industry with confidence and finesse. Comprehensive Skill Development: Our program is designed to equip you with the most sought-after skills in data analysis. From mastering cutting-edge tools to honing your analytical prowess, we'll ensure you have the knowledge and expertise to excel in any data-driven environment. Here are the 25 courses we will provide once you enrol in the program: Course 01: Data Analysis Course 02: Data Science & Machine Learning with R Course 03: Data Analytics with Tableau Course 04: SQL Programming Course 05: Excel Pivot Tables, Pivot Charts, Slicers, and Timelines Course 06: Data Analytics Course 07: Python Data Science with Numpy, Pandas and Matplotlib Course 08: Google Analytics Course 09: Business Intelligence and Data Mining Course 10: Microsoft Excel: Automated Dashboard Using Advanced Formula, VBA, Power Query Course 11: JavaScript Functions Course 12: Data Protection and Data Security (GDPR) Training Certification Course 13: GDPR Training Course 14: Diploma in Python Programming Course 15: Data Center Training Essentials: General Introduction Course 16: Quick Data Science Approach from Scratch Course 17: Diploma in Statistics & Probability for Data Science & Machine Learning Course 18: Master JavaScript with Data Visualization Course 19: Data Analysis and Forecasting in Excel Course 20: AWS Certified Solutions Architect Associate Preparation Course 21: Statistical Analysis Course Course 22: SQL for Data Science, Data Analytics and Data Visualization Course 23: Learn MySQL from Scratch for Data Science and Analytics Course 24: Data Analysis & Forecasting Course 25: Data Structure These courses will help you to develop your knowledge and skills to become a successful data analyst. The Program is completed in 5 easy steps: Step 1 - Enrol in the program and start learning from the courses we provide After you enrol in the Data Analyst Program, you will get lifetime access to 25 premium courses related to data analysis. These courses will teach you the knowledge and skills required to become a successful data analyst. Our customer service team will help you and keep in contact with you every step of the way. Step 2 - Complete your courses and get certifications After learning from the courses, you must obtain certificates for each course. There will be exams for every course, and you have to pass them to get your certificate. To pass successfully, you must get 90% marks for the first course and 80% for the rest relevant courses. Once you pass the exams, you will receive hardcopy certificates. These certificates will prove that you're an expert in the subject. Step 3 - Get a consultation session from a professional data analyst Take your data analysis skills to new heights with a one-on-one consultation session led by a seasoned professional. Gain invaluable insights, expert tips, and tailored advice that will propel your career forward. Step 4 - Complete the CV and attend the interview Once you've successfully obtained the certifications, our team of professionals will build you a compelling CV and LinkedIn profile. With these powerful tools in hand, you'll be fully prepared to tackle job interviews confidently. Kickstart your IT career with a starting salary ranging from •25,000 to •40,000 annually. Step into the IT industry with the assurance of a promising future. Step 5 - We will not leave you until you get a job Our commitment to your success goes above and beyond. We won't stop until you land that dream job. With personalised support, expert guidance, and unwavering dedication, we'll be by your side until you secure the perfect opportunity. Your job search becomes our mission, ensuring you have the best chance at a successful career in data analysis. Don't let your dream career as a data analyst remain out of reach. You just have to learn and gain knowledge and skills. Finding a job is our task! We will remove most of your worries and help you focus on only developing your skills. So join our Data Analyst Program today, and let us be your trusted partner on your journey to success. CPD 100 CPD hours / points Accredited by CPD Quality Standards Who is this course for? This Data Analyst Program is ideal for: Aspiring data analysts eager to launch a successful career in the field. Recent graduates seeking practical skills and industry insights to stand out in a competitive job market. Professionals looking to transition into the dynamic world of data analysis and capitalise on emerging opportunities. Individuals with a passion for numbers, problem-solving, and uncovering meaningful insights from complex datasets. Job seekers seeking comprehensive support and guidance throughout the entire job searching and job finding process. Please Note: Studyhub is a Compliance Central approved resale partner for Quality Licence Scheme Endorsed courses. Requirements No experience required. Just enrol & start learning. Career path Our Data Analyst Program equips you with the skills to excel in data analysis roles. You'll thrive as a data analyst, data scientist, business analyst, or market research analyst, unlocking opportunities in diverse industries such as finance, healthcare, e-commerce, and technology. Act now, and let us guide you towards a brighter future. Enrol today! Certificates CPD Accredited e-Certificate Digital certificate - Included CPD Accredited Framed (Hardcopy) Certificate Hard copy certificate - Included Enrolment Letter Digital certificate - Included Student ID Card Digital certificate - Included The Quality Licence Scheme Endorsed Certificate of Achievement Hard copy certificate - Included
Unleash the Power of Data with the Microsoft Office Specialist Excel Certification for Data Analysis Bundle! In today's data-driven world, employers are increasingly seeking professionals with strong Microsoft Office skills. According to a recent survey by the UK IT Institute, 85% of employers believe that Microsoft Office skills are essential for success in the workplace. From deciphering complex spreadsheets to crafting automated dashboards, this Microsoft Office Specialist Excel Certification bundle is your voyage into the heart of data analytics, guided by the expertise of Microsoft Office. This Microsoft Office Specialist Excel Certification for Data Analysis (Data Analytics) Bundle Contains 18 of Our Premium Courses for One Discounted Price: Course 01: Diploma in Complete Excel Course for All at QLS Level 5 Course 02: Diploma in Microsoft Access Power Pack & Workbooks at QLS Level 5 Course 03: Complete Microsoft Word Course 04: Microsoft Excel Complete Course Course 05: Microsoft Powerpoint Course 06: The Ultimate Microsoft Teams Complete Training Bundle (2020) Course 07: Microsoft Access Power Pack & Workbooks Course 08: Microsoft Excel Training: Depriciation Accounting Course 09: Microsoft Excel: Automated Dashboard Using Advanced Formula, VBA, Power Query Course 10: Ultimate Microsoft Excel For Business Bootcamp Course 11: Touch Typing Masterclass Course 12: Data Entry Administrator Training Course 13: Excel Data Analysis Course 14: SQL Masterclass: SQL For Data Analytics Course 15: Understanding Data Protection and Data Security Course 16: Information Management Course 17: Craft Excel Pivot Tables for Data Reporting Course 18: Business Data Analysis Whether you're looking to start a new career in data analysis or advance your current position, this Microsoft Office Specialist Excel Certification for Data Analysis bundle will give you the skills and knowledge you need to succeed. Learning Outcomes of Microsoft Office Specialist Excel Certification for Data Analysis Bundle Attain QLS Level 5 Diploma in Complete Excel Course, becoming an expert. Master Microsoft Access Power Pack & Workbooks at QLS Level 5. Excel in Microsoft Word, Excel, Powerpoint, and Teams. Unlock automated insights with Advanced Formula, VBA, and Power Query. Dive deep into Data Entry, Typing, and Depreciation Accounting. Conquer SQL for potent Data Analysis. Ensure data security through Understanding Data Protection. Craft compelling reports with Excel Pivot Tables. Why Choose Our Microsoft Office Specialist Excel Certification for Data Analysis Bundle? FREE Microsoft Office Specialist Excel Certification for Data Analysis certificate accredited Get a free student ID card with Microsoft Office Specialist Excel Certification for Data Analysis Training Get instant access to this Microsoft Office Specialist Excel Certification for Data Analysis course. Learn Microsoft Office Specialist Excel Certification for Data Analysis from anywhere in the world The Microsoft Office Specialist Excel Certification for Data Analysis is affordable and simple to understand The Microsoft Office Specialist Excel Certification for Data Analysis is an entirely online, interactive lesson with voiceover audio Lifetime access to the Microsoft Office Specialist Excel Certification for Data Analysis course materials The Microsoft Office Specialist Excel Certification for Data Analysis comes with 24/7 tutor support So enrol now in this Microsoft Office Specialist Excel Certification for Data Analysis Today to advance your career! Embark on a Symphony of Insight: The Microsoft Office Specialist Excel Certification for Data Analysis Bundle Within the tapestry of digital landscapes, where numbers whisper secrets and information orchestrates the dance of decision-making, the Microsoft Office Specialist Excel Certification for Data Analysis (Data Analytics) bundle emerges as a guiding star. With the synergy of Microsoft Office expertise, the finesse of Data Analysis acumen, and the precision of Microsoft Excel, this collection of 20 courses unfolds a narrative of empowerment. From deciphering the enigma of data to crafting narratives that chart success, every module resonates with the harmonious blend of skill and innovation. Discover a world where Microsoft Office becomes a conduit of artistry, Data Analysis unfurls like a story, and Microsoft Excel is the brush that paints insights. Enroll now and let the journey begin - where the symphony of knowledge marries technology to compose a future enriched by understanding, proficiency, and foresight. CPD 180 CPD hours / points Accredited by CPD Quality Standards Who is this course for? This Microsoft Office Specialist Excel Certification for Data Analysis Bundle is ideal for: Aspiring data analysts and professionals eager for Excel excellence. Business personnel seeking efficient data management. Those aiming to thrive in roles demanding data-centric skills Requirements You will not need any prior background or expertise in this Microsoft Office Specialist Excel Certification for Data Analysis Bundle. Career path This Microsoft Office Specialist Excel Certification for Data Analysis bundle will allow you to kickstart or take your career to the next stage in the related sector such as: Data Analyst: £25,000 - £40,000 Business Analyst: £28,000 - £45,000 Information Manager: £30,000 - £50,000 Financial Analyst: £26,000 - £42,000 Database Manager: £32,000 - £55,000 Certificates Digital certificate Digital certificate - Included

Leadership, Agile Project Management and Data Analysis - 3 Courses in 1 Bundle
By Lead Academy
Whether you are self-taught and you want to fill in the gaps for better efficiency and productivity, this Leadership, Agile Project Management and Data Analysis - 3 in 1 course will set you up with a solid foundation to become a confident manager and develop more advanced skills. This comprehensive course is the perfect way to kickstart your career in the field of management. This course will give you a competitive advantage in your career, making you stand out from all other applicants and employees. As one of the leading course providers and most renowned e-learning specialists online, we're dedicated to giving you the best educational experience possible. This course is crafted by industry expert, to enable you to learn quickly and efficiently, and at your own pace and convenience. How Will I Benefit? Boost your career in management Deepen your knowledge and skills in your chosen field just in hours not years! Study a course that is easy to follow. Save money and time by studying at your convenient time Have access to a tutor whenever you are in need So, what are you thinking about! Start getting the benefits by enrolling today! Why Choose Lead Academy: Lifetime Access High-quality e-learning study materials Learn the most in-demand skills Self-paced, no fixed schedules 24/7 customer support through email Available to students anywhere in the world No hidden fee Study in a user-friendly, advanced online learning platform Who is this course for? This comprehensive course is suitable for anyone looking to improve their job prospects or aspiring to accelerate their career in this sector and want to gain in-depth knowledge of management. Entry Requirement There are no academic entry requirements for this course, and it is open to students of all academic backgrounds. As long as you are aged seventeen or over and have a basic grasp of English, numeracy and ICT, you will be eligible to enrol. Career path This course opens a brand new door for you to enter the relevant job market and also provides you with the chance to accumulate in-depth knowledge at the side of needed skills to become flourishing in no time. You will also be able to add your new skills to your CV, enhance your career and become more competitive in your chosen industry. Course Curriculum Diploma in Leadership and Management at QLS Level 4 Personal Effectiveness - How to be an Awesome Professional Monday: Self-confidence Tuesday: Personal Time Management Wednesday: Assert Yourself Thursday: Problem Solving Friday: Presenting Managing Individuals - How to Get the Best From Your People Monday: Goal Setting Tuesday: Delegation Wednesday: Feedback Thursday: Poor Performance Friday: Coaching Communication Skills - How to Make Your Management Voice Heard Monday: Listening Tuesday: Motivating Wednesday: Meetings Thursday: Negotiating Friday: Conflict Team Management - How to Create and Keep a High Performance Team Monday: The Power of Teams Tuesday: Team Development Wednesday: Team Maintenance Thursday: The Four Essentials of Team Management Friday: Team Meetings Manager's Toolkit - How To Adapt to Whatever the Job Throws at You Monday: Emotional Intelligence Tuesday: Transactional Analysis Wednesday: The SCOPE Process Thursday: Selecting Management Styles Friday: The Powerhouse Loop Resources Resources - Leadership & Management Level 4 Agile Project Management Module 01: Introduction Module 02: What is Agile Project Management? Module 03: What is Agile Manifesto? Module 04: Four Foundational Agile Values Module 05: Twelve Supporting Agile Principles Module 06: Role of Leaders in Agile PM Module 07: Managing Diversity in an Agile Team Module 08: Importance of Leadership in Agile Module 09: SCRUM Methodology Module 10: Extreme Programming Methodology Module 11: Stages of Agile Project Management Module 12: Importance of Accountability Module 13: Agile Team - Values & Ethics Module 14: Agile Team Management Module 15: Pitfalls to Effective Communication Module 16: Tips for Effective Communication Assessment Data Analysis Data Analysis 101 Assessment

Do you want to prepare for your dream job but strive hard to find the right courses? Then, stop worrying, for our strategically modified Data Analysis and Data Tools bundle will keep you up to date with the relevant knowledge and most recent matters of this emerging field. So, invest your money and effort in our 30 course mega bundle that will exceed your expectations within your budget. The Data Analysis and Data Tools related fields are thriving across the UK, and recruiters are hiring the most knowledgeable and proficient candidates. It's a demanding field with magnitudes of lucrative choices. If you need more guidance to specialise in this area and need help knowing where to start, then StudyHub proposes a preparatory bundle. This comprehensive Data Analysis and Data Tools bundle will help you build a solid foundation to become a proficient worker in the sector. This Data Analysis and Data Tools Bundle consists of the following 25 CPD Accredited Premium courses - Course 1: Basic Data Analysis Course 2: Excel Data Analysis Course 3: 2021 Python Programming From A-Z: Beginner To Expert Course 4: Python Data Science with Numpy, Pandas and Matplotlib Course 5: 2021 Data Science & Machine Learning with R from A-Z Course 6: Mastering SQL Programming Course 7: Statistics & Probability for Data Science & Machine Learning Course 8: Quick Data Science Approach from Scratch Course 9: R Programming for Data Science Course 10: Learn Python, JavaScript, and Microsoft SQL for Data science Course 11: Google Data Studio: Data Analytics Course 12: Introduction to Excel Data Tools and Data Management Course 13: Data Center Training Essentials: General Introduction Course 14: Web Scraping and Mapping Dam Levels in Python and Leaflet Course 15: Microsoft Power BI - Master Power BI in 90 Minutes! Course 16: PowerBI Formulas Course 17: Business Intelligence and Data Mining Course 18: Financial Ratio Analysis for Business Decisions Course 19: Research Methods in Business Course 20: Cyber Security Incident Handling and Incident Response Course 21: Microsoft Azure 2017 Course 22: AZ-104: Microsoft Azure Administrator Course 23: Microsoft Azure Cloud Concepts Course 24: Advanced Excel Analytics Course 25: Microsoft Access Tables and Queries 5 Extraordinary Career Oriented courses that will assist you in reimagining your thriving techniques- Course 1:Career Development Plan Fundamentals Course 2:CV Writing and Job Searching Course 3:Interview Skills: Ace the Interview Course 4:Video Job Interview for Job Seekers Course 5:Create a Professional LinkedIn Profile Learning Outcome This tailor-made Data Analysis and Data Tools bundle will allow you to- Uncover your skills and aptitudes to break new ground in the related fields Deep dive into the fundamental knowledge Acquire some hard and soft skills in this area Gain some transferable skills to elevate your performance Maintain good report with your clients and staff Gain necessary office skills and be tech savvy utilising relevant software Keep records of your work and make a report Know the regulations around this area Reinforce your career with specific knowledge of this field Know your legal and ethical responsibility as a professional in the related field This Data Analysis and Data Tools Bundle resources were created with the help of industry experts, and all subject-related information is kept updated on a regular basis to avoid learners from falling behind on the latest developments. Certification After studying the complete training you will be able to take the assessment. After successfully passing the assessment you will be able to claim all courses pdf certificates and 1 hardcopy certificate for the Title Course completely free. Other Hard Copy certificates need to be ordered at an additional cost of •8. CPD 300 CPD hours / points Accredited by CPD Quality Standards Who is this course for? Ambitious learners who want to strengthen their CV for their desired job should take advantage of the Data Analysis and Data Tools bundle! This bundle is also ideal for professionals looking for career advancement. Requirements To participate in this course, all you need is - A smart device A secure internet connection And a keen interest in Data Analysis and Data Tools Career path Upon completing this essential Bundle, you will discover a new world of endless possibilities. These courses will help you to get a cut above the rest and allow you to be more efficient in the relevant fields.

Data Analytics Workflows for Artificial Lift, Production and Facility Engineers
By EnergyEdge - Training for a Sustainable Energy Future
About this training course Business Impact: The main aim is to provide insight and understanding of data analytics and machine learning principles through applications. Field data is used to explain data-analysis workflows. Using easy to follow solution scripts, the participants will assess and extract value from the data sets. Hands-on solution approach will give them confidence to try out applicable techniques on data from their field assets. Data analysis means cleaning, inspecting, transforming, and modeling data with the goal of discovering new, useful information and supporting decision-making. In this hands-on 2-day training course, the participants learn some data analysis and data science techniques and workflows applied to petroleum production (specifically artificial lift) while reviewing code and practicing. The focus is on developing data-driven models while keeping our feet closer to the underlying oil and gas production principles. Unique Features: Eight business use cases covering their business impact, code walkthroughs for most all and solution approach. Industry data sets for participants to practice on and take home. No software or complicated Python frameworks required. Training Objectives After the completion of this training course, participants will be able to: Understand digital oil field transformation and its impact on business Examine machine learning methods Review workflows and code implementations After completing the course, participants will have a set of tools and some pathways to model and analyze their data in the cloud, find trends, and develop data-driven models Target Audience This training course is suitable and will greatly benefit the following specific groups: Artificial lift, production and facilities engineers and students to enhance their knowledge base, increase technology awareness, and improve the facility with different data analysis techniques applied on large data sets Course Level Intermediate Advanced Training Methods The course discusses several business use-cases that are amenable to data-driven workflows. For each use case, the instructor will show the solution using a data analysis technique with Python code deployed in the Google cloud. Trainees will solve a problem and tweak their solution. Course Duration: 2 days in total (14 hours). Training Schedule 0830 - Registration 0900 - Start of training 1030 - Morning Break 1045 - Training recommences 1230 - Lunch Break 1330 - Training recommences 1515 - Evening break 1530 - Training recommences 1700 - End of Training The maximum number of participants allowed for this training course is 20. This course is also available through our Virtual Instructor Led Training (VILT) format. Prerequisites: Understanding of petroleum production concepts Knowledge of Python is not a must but preferred to get the full benefit. The training will use the Google Collaboratory environment available in Google-Cloud for hands-on exercises Trainees will need to bring a computer with a Google Chrome browser and a Google email account (available for free) Trainer Your expert course leader has over 35 years' work-experience in multiphase flow, artificial lift, real-time production optimization and software development/management. His current work is focused on a variety of use cases like failure prediction, virtual flow rate determination, wellhead integrity surveillance, corrosion, equipment maintenance, DTS/DAS interpretation. He has worked for national oil companies, majors, independents, and service providers globally. He has multiple patents and has delivered a multitude of industry presentations. Twice selected as an SPE distinguished lecturer, he also volunteers on SPE committees. He holds a Bachelor's and Master's in chemical engineering from the Gujarat University and IIT-Kanpur, India; and a Ph.D. in Petroleum Engineering from the University of Tulsa, USA. Highlighted Work Experience: At Weatherford, consulted with clients as well as directed teams on digital oilfield solutions including LOWIS - a solution that was underneath the production operations of Chevron and Occidental Petroleum across the globe. Worked with and consulted on equipment's like field controllers, VSDs, downhole permanent gauges, multiphase flow meters, fibre optics-based measurements. Shepherded an enterprise-class solution that is being deployed at a major oil and gas producer for production management including artificial lift optimization using real time data and deep-learning data analytics. Developed a workshop on digital oilfield approaches for production engineers. Patents: Principal inventor: 'Smarter Slug Flow Conditioning and Control' Co-inventor: 'Technique for Production Enhancement with Downhole Monitoring of Artificially Lifted Wells' Co-inventor: 'Wellbore real-time monitoring and analysis of fracture contribution' Worldwide Experience in Training / Seminar / Workshop Deliveries: Besides delivering several SPE webinars, ALRDC and SPE trainings globally, he has taught artificial lift at Texas Tech, Missouri S&T, Louisiana State, U of Southern California, and U of Houston. He has conducted seminars, bespoke trainings / workshops globally for practicing professionals: Companies: Basra Oil Company, ConocoPhillips, Chevron, EcoPetrol, Equinor, KOC, ONGC, LukOil, PDO, PDVSA, PEMEX, Petronas, Repsol, , Saudi Aramco, Shell, Sonatrech, QP, Tatneft, YPF, and others. Countries: USA, Algeria, Argentina, Bahrain, Brazil, Canada, China, Croatia, Congo, Ghana, India, Indonesia, Iraq, Kazakhstan, Kenya, Kuwait, Libya, Malaysia, Oman, Mexico, Norway, Qatar, Romania, Russia, Serbia, Saudi Arabia, S Korea, Tanzania, Thailand, Tunisia, Turkmenistan, UAE, Ukraine, Uzbekistan, Venezuela. Virtual training provided for PetroEdge, ALRDC, School of Mines, Repsol, UEP-Pakistan, and others since pandemic. POST TRAINING COACHING SUPPORT (OPTIONAL) To further optimise your learning experience from our courses, we also offer individualized 'One to One' coaching support for 2 hours post training. We can help improve your competence in your chosen area of interest, based on your learning needs and available hours. This is a great opportunity to improve your capability and confidence in a particular area of expertise. It will be delivered over a secure video conference call by one of our senior trainers. They will work with you to create a tailor-made coaching program that will help you achieve your goals faster. Request for further information post training support and fees applicable Accreditions And Affliations

Power BI for Data-driven Decision Makers
By Nexus Human
Duration 1 Days 6 CPD hours This course is intended for This course is designed for professionals in a variety of job roles who receive Power BI data visualizations and reports from data analysts or from data visualization engineers. These data report recipients want to use the features and capabilities of Power BI to fully explore the visualizations and initial analyses provided to them in reports, perform additional analysis to ask next-level questions of the data, and to customize and create new visualizations and dashboards in order to share new insights and create compelling reports. Overview Explore Power BI reports. Analyze data to get answers and insights. Sort and group data for analysis and reporting. Filter visualizations. Prepare reports. Troubleshoot, collaborate, and share reports. As data acquisition, access, analysis, and reporting are interwoven with our businesses and lives, more and more data is collected about business and personal activities. This abundance of data and the computing power to analyze it has increased the use of data analysis and data visualization across a broad range of job roles. Decision makers of all types, including managers and executives, must interact with, interpret, and develop reports based on data and analysis provided to them. Microsoft Power BI software is designed for data analysis and the creation of visualizations. Data analysts prepare data, perform initial analysis, and create visualizations that are then passed to business data decision makers. These decision makers can use Power BI's tools to explore the data, perform further analysis to find new insights, make decisions, and create customized reports to share their findings. Prerequisites To ensure your success in this course, you have experience managing data with Microsoft Excel or Google Sheets 1. Exploring Power BI Reports Topic A: Data Analysis Workflow with Power BI Topic B: Explore Reports in the Power BI Service Topic C: Edit Reports 2. Analyzing Data to Get Answers and Insights Topic A: Configure Data Visualizations Topic B: Ask New Questions by Changing Aggregation Topic C: Find Answers with Calculations 3. Sorting and Grouping Data for Analysis and Reporting Topic A: Sort Data Topic B: Group Data 4. Filtering Visualizations Topic A: Filter Data to Refine Analysis Topic B: Create Slicers for Reports 5. Preparing Reports Topic A: Format and Annotate Reports Topic B: Emphasize Data in Reports 6. Troubleshooting, Sharing, and Collaborating Topic A: Troubleshoot Data Issues Topic B: Collaborate in Power BI Topic C: Collaborate with Non-Power BI Users

Tableau for Data-Driven Decision Makers
By Nexus Human
Duration 1 Days 6 CPD hours This course is intended for This course is designed for professionals in a variety of job roles who receive Tableau data visualizations from data analysts or from data visualization engineers. These data report recipients want to take advantage of the many Tableau features and capabilities that enable them to explore the data behind the initial analysis, perform additional analysis to ask next-level questions of the data, and to customize visualizations and dashboards to share new insights and create compelling reports. Overview Explore Tableau reports. Analyze data to get answers and insights. Sort and group data for analysis and reporting. Filter views. Prepare reports. Troubleshoot, collaborate, and share views and analysis As data acquisition, access, analysis, and reporting are interwoven with our businesses and lives, more and more data is collected about business and personal activities. This abundance of data and the computing power to analyze it has increased the use of data analysis and data visualization across a broad range of job roles. Decision makers of all types, including managers and executives, must interact with, interpret, and develop reports based on data and analysis provided to them. Tableau© software is designed for data analysis and the creation of visualizations. Data analysts prepare data, perform initial analysis, and create visualizations that are then passed on to business data-driven decision makers. These decision makers can use Tableau's tools to explore the data, perform further analysis to find new insights, make decisions, and create customized reports to share their findings. Prerequisites To ensure your success in this course, you should have experience managing data with Microsoft© Excel© or Google Sheets? Lesson 1: Exploring Tableau Reports Topic A: Data Analysis Workflow with Tableau Topic B: Explore Views Topic C: Edit Workbooks Lesson 2: Analyzing Data to Get Answers and Insights Topic A: Configure Marks with the Marks Card Topic B: Ask New Questions by Changing Aggregation Topic C: Find Answers with Calculations Topic D: Answer Questions with Table Calculations Lesson 3: Sorting and Grouping Data for Analysis and Reporting Topic A: Sort Data Topic B: Group Data Lesson 4: Filtering Views Topic A: Filter Data to Refine Analysis Topic B: Create Interactive Filters for Reports Lesson 5: Preparing Reports Topic A: Format and Annotate Views to Tell Your Story Topic B: Emphasize Data in Reports Topic C: Animate Visualizations for Clarity Lesson 6: Troubleshooting, Sharing, and Collaborating Topic A: Troubleshoot Data Issues Topic B: Collaborate in Tableau Online Topic C: Collaborate with Non-Tableau Users
PL-300T00 Microsoft Power BI Data Analyst
By Nexus Human
Duration 3 Days 18 CPD hours This course is intended for The audience for this course are data professionals and business intelligence professionals who want to learn how to accurately perform data analysis using Power BI. This course is also targeted toward those individuals who develop reports that visualize data from the data platform technologies that exist on both in the cloud and on-premises. This course covers the various methods and best practices that are in line with business and technical requirements for modeling, visualizing, and analyzing data with Power BI. The course will show how to access and process data from a range of data sources including both relational and non-relational sources. Finally, this course will also discuss how to manage and deploy reports and dashboards for sharing and content distribution. Prerequisites Understanding core data concepts. Knowledge of working with relational data in the cloud. Knowledge of working with non-relational data in the cloud. Knowledge of data analysis and visualization concepts. DP-900T00 Microsoft Azure Data Fundamentals is recommended 1 - Discover data analysis Overview of data analysis Roles in data Tasks of a data analyst 2 - Get started building with Power BI Use Power BI Building blocks of Power BI Tour and use the Power BI service 3 - Get data in Power BI Get data from files Get data from relational data sources Create dynamic reports with parameters Get data from a NoSQL database Get data from online services Select a storage mode Get data from Azure Analysis Services Fix performance issues Resolve data import errors 4 - Clean, transform, and load data in Power BI Shape the initial data Simplify the data structure Evaluate and change column data types Combine multiple tables into a single table Profile data in Power BI Use Advanced Editor to modify M code 5 - Design a semantic model in Power BI Work with tables Create a date table Work with dimensions Define data granularity Work with relationships and cardinality Resolve modeling challenges 6 - Add measures to Power BI Desktop models Create simple measures Create compound measures Create quick measures Compare calculated columns with measures 7 - Add calculated tables and columns to Power BI Desktop models Create calculated columns Learn about row context Choose a technique to add a column 8 - Use DAX time intelligence functions in Power BI Desktop models Use DAX time intelligence functions Additional time intelligence calculations 9 - Optimize a model for performance in Power BI Review performance of measures, relationships, and visuals Use variables to improve performance and troubleshooting Reduce cardinality Optimize DirectQuery models with table level storage Create and manage aggregations 10 - Design Power BI reports Design the analytical report layout Design visually appealing reports Report objects Select report visuals Select report visuals to suit the report layout Format and configure visualizations Work with key performance indicators 11 - Configure Power BI report filters Apply filters to the report structure Apply filters with slicers Design reports with advanced filtering techniques Consumption-time filtering Select report filter techniques Case study - Configure report filters based on feedback 12 - Enhance Power BI report designs for the user experience Design reports to show details Design reports to highlight values Design reports that behave like apps Work with bookmarks Design reports for navigation Work with visual headers Design reports with built-in assistance Tune report performance Optimize reports for mobile use 13 - Perform analytics in Power BI Explore statistical summary Identify outliers with Power BI visuals Group and bin data for analysis Apply clustering techniques Conduct time series analysis Use the Analyze feature Create what-if parameters Use specialized visuals 14 - Create and manage workspaces in Power BI Distribute a report or dashboard Monitor usage and performance Recommend a development life cycle strategy Troubleshoot data by viewing its lineage Configure data protection 15 - Manage semantic models in Power BI Use a Power BI gateway to connect to on-premises data sources Configure a semantic model scheduled refresh Configure incremental refresh settings Manage and promote semantic models Troubleshoot service connectivity Boost performance with query caching (Premium) 16 - Create dashboards in Power BI Configure data alerts Explore data by asking questions Review Quick insights Add a dashboard theme Pin a live report page to a dashboard Configure a real-time dashboard Set mobile view 17 - Implement row-level security Configure row-level security with the static method Configure row-level security with the dynamic method Additional course details: Nexus Humans PL-300T00: Microsoft Power BI Data Analyst training program is a workshop that presents an invigorating mix of sessions, lessons, and masterclasses meticulously crafted to propel your learning expedition forward. This immersive bootcamp-style experience boasts interactive lectures, hands-on labs, and collaborative hackathons, all strategically designed to fortify fundamental concepts. Guided by seasoned coaches, each session offers priceless insights and practical skills crucial for honing your expertise. Whether you're stepping into the realm of professional skills or a seasoned professional, this comprehensive course ensures you're equipped with the knowledge and prowess necessary for success. While we feel this is the best course for the PL-300T00: Microsoft Power BI Data Analyst course and one of our Top 10 we encourage you to read the course outline to make sure it is the right content for you. Additionally, private sessions, closed classes or dedicated events are available both live online and at our training centres in Dublin and London, as well as at your offices anywhere in the UK, Ireland or across EMEA.